ABSTRACT
Pulses are rich in dietary fiber, complex carbohydrates, starch, minerals such as potassium, iron, zinc etc. Pulses can significantly improve global nutrition, help to eliminate hunger and tackle many chronic health conditions such as obesity and diabetes. Pulses consumption is comparatively higher in Southeast Asia and Africa, where animal proteins are scarce and expensive. The purpose of the study was to investigate mostly consumed pulses, household income and different expenditures of the sample households. A total of 355 sample households (100 rural households and 255 urban households) were collected at Nay Pyi Taw in November, 2021. Descriptive statistics and Student’s t-test were calculated. The average age of the respondents was around 44 years old and they were mostly females. Most of the household members in both groups were between 59 and 19 years of age. The differences of the monthly income, household and food expenditures between the two categories were statistically significant at 1% and 5% levels. Twelve kinds of pulses were explored to be consumed and chickpea, lentil, lablab bean, garden pea, groundnut and cowpea were the topmost consumed pulses by the total sample households. The average expenditure for pulses consumption of both households was less than US$2 per month. Annual per capita consumption of pulses which was around 5 kg was not statistically different in both categories of households, but the consumed amount was much lower than the estimated amount (10 to 13 kg) of annual per capita pulses consumption by the Myanmar Pulses, Beans and Sesame Seeds Merchants Association. Consumers’ awareness to consumption of pulses, a cheap source of plant-based protein, should be promoted. This study has highlighted that Myanmar households should consume more pulses by using higher small amount of food cost than what they are currently been using for having more nutritious and healthy diets via affordable plant-based protein for their future dietary system of their families. Moreover, Myanmar is a leading country in the ASEAN pulses production; therefore, pulses are the suitable cropping pattern for sustainable farming system, surplus food items and exportable crops for country food security and main income earner of the Myanmar. It should be the reason for the policy attention to consider for the pulses sector development not only to increase production but also to increase consumption for Myanmar’s healthy public food system. The healthy diet, affordable and sustainable food systems should be encouraged towards increasing quality of life while decreasing the impact on the environment through pollution, waste and degradation via circular economy in Myanmar.
Keywords: Pulses consumption, plant-based protein, household consumption pattern, healthy diet, Nay Pyi Taw
INTRODUCTION
Myanmar has a diversity of agro-ecological conditions and more than 61 kinds of crops are usually cultivated. Among them, cereal crops constitute 41% of total crop sown area while the sown area of pulses represents about 22% of the total sown areas of different kinds of crops in Myanmar. Major exportable pulses are black gram, green gram, pigeon pea, soy bean, butter bean, kidney bean and cowpea and more than 17 varieties of pulses are grown in Myanmar. Pulses are an important contributor to job creation, GDP and export generation. Myanmar is the world’s fourth largest exporter of pulses after Canada, United States and Australia and the largest exporter in the ASEAN region (MOALI, 2019).
In terms of nutritional aspects, pulses became the essential source of plant-based protein in the developing and least developed countries where the accessibility of animal-based protein is limited. Pulses are abundant in dietary fiber, complex carbohydrates, starch, minerals such as potassium, iron, zinc etc. and low in fat and cholesterol. Pulses also possess antioxidants and have anti-carcinogenic effects. The United Nations has declared 2016 as the International Year of Pulses in order to demonstrate the integral role of pulses in global food security and nutrition and to promote how and why pulses will help to improve the people’s health and wellbeing every day not only in developing countries but also in developed countries (Mukherjee, Naorem, Udayana and Kumar, 2017).
Pulses can considerably improve global nutrition, help to eradicate hunger and tackle many chronic health conditions such as obesity and diabetes. Pulses are consumed all over the world. In India, the largest producer and consumer of pulses in the world, a wide variety of pulses are eaten in different ways such as dal (dried split pulses), papadum, pickle, idli, dosa, laddoo and halwa in order to ensure the diet diversity needed for healthy gut bacteria (Entertainment Times, 2022)
Consumption is comparatively higher in Southeast Asia and Africa, where animal proteins are scarce and expensive. In this part of the world, pulses provide a large proportion of the protein required for adults and children. About 20% of the protein that are currently available to people come from pulses in the developing countries. Pulses are grown by 171 countries in the world. The total area under pulses was 72.3 million ha. This area provided about 64.408 million tons of pulses with productivity of 890 kg/ha (FAO statistics, 2013).
Under these circumstances, the following research question was raised: “Is there any difference in the per capita pulses consumption in the rural and urban areas?” In addition, there are very limited household food system research in Myanmar particularly there is no comparison study of pulses consumption between rural and urban areas in Nay Pyi Taw Union Territory.
Objectives of the study
- To explore socioeconomic characteristics, income and expenditures of sample rural and urban households,
- To investigate mostly consumed pulses types and share of pulses consumption cost to food and household expenditures, and
- To estimate the annual per capita consumption of pulses compared to the sample rural and urban households in Nay Pyi Taw.
METHODOLOGY
Selection of the study area
Nay Pyi Taw consists of the two districts namely Ottara and Dekkina, comprising the eight townships of Ottarathiri, Pobbathiri, Tatkon, Zeyathiri, Dekkinathiri, Lewe, Pyinmana and Zabuthiri. It is situated between north latitude 19 ̊ 76' and east longitudes 96 ̊ 07'. Nay Pyi Taw was selected as the study area where different types of households which have various clusters and strata can be found. The respondents were mostly housewives who were handling cooking, daily chores and the household responsibilities in order to ensure the precise data about household consumption, income and expenditures.
Data collection and analysis
The survey was conducted in Nay Pyi Taw Union Territory in November 2021. In order to obtain a representative sample, the research was conducted by the mixed use of representative sampling plans. The sample was clustered into rural and urban households and the housewives or family members who were actually managing food were purposively selected for the data accuracy. Primary data were collected from the targeted respondents by a well-structured interview schedule.
The participation was based on a voluntary way and convenience sampling and total 355 sample households (100 rural households and 255 urban households) were obtained. The data entry was carried out in Microsoft Excel and analyzed by using STATA version 14. Descriptive statistics such as mean, maximum, minimum, standard deviation, frequency and percentage were calculated to explore socioeconomic characteristics and income and expenditures of sample households. Student’s t-test was computed in order to compare the significant differences between the sample rural and urban households.
RESULTS AND DISCUSSION
Socioeconomic characteristics of sample households
The basic socioeconomic characteristics of sample households were presented in Tables 1, 2, 3 and 4. The average age and household size were described in Table 1. In the study area, the average age was about 44 years in both rural and urban area. In the rural area, the minimum age was 18 and the maximum age was 75 and the minimum age was 19 and the maximum age was 91 in the urban area. The average household size was 4.64 in the rural area and 3.38 in the urban area. The minimum and maximum household size was 1 and 13 in the rural area and that of urban area was 1 and 10, respectively.
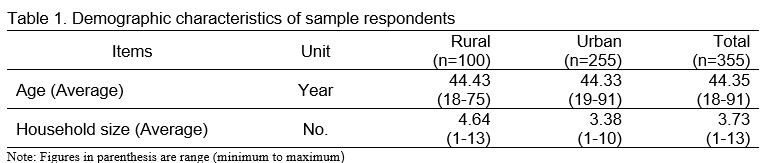
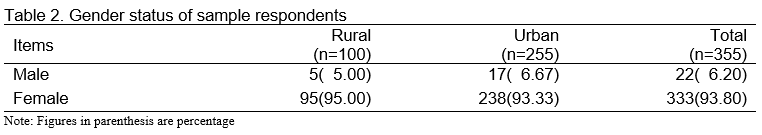
Table 2 showed that the majority of respondents were females in both rural and urban households while only around 5% and 7% were males in both categories of sample households.
The respondents were also categorized according to their education levels and types of occupation. The highest number of sample rural households (45%) had middle school education followed by (32%) primary education, (15%) high school education and (8%) graduate level whereas the maximum number of sample urban households (55.29%) were graduates followed by (20%) high school education, (14.51%) middle school education and (10.20%) primary education as shown in Table 3.
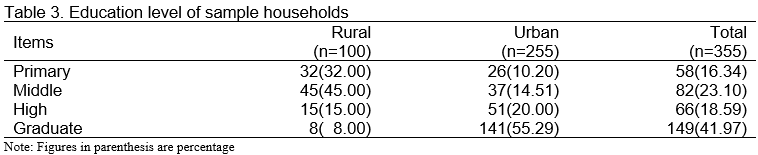
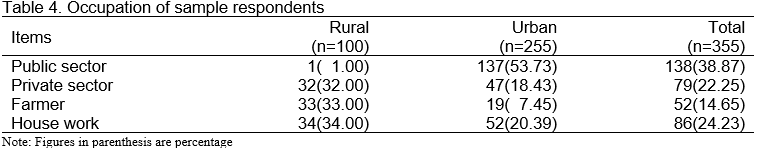
Table 4 described the categories of occupation; the maximum number (34.00%) of respondents of the sample rural households managed the house works while only 20.39% of that of urban households was doing daily chores. The profession of the highest number of respondents of the sample urban households (53.73%) was government staff although only one percent of respondents of the sample rural households were working at the public sector. The lowest number of respondents of the sample urban households (7.45%) was farmers while the second most number of that of rural households (33.00%) were farmers.
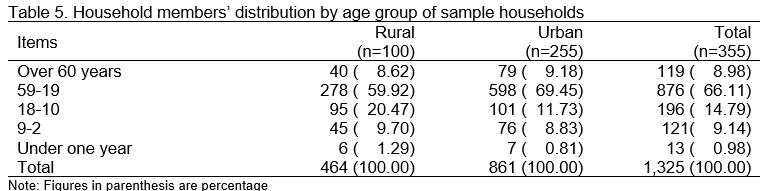
In the sample households, there were 1,325 household members in total. The majority of household members, 59.92% of rural households, were between 59-19 years of age group followed by between 18-10 years of age group (20.47%), between 9-2 years (9.70%), over 60 years (8.62%) and under one year (1.29%). The highest percent (69.45%) of urban households were between 59-19 years of age group and 11.73% were between 18 and 10, 9.18% over 60 years, 8.83% between 9-2 years and 0.81% under one year of age group, respectively.
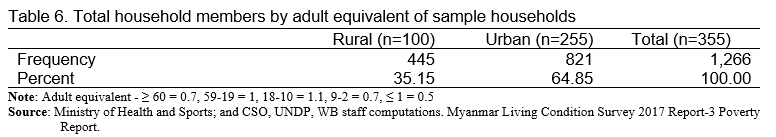
According to the adult equivalent ratio which took only 0.7 for an adult who was 60 years old and above and for a child who was between 9 and 2 years of age and 1 for people who were between 59 and 19 years, 1.1 for those who were between 18 and 10 years and 0.5 for a child who was under one year of age, only 1,266 household members could be found in total although there were 1,325 households in sample households as described in Table 6.
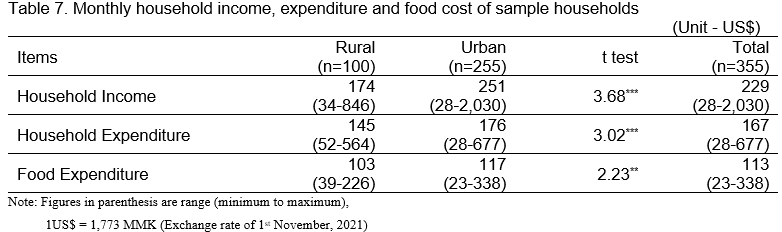
The monthly household income, expenditure and food cost of the sample households were shown in Table 7. For the rural households, the average monthly income was around US$174 (MMK0.3 million), that of monthly expenditure was US$145 (more than MMK0.25 million) and that of food cost was US$103 (around MMK0.18 million). The average income, household and food expenditure of urban households were around US$251 (MMK0.45 million), US$176 (MMK0.3 million) and US$117 (MMK0.2 million) per month respectively. The differences of the monthly income and household expenditure between the rural and urban households were statistically significant at 1% level and that of monthly food expenditure was significant at 5% level.
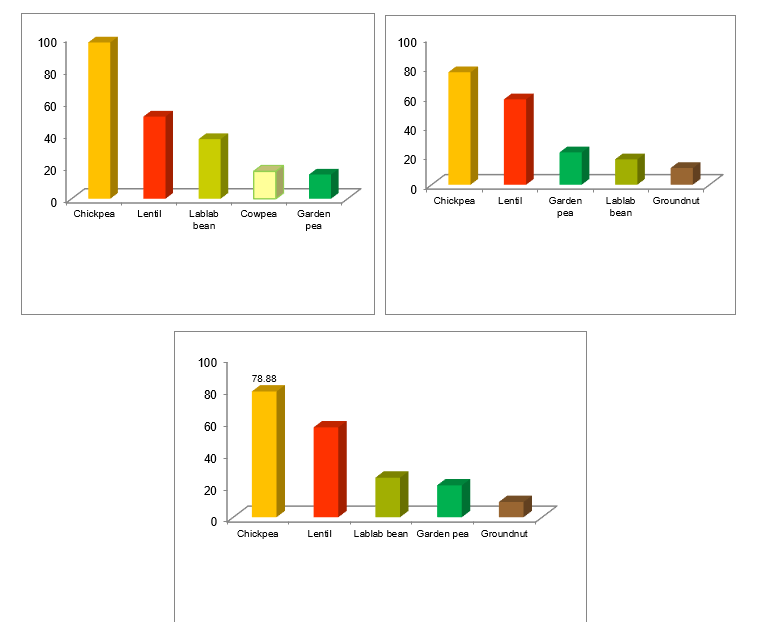
Twelve kinds of pulses were observed to be consumed by the total sample households. The five most- consumed kinds of pulses of the sample households were illustrated in Figures 1, 2 and 3 separately. Chickpea, lentil, lablab bean, garden pea and groundnut were the most consumed pulses by the total sample households. The highest consumed kind of pulses by rural households was chickpea (97%) followed by lentil (51%), lablab bean (37%), cowpea (17%) and garden pea (15%), -respectively. For the urban households, 76.47% of chickpea, 58.04% of lentil, 21.96% of garden pea, 17.26% of lablab bean and 11.37% of groundnut are consumed correspondingly.
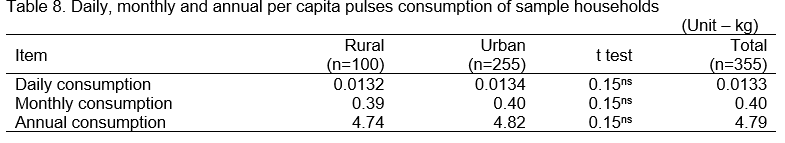
The average pulses consumption of the sample rural households was shown as per daily, monthly and yearly basis in Table 8. The average daily consumption of rural and urban households was 0.0132 kg and 0.0134 kg in which there was no statistically difference. The monthly and yearly consumption of pulses by the rural households were 0.39 kg and 4.74 kg and those of the urban households were 0.40 kg and 4.82 kg respectively. The differences of both consumption amounts of the rural and urban households were not statistically significant. According to Tun Lwin (2020), the chairman of the Myanmar Pulses, Beans and Sesame Seeds Merchants Association, per capita consumption of pulses was estimated as 10 to 13 kg which has very much difference compared to the consumption amounts of the sample households in the study area.
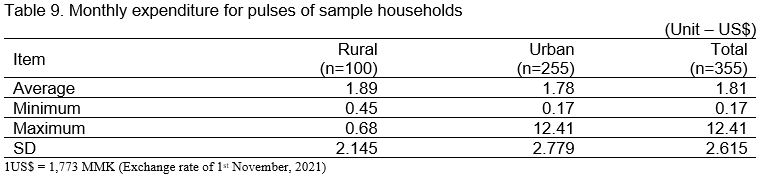
Table 9 revealed the average monthly expenditure for pulses of the sample rural and urban households. The average expenditure for pulses of the rural households was less than US$1.89 (MMK3,000) per months and the range was from US$0.45 to 0.68 (MMK800 to 12,000) per months. The sample urban households spent around US$1.78 (MMK3,154) per month on pulses consumption. The minimum amount of US$0.71 (MMK300) to the maximum amount of US$12.41 (MMK22,000) was spent on pulses consumption per monthly basis by the sample urban households in the study area.
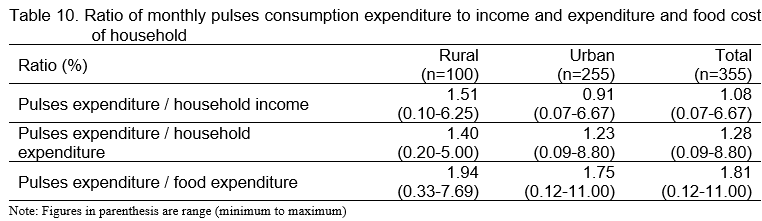
The ratio of pulses consumption expenditure to household income, household expenditure and food cost per monthly basis were presented in Table 10. The ratio of pulses consumption expenditure to household income of the rural households was around 1.5% and that of the urban households was less than 1%. The range was from 0.07 to 6.67% for the total sample households. The ratios of pulses consumption expenditure to household expenditure of the rural and urban households were 1.40% and 1.23% respectively. The range of the total sample households was from 0.09% to 8.80%. The cost of pulses consumption was only around 2% of the total food consumption expenditures of both rural and urban households. The range of the consumption expenditure ratios was from 0.12% to 11%. This information pointed out that expense of pulses consumption has very low proportion been used currently by the sample households. It would be concluded that sample households could be able to consume more pulses in order to get the required protein from a plant-based source with a cheap cost for their healthy diet system.
CONCLUSION AND RECOMMENDATION
As stated by the study, the average age of the respondents was around 44 years old and the average household size was around and slightly more than 4 persons. The respondents of both rural and urban households were mostly females. In the rural households, most of the respondents had the middle school education and were doing the house works while most were graduates and working at the government sector in the urban households. The household members in both groups were between 59 and 19 years of age group. In comparison of both groups, the urban households not only earned higher income but also spent more household and food expenditures than the rural households and the difference was statistically significant at 1% and 5% level. Twelve kinds of pulses were consumed and chickpea, lentil, lablab bean, garden pea, groundnut and cowpea were the topmost consumed pulses by the total sample households. The average expenditure for pulses consumption of both households was less than US$2 per month. Annual per capita consumption of pulses which was around 5 kg was not statistically different in both categories of household, but the amount was much lower than the estimated amount of annual per capita pulses consumption by the Myanmar Pulses, Beans and Sesame Seeds Merchants Association.
Consumption of half a cup of beans or peas per day can enhance diet quality by nutrients (Entertainment Times, 2022).The ratios of consumption expenditure of pulses to household income, expenditure and food cost of the sample households were only below 2% and this revealed that households could acquire the daily requirement of nutrients especially the protein they need from a plant-based source.
This study has highlighted that Myanmar households should consume more pulses by using small amount of food cost than they currently used for having more nutritious and healthy diet via affordable plant-based protein for their future dietary system of the family. Moreover, Myanmar is a leading country of the ASEAN pulses production: It should be the reason for the policy attention to consider for the pulses sector development not only to increase production but also to increase consumption for Myanmar healthy public food system.
Therefore, more researches should be invested in discovering the role of pulses consumption in the daily consumption patterns of households in order to ensure the nutrient security and promote the sustainable agriculture in the circular economy pathways. The healthy diets, affordable and sustainable food systems should be encouraged towards increasing the awareness of pulses consumption through food and nutrition education programs.
REFERENCES
Entertainment Times (2022). The Times of India timesofindia.indiatimes.com/life-style/food-news/3-rules-you-must-follow-while-eating-pulses/photostory/89543724.cms?picid=89543782
Food and Agriculture Organization. FAO (2013). FAO Statistical Yearbook 2013:https://www.fao.org/3/ i3107e /i3107e00.htm
Ministry of Agriculture, Livestock and Irrigation. (2019). Myanmar Agriculture Sector in Brief, Department of Planning, The Republic of Union of Myanmar.
Ministry of Health and Sports. MOHS (2017) and CSO, UNDP, WB staff computations. Myanmar Living Condition Survey 2017 Report-3 Poverty Report. https://documents.worldbank.org/ curated/en/ 9210 21561058201854/pdf/Myanmar-Living-Condition-Survey-2017-Report-3-Poverty-Report.pdf
Mukherjee, A. K., Naorem, A., Udayana, S. K., & Kumar, G. (2017). Nutritional value of pulses and their importance in human life. Innovative Farming, 2(1): 57-62.
Tun Lwin (2020). Pulses from Myanmar: An Interview with Tun Lwin, the Chairman of the Myanmar Pulses, Beans and Sesame Seeds Merchants Association. https://pulsepod.globalpulses.com/trade-talk/post/pulses-from-myanmar-an-interview-with-tun-lwin

Household Pulses Consumption, Healthy Diets in Circular Economy: A Case Study in Nay Pyi Taw, Myanmar
ABSTRACT
Pulses are rich in dietary fiber, complex carbohydrates, starch, minerals such as potassium, iron, zinc etc. Pulses can significantly improve global nutrition, help to eliminate hunger and tackle many chronic health conditions such as obesity and diabetes. Pulses consumption is comparatively higher in Southeast Asia and Africa, where animal proteins are scarce and expensive. The purpose of the study was to investigate mostly consumed pulses, household income and different expenditures of the sample households. A total of 355 sample households (100 rural households and 255 urban households) were collected at Nay Pyi Taw in November, 2021. Descriptive statistics and Student’s t-test were calculated. The average age of the respondents was around 44 years old and they were mostly females. Most of the household members in both groups were between 59 and 19 years of age. The differences of the monthly income, household and food expenditures between the two categories were statistically significant at 1% and 5% levels. Twelve kinds of pulses were explored to be consumed and chickpea, lentil, lablab bean, garden pea, groundnut and cowpea were the topmost consumed pulses by the total sample households. The average expenditure for pulses consumption of both households was less than US$2 per month. Annual per capita consumption of pulses which was around 5 kg was not statistically different in both categories of households, but the consumed amount was much lower than the estimated amount (10 to 13 kg) of annual per capita pulses consumption by the Myanmar Pulses, Beans and Sesame Seeds Merchants Association. Consumers’ awareness to consumption of pulses, a cheap source of plant-based protein, should be promoted. This study has highlighted that Myanmar households should consume more pulses by using higher small amount of food cost than what they are currently been using for having more nutritious and healthy diets via affordable plant-based protein for their future dietary system of their families. Moreover, Myanmar is a leading country in the ASEAN pulses production; therefore, pulses are the suitable cropping pattern for sustainable farming system, surplus food items and exportable crops for country food security and main income earner of the Myanmar. It should be the reason for the policy attention to consider for the pulses sector development not only to increase production but also to increase consumption for Myanmar’s healthy public food system. The healthy diet, affordable and sustainable food systems should be encouraged towards increasing quality of life while decreasing the impact on the environment through pollution, waste and degradation via circular economy in Myanmar.
Keywords: Pulses consumption, plant-based protein, household consumption pattern, healthy diet, Nay Pyi Taw
INTRODUCTION
Myanmar has a diversity of agro-ecological conditions and more than 61 kinds of crops are usually cultivated. Among them, cereal crops constitute 41% of total crop sown area while the sown area of pulses represents about 22% of the total sown areas of different kinds of crops in Myanmar. Major exportable pulses are black gram, green gram, pigeon pea, soy bean, butter bean, kidney bean and cowpea and more than 17 varieties of pulses are grown in Myanmar. Pulses are an important contributor to job creation, GDP and export generation. Myanmar is the world’s fourth largest exporter of pulses after Canada, United States and Australia and the largest exporter in the ASEAN region (MOALI, 2019).
In terms of nutritional aspects, pulses became the essential source of plant-based protein in the developing and least developed countries where the accessibility of animal-based protein is limited. Pulses are abundant in dietary fiber, complex carbohydrates, starch, minerals such as potassium, iron, zinc etc. and low in fat and cholesterol. Pulses also possess antioxidants and have anti-carcinogenic effects. The United Nations has declared 2016 as the International Year of Pulses in order to demonstrate the integral role of pulses in global food security and nutrition and to promote how and why pulses will help to improve the people’s health and wellbeing every day not only in developing countries but also in developed countries (Mukherjee, Naorem, Udayana and Kumar, 2017).
Pulses can considerably improve global nutrition, help to eradicate hunger and tackle many chronic health conditions such as obesity and diabetes. Pulses are consumed all over the world. In India, the largest producer and consumer of pulses in the world, a wide variety of pulses are eaten in different ways such as dal (dried split pulses), papadum, pickle, idli, dosa, laddoo and halwa in order to ensure the diet diversity needed for healthy gut bacteria (Entertainment Times, 2022)
Consumption is comparatively higher in Southeast Asia and Africa, where animal proteins are scarce and expensive. In this part of the world, pulses provide a large proportion of the protein required for adults and children. About 20% of the protein that are currently available to people come from pulses in the developing countries. Pulses are grown by 171 countries in the world. The total area under pulses was 72.3 million ha. This area provided about 64.408 million tons of pulses with productivity of 890 kg/ha (FAO statistics, 2013).
Under these circumstances, the following research question was raised: “Is there any difference in the per capita pulses consumption in the rural and urban areas?” In addition, there are very limited household food system research in Myanmar particularly there is no comparison study of pulses consumption between rural and urban areas in Nay Pyi Taw Union Territory.
Objectives of the study
METHODOLOGY
Selection of the study area
Nay Pyi Taw consists of the two districts namely Ottara and Dekkina, comprising the eight townships of Ottarathiri, Pobbathiri, Tatkon, Zeyathiri, Dekkinathiri, Lewe, Pyinmana and Zabuthiri. It is situated between north latitude 19 ̊ 76' and east longitudes 96 ̊ 07'. Nay Pyi Taw was selected as the study area where different types of households which have various clusters and strata can be found. The respondents were mostly housewives who were handling cooking, daily chores and the household responsibilities in order to ensure the precise data about household consumption, income and expenditures.
Data collection and analysis
The survey was conducted in Nay Pyi Taw Union Territory in November 2021. In order to obtain a representative sample, the research was conducted by the mixed use of representative sampling plans. The sample was clustered into rural and urban households and the housewives or family members who were actually managing food were purposively selected for the data accuracy. Primary data were collected from the targeted respondents by a well-structured interview schedule.
The participation was based on a voluntary way and convenience sampling and total 355 sample households (100 rural households and 255 urban households) were obtained. The data entry was carried out in Microsoft Excel and analyzed by using STATA version 14. Descriptive statistics such as mean, maximum, minimum, standard deviation, frequency and percentage were calculated to explore socioeconomic characteristics and income and expenditures of sample households. Student’s t-test was computed in order to compare the significant differences between the sample rural and urban households.
RESULTS AND DISCUSSION
Socioeconomic characteristics of sample households
The basic socioeconomic characteristics of sample households were presented in Tables 1, 2, 3 and 4. The average age and household size were described in Table 1. In the study area, the average age was about 44 years in both rural and urban area. In the rural area, the minimum age was 18 and the maximum age was 75 and the minimum age was 19 and the maximum age was 91 in the urban area. The average household size was 4.64 in the rural area and 3.38 in the urban area. The minimum and maximum household size was 1 and 13 in the rural area and that of urban area was 1 and 10, respectively.
Table 2 showed that the majority of respondents were females in both rural and urban households while only around 5% and 7% were males in both categories of sample households.
The respondents were also categorized according to their education levels and types of occupation. The highest number of sample rural households (45%) had middle school education followed by (32%) primary education, (15%) high school education and (8%) graduate level whereas the maximum number of sample urban households (55.29%) were graduates followed by (20%) high school education, (14.51%) middle school education and (10.20%) primary education as shown in Table 3.
Table 4 described the categories of occupation; the maximum number (34.00%) of respondents of the sample rural households managed the house works while only 20.39% of that of urban households was doing daily chores. The profession of the highest number of respondents of the sample urban households (53.73%) was government staff although only one percent of respondents of the sample rural households were working at the public sector. The lowest number of respondents of the sample urban households (7.45%) was farmers while the second most number of that of rural households (33.00%) were farmers.
In the sample households, there were 1,325 household members in total. The majority of household members, 59.92% of rural households, were between 59-19 years of age group followed by between 18-10 years of age group (20.47%), between 9-2 years (9.70%), over 60 years (8.62%) and under one year (1.29%). The highest percent (69.45%) of urban households were between 59-19 years of age group and 11.73% were between 18 and 10, 9.18% over 60 years, 8.83% between 9-2 years and 0.81% under one year of age group, respectively.
According to the adult equivalent ratio which took only 0.7 for an adult who was 60 years old and above and for a child who was between 9 and 2 years of age and 1 for people who were between 59 and 19 years, 1.1 for those who were between 18 and 10 years and 0.5 for a child who was under one year of age, only 1,266 household members could be found in total although there were 1,325 households in sample households as described in Table 6.
The monthly household income, expenditure and food cost of the sample households were shown in Table 7. For the rural households, the average monthly income was around US$174 (MMK0.3 million), that of monthly expenditure was US$145 (more than MMK0.25 million) and that of food cost was US$103 (around MMK0.18 million). The average income, household and food expenditure of urban households were around US$251 (MMK0.45 million), US$176 (MMK0.3 million) and US$117 (MMK0.2 million) per month respectively. The differences of the monthly income and household expenditure between the rural and urban households were statistically significant at 1% level and that of monthly food expenditure was significant at 5% level.
Twelve kinds of pulses were observed to be consumed by the total sample households. The five most- consumed kinds of pulses of the sample households were illustrated in Figures 1, 2 and 3 separately. Chickpea, lentil, lablab bean, garden pea and groundnut were the most consumed pulses by the total sample households. The highest consumed kind of pulses by rural households was chickpea (97%) followed by lentil (51%), lablab bean (37%), cowpea (17%) and garden pea (15%), -respectively. For the urban households, 76.47% of chickpea, 58.04% of lentil, 21.96% of garden pea, 17.26% of lablab bean and 11.37% of groundnut are consumed correspondingly.
The average pulses consumption of the sample rural households was shown as per daily, monthly and yearly basis in Table 8. The average daily consumption of rural and urban households was 0.0132 kg and 0.0134 kg in which there was no statistically difference. The monthly and yearly consumption of pulses by the rural households were 0.39 kg and 4.74 kg and those of the urban households were 0.40 kg and 4.82 kg respectively. The differences of both consumption amounts of the rural and urban households were not statistically significant. According to Tun Lwin (2020), the chairman of the Myanmar Pulses, Beans and Sesame Seeds Merchants Association, per capita consumption of pulses was estimated as 10 to 13 kg which has very much difference compared to the consumption amounts of the sample households in the study area.
Table 9 revealed the average monthly expenditure for pulses of the sample rural and urban households. The average expenditure for pulses of the rural households was less than US$1.89 (MMK3,000) per months and the range was from US$0.45 to 0.68 (MMK800 to 12,000) per months. The sample urban households spent around US$1.78 (MMK3,154) per month on pulses consumption. The minimum amount of US$0.71 (MMK300) to the maximum amount of US$12.41 (MMK22,000) was spent on pulses consumption per monthly basis by the sample urban households in the study area.
The ratio of pulses consumption expenditure to household income, household expenditure and food cost per monthly basis were presented in Table 10. The ratio of pulses consumption expenditure to household income of the rural households was around 1.5% and that of the urban households was less than 1%. The range was from 0.07 to 6.67% for the total sample households. The ratios of pulses consumption expenditure to household expenditure of the rural and urban households were 1.40% and 1.23% respectively. The range of the total sample households was from 0.09% to 8.80%. The cost of pulses consumption was only around 2% of the total food consumption expenditures of both rural and urban households. The range of the consumption expenditure ratios was from 0.12% to 11%. This information pointed out that expense of pulses consumption has very low proportion been used currently by the sample households. It would be concluded that sample households could be able to consume more pulses in order to get the required protein from a plant-based source with a cheap cost for their healthy diet system.
CONCLUSION AND RECOMMENDATION
As stated by the study, the average age of the respondents was around 44 years old and the average household size was around and slightly more than 4 persons. The respondents of both rural and urban households were mostly females. In the rural households, most of the respondents had the middle school education and were doing the house works while most were graduates and working at the government sector in the urban households. The household members in both groups were between 59 and 19 years of age group. In comparison of both groups, the urban households not only earned higher income but also spent more household and food expenditures than the rural households and the difference was statistically significant at 1% and 5% level. Twelve kinds of pulses were consumed and chickpea, lentil, lablab bean, garden pea, groundnut and cowpea were the topmost consumed pulses by the total sample households. The average expenditure for pulses consumption of both households was less than US$2 per month. Annual per capita consumption of pulses which was around 5 kg was not statistically different in both categories of household, but the amount was much lower than the estimated amount of annual per capita pulses consumption by the Myanmar Pulses, Beans and Sesame Seeds Merchants Association.
Consumption of half a cup of beans or peas per day can enhance diet quality by nutrients (Entertainment Times, 2022).The ratios of consumption expenditure of pulses to household income, expenditure and food cost of the sample households were only below 2% and this revealed that households could acquire the daily requirement of nutrients especially the protein they need from a plant-based source.
This study has highlighted that Myanmar households should consume more pulses by using small amount of food cost than they currently used for having more nutritious and healthy diet via affordable plant-based protein for their future dietary system of the family. Moreover, Myanmar is a leading country of the ASEAN pulses production: It should be the reason for the policy attention to consider for the pulses sector development not only to increase production but also to increase consumption for Myanmar healthy public food system.
Therefore, more researches should be invested in discovering the role of pulses consumption in the daily consumption patterns of households in order to ensure the nutrient security and promote the sustainable agriculture in the circular economy pathways. The healthy diets, affordable and sustainable food systems should be encouraged towards increasing the awareness of pulses consumption through food and nutrition education programs.
REFERENCES
Entertainment Times (2022). The Times of India timesofindia.indiatimes.com/life-style/food-news/3-rules-you-must-follow-while-eating-pulses/photostory/89543724.cms?picid=89543782
Food and Agriculture Organization. FAO (2013). FAO Statistical Yearbook 2013:https://www.fao.org/3/ i3107e /i3107e00.htm
Ministry of Agriculture, Livestock and Irrigation. (2019). Myanmar Agriculture Sector in Brief, Department of Planning, The Republic of Union of Myanmar.
Ministry of Health and Sports. MOHS (2017) and CSO, UNDP, WB staff computations. Myanmar Living Condition Survey 2017 Report-3 Poverty Report. https://documents.worldbank.org/ curated/en/ 9210 21561058201854/pdf/Myanmar-Living-Condition-Survey-2017-Report-3-Poverty-Report.pdf
Mukherjee, A. K., Naorem, A., Udayana, S. K., & Kumar, G. (2017). Nutritional value of pulses and their importance in human life. Innovative Farming, 2(1): 57-62.
Tun Lwin (2020). Pulses from Myanmar: An Interview with Tun Lwin, the Chairman of the Myanmar Pulses, Beans and Sesame Seeds Merchants Association. https://pulsepod.globalpulses.com/trade-talk/post/pulses-from-myanmar-an-interview-with-tun-lwin