ABSTRACT
Food delivery applications have grown rapidly in recent years, fueled by increasing consumer demand for convenience and prepared foods. Previous studies on what factors encourage consumers to use delivery platforms rely largely on survey data, likely due to the lack of availability of restaurant or industry level data. Utilizing web scraping techniques to collect restaurant level data from one of the biggest delivery applications in South Korea, Yogiyo, this study conducts an analysis on spatial market structure of the restaurant business. Through restaurant level data, market expansion, changes in the number of restaurants to order from, and changes in prices across regions with delivery application are considered. Analysis suggests that the average number of orderable restaurants increased from a nearby 2.3 restaurants to distant 13.5 restaurants with customers willingly paying for delivery fees according to distance via the delivery application. As the restaurant delivery market becomes more competitive, it is found that aggregate prices totaled with food prices and delivery fees from two restaurants in different locations converge to serve the customer between the two restaurants, which may benefit customers with more competitive pricing. This exploratory study uniquely demonstrates how web-scrapped data and network analysis can be used for gaining insights on geographical market structure of food markets by presenting variations in such information as food prices and/or the number of restaurants across the subdivided regions in Seoul, South Korea.
Keywords: food delivery; food economics; restaurant business; spatial competition; web scraping; network analysis
INTRODUCTION
The global food delivery market size reached US$106.1 billion in 2021 (IMARC, 2021a) and it is expected to grow at a CAGR (Compounded Annual Growth Rate) of 11.44% over the period 2022 through 2027, reaching US$223.7 billion (IMARC, 2021b). The food service industry has undergone substantial changes recently with the rapid growth in innovative food delivery applications on smartphones and desktops. An increasing number of consumers and restaurant owners have adopted delivery applications/platforms for convenience and profit improvement, respectively.
Almost half the population of South Korea is using delivery applications to order food from restaurants delivered to dinner tables (MobileIndex, 2022a). South Korea has a food delivery marketplace which is valued at almost 10 times what it was just four years ago (Statistics Korea, 2022a). According to the Statistics Korea (2022a), the size of the food service delivery market, where the top three delivery platforms account for more than 90%, is estimated to be US$21.4 billion in 2021. Recently social distancing due to the COVID-19 pandemic limits mobility of people to dine out, inducing rapid delivery platform growth over the past two years under the pandemic (Statistics Korea, 2022b).
The rapid growth of delivery applications has brought many changes in the restaurant industry. For example, consumers have more options for ordering diverse foods as restaurants may expand their geographical service areas to more distant customers. As markets develop monopolistic delivery platforms could potentially seek to charge higher delivery fees to consumers and/or higher commissions to restaurants which could lead to higher menu prices if such costs are passed along (Global Competition Review, 2022; Korea JoongAng Daily, 2021a). In addition, more competition among restaurants which possibly benefits consumers may place pressure on small restaurants’ thin profit margins. Extended delivery to distant destinations leads to longer travel time of food, bringing a food safety issue into the topic of food delivery (CDC, 2022).
To the authors' best knowledge, there has not been much economic research on changes in the market structure of the restaurant markets/food delivery service industries induced by the appearance of delivery applications. Because online food delivery is an emerging phenomenon, most of the existing studies analyzed consumer behavior or attitude based on psychological, marketing, and communication standpoints, but not market structure based on economic knowledge. Previous studies have examined consumers’ intention of adopting online food delivery services (Gunden et al., 2020; Hwang et al., 2019; Hwang and Kim, 2021; Okumus et al., 2018; Ray et al., 2019; Wang and Scrimgeour, 2021). Another group of existing studies are about consumers’ motivation to use delivery applications (Jiang et al., 2023; Novita and Husna, 2020; Ray et al., 2019; Tandon et al., 2021) and to return to the applications (Alalwan, 2020). A few published studies have estimated consumers’ willingness to pay (WTP) for the delivery application service (Hwang et al., 2020), examined rate of satisfaction (Alalwan, 2020; Cho et al., 2019; Kumar and Shah, 2021; Meena and Kumar, 2022; Shah et al., 2023; Zhao and Bacao, 2020). However, existing literature largely lacks a market structure approach, indicating the findings of this study may contribute to providing a new insight for the online food delivery industry.
One reason for the lack of empirical research on restaurant businesses with delivery platforms may be the unavailability of restaurant level data. In the existing studies, data have been collected mainly through surveys of consumers/customers. Three papers constitute exceptions (Cheng et al., 2021; Correa et al., 2019; Williams et al., 2020) and they used web-scraping or mining for data collection for restaurant businesses. Correa et al. (2019) in their analysis of the relationship between actual delivery time and restaurants’ performance use web-scraping and other online data sources such as Facebook and Google Maps API. Correa et al. (2019) scraped key performance indicators such as consumer review comments of fast-food providers from a Colombian online food delivery platform. They also generated information on traffic conditions by utilizing the location of the restaurants obtained from Facebook and travel time from Google Maps API. Traffic conditions were found to have exerted no practical effects on transaction volume and delivery time fulfillment, even though early deliveries showed a mild association with the number of comments provided by customers after receiving their orders at home (Correa et al., 2019). In addition, Cheng et al. (2021) and Williams et al. (2020) studied consumer attitudes toward restaurants or online food delivery by scraping comments from App store reviews, online communities, blogs or media.
Recently, there appeared a new data collection technique in online space namely web-scraping, to collect data from online retailers or social media platforms (Jung, 2021; Cavallo, 2020; Cavallo and Rigobon, 2016). Recent analyses on food products have used web-scraping to facilitate data collection on product data, including reviews (Etumnu et al., 2020). This study utilizes web-scraping for collecting such data in restaurant businesses as information of item names, prices, delivery fees, possible delivery regions, and exact restaurant locations with addresses that are available from online delivery applications in South Korea. Compared to consumers survey data for expenditures on food service or food away from home, web-scraping has several benefits. First, web-scraping collects information from all the restaurants registered in the delivery application with detailed attributes of restaurants and dishes, such as exact locations of restaurants with address, menu prices, all deliverable destinations and differentiated delivery fees, etc. On the other hand, consumer surveys provide such information only on purchased dishes from chosen restaurants, which limits generalization of analyses and insights. Second, web-scraping allows precise data collection from literal descriptions from the application while consumers surveys rely on respondents’ recollecting activities and/or experiences. That being said, web-scraped data provides high quality datasets with reduced possibility of missing or mis-specified information.
To the best of authors’ knowledge, this study is the first to research market structure in the restaurant markets with food delivery services using data amassed from delivery applications[1], thus exploiting web-scraping and network analysis applied to examine relations across regions. Conducting network analysis with scraped data including geographical information of restaurants allows the authors to investigate spatial market structure of restaurant businesses, allowing insights into how restaurants facing different market condition adjust their pricing strategies. The primary objectives of this study are: 1) sharing new methods of data collection (web-scraping) and analyzing technique (network analysis) for investigating the restaurant business; and 2) providing empirical research about online delivery platform and market structure of the restaurant business utilizing the big data scraped.
CONCEPTUAL BACKGROUND
Changes in Delivery Industry with the Appearance of Delivery Applications
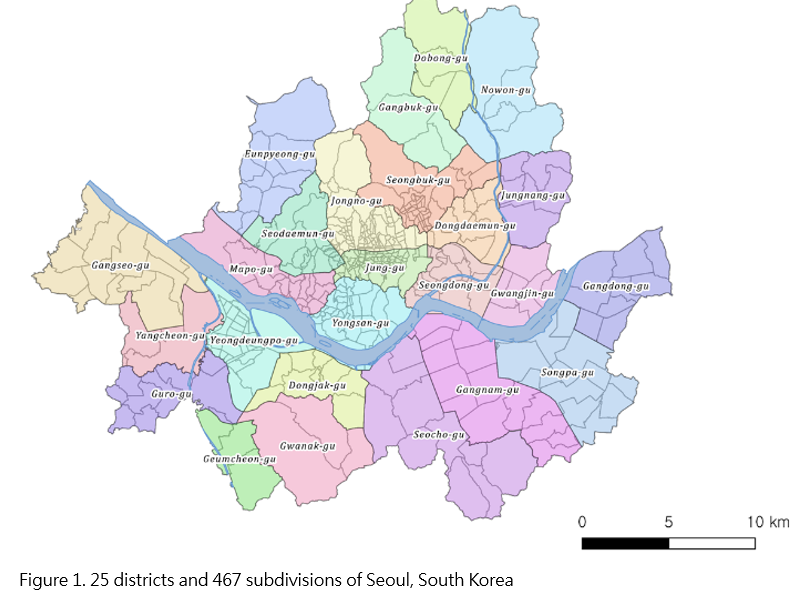
Seoul, the capital city of South Korea and home to 20% of the total country’s population, is composed of 25 administrative districts called “Gu”, with 467 legal-status subdivisions called “Dong” (Figure 1). The average area of 25 districts is 24 square kilometers ranging from 10 to 47 square kilometers (Seoul Open Data, 2021). Boldly estimating, 5 kilometers (3 – 7 kilometers) may be a maximum distance of delivery inside districts from edge to edge which takes up to 15-20 minute-delivery time. Furthermore, the average area of 467 subdivisions is 1.43 square kilometers ranging from 0.23 to 12.68 square kilometers (Seoul Open Data, 2021). The maximum distance from edge to edge is 1.2 kilometers (0.5 - 3.6 kilometers), taking up to 3-5 minutes-delivery time.
Considering most restaurants on delivery applications provide information about delivery regions based on the level of subdivision, it is assumed by authors that delivery markets are generally defined as a single subdivision, sometimes including neighboring subdivisions depending on precise restaurant locations. In South Korea, delivery costs used to be absorbed by restaurant owners and customers did not pay ‘delivery fees’ before delivery applications came into play in the restaurant industry in early 2010 (Kim, 2009). Restaurant owners hired part-time delivery drivers or riders, most of whom used to earn almost minimum wage. Given the limited geographical scope in which delivery was available, there was less competition among restaurants in localized markets due both to the delivery-related costs that restaurant owners were responsible for and food quality quickly degraded depending on delivery time, limiting arbitrage.
With the appearance of delivery applications, however, delivery fees have been introduced and are passed on to customers. The non-trivial delivery fees have created independent professional delivery drivers or riders, who are encouraged to deliver to a little farther location than the restaurants themselves did previously. The introduction of delivery fees through the delivery applications has spurred more options of restaurants for consumers to order from through the expanded delivery market boundaries.[2] Customers may now be able to order food items from distant restaurants by paying higher delivery fees.
Restaurant’s menu prices are not determined solely by its direct costs of inputs such as ingredients, electricity, and gas, but also by costs of other economic factors varying across districts depending on zoning attributes whether it is residential or commercial/business regions such as rent payment and/or average incomes. Thus, it is possible that ordering a food item from a restaurant located in another subdivision is cheaper than ordering a comparable food item from a restaurant located in a subdivision where customers are staying. If it is the case, geographical market size of restaurants can be expanded with delivery applications compared to pre-delivery application era.
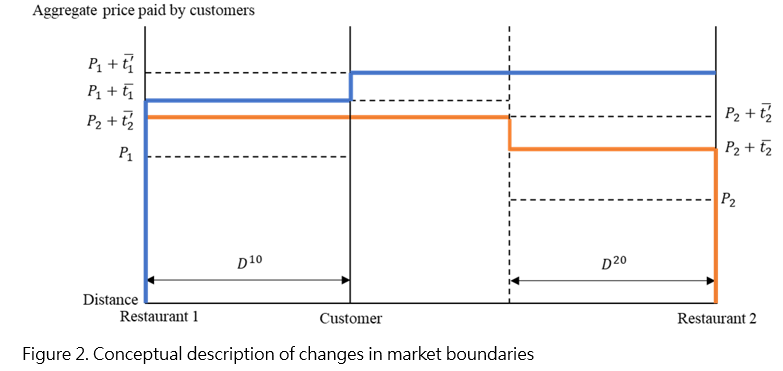
Delivery fees incurred in Korean delivery applications are based on uniform-delivered pricing with multiple zones addressing subdivisions in this study (Baedal Minjok, 2022). All customers within a subdivision are charged the same delivery fee irrespective of their specific locations within that subdivision. However, delivery fees vary by subdivision depending on distance from restaurants. Figure 2 illustrates conceptual description of changes in market boundaries. Figure 2 describes the market structure and its changes based on uniform-delivery pricing. Before the delivery platform came into play, restaurant 1 with higher price  circumscribes its market up to the distance
  serving a customer while restaurant 2 with lower price
  covers up to
  not serving the same customer in the middle. Two restaurants serve separate markets on their own depending on their transportation cost. With the advent of delivery application service, however, market boundaries for both restaurants expand to more distant regions, competing for customers along the whole lines in Figure 2. Delivery fees in the regions where restaurants are located are
  and
and  , uniform inside their own zones. Higher delivery fees will be charged to farther regions. For example,
  will be charged to customers in the region of restaurant 1 if they order food from restaurant 2, vice versa. In Figure 2, therefore, two restaurants compete for the customer in the middle who faces a higher aggregate price from its local restaurant 1 than the one from distant restaurant 2. Therefore, it may be possible for both restaurants to adjust prices to serve customers and win the competition.

Delivery platform industry in South Korea
Delivery platforms in South Korea have experienced substantial growth over the past 10 years. The proportion of food deliveries requested through delivery applications compared to direct phone calls to restaurants has been increasing from 22% in 2019 to 45% in 2021 (Korea Rural Economic Institute, 2019, 2021). According to Statistics Korea (2022), the industry has increased from KRW2.4 trillion (US$1.9 billion) in 2017 to KRW17.3 trillion (US$14.1 billion) in 2020. There are around 10 delivery applications in the South Korea delivery industry: Baemin, Yogiyo, Coupang Eats, WMPO, Baedaltong, KakaoTalk Delivery, Naver Delivery, etc. Of the applications, the top three, Baemin (59.7%), Yogiyo (23.8%), and Coupang Eats (15.2%), account for 98.7% of the total delivery market (MobileIndex, 2022a), rendering the market oligopolistic with the three leading delivery applications.
At the end of 2019, Delivery Hero, a German multinational online food delivery service company that used to own Yogiyo and Baedaltong, proposed to purchase Baemin, the biggest delivery firm. In response to the proposal, the Korea Fair Trade Commission (KFTC) investigated the possibility of afoul of antitrust law resulting in the delivery markets concentrated after the mergers and acquisitions. In December 2020, KFTC approved the MandA proposal conditioning on divestiture of Yogiyo (KFTC, 2020) because the MandA would have allowed Delivery Hero to take almost 97% of Korean total delivery market share without the condition. Despite the effort of KFTC to keep the market competitive, there are still complaints about high delivery fees from customers and high commissions from restaurants. On average, the delivery fee is KRW3,394 (US$2.71 with currency rate as of March 7, 2022) (Ministry of SMEs and Startups, 2021) and commission charged on restaurants is 12 - 15% of the total food price (Korea JoongAng Daily, 2021b).
Anecdotally speaking, restaurants may have two countervailing effects with delivery applications: 1) burden of commission; and 2) market expansion. Consequences of the expansion of delivery applications on consumers and restaurants themselves have not been examined so far due mostly to unavailability of restaurant level data. In order to fill this gap, this study exploits web scraping and network analysis to examine impacts of delivery applications as a first attempt.
METHODOLOGY
The objective of the study is to investigate the spatial market structure patterns of restaurant businesses and related food delivery by network analysis based on data collected with web scraping. In investigating degrees of competition in the spatial markets, major factors that differentiate products and service should be related to geographical attributes such as distance, travel times and/or transportation cost. Attributes other than geographical features should be similar or close to homogeneous across products. This study examines the spatial price structure of the Jajangmyeon business.
Jajangmyeon market in South Korea
In this study, an item called Jajangmyeon[3] has been chosen as the product of study; it is a noodle dish topped with black bean sauce, diced pork, and vegetables and it was selected because it is relatively homogeneous in ingredients, taste, quality, and portion sizes across restaurants. However, prices vary across restaurants based not only on ingredients and restaurant operating costs, but also on regional characteristics such as income levels, zoning classification (residential, commercial, and industrial zones), and rents in different subdivisions/districts. In addition, delivery fees charged to consumers increase as the distance between restaurant and subdivision where consumers place an order from increases.
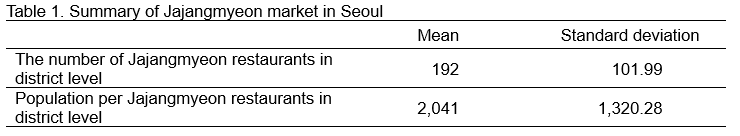
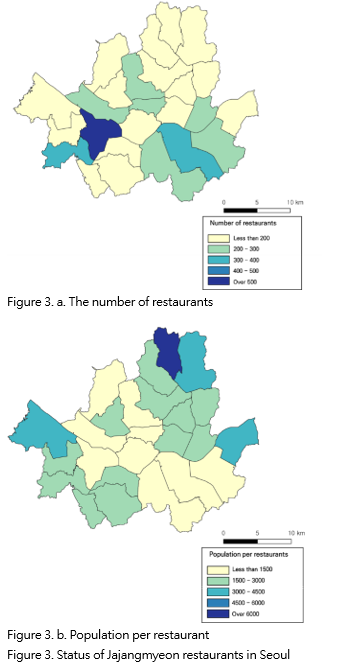
There were 4,805 restaurants (which is about 5.5% of total restaurants) selling Jajangmyeon in Seoul in 2019 (Statistics Korea, 2021a) servicing a total population of 9.6 million in the same year (Statistics Korea, 2021b). Figure 3 illustrates the number of Jajangmyeon restaurants and potential market size in the number of populations per restaurant across individual districts (Statistics Korea, 2021a). Table 1 summarized the status of the Jajangmyeon market in Seoul.
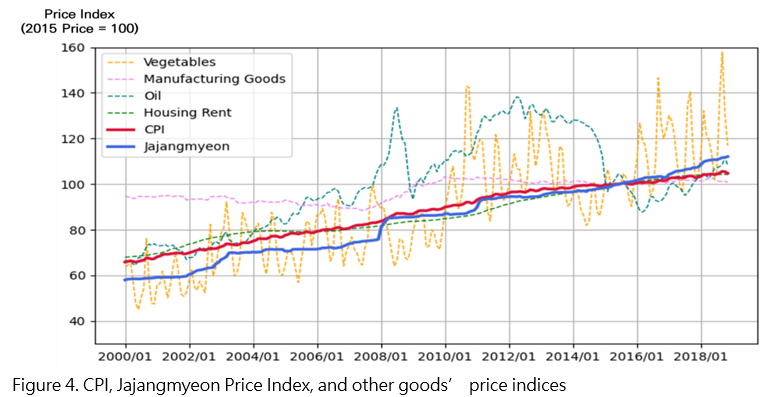
Most people in Korea enjoy Jajangmyeon and it is known for “We deliver even to a boat in the middle of the ocean”, which means it is delivered universally not only to closed indoor places like billiards, but also to wide open outdoor places such as parks, riversides, and the top of the mountains. Providing that 4,595 out of 4,805 restaurants serving Jajangmyeon are owned by individuals (Statistics Korea, 2021a), each of them practices their own pricing strategies. In addition, Statistics Korea has Jajangmyeon Price Index as another method for estimating Consumer Price Index (CPI) over time (Statistics Korea, 2022a). As Figure 4 shows, the Jajangmyeon Price Index moves along with CPI just as Housing Rent does. Therefore, it is suggested that Jajangmyeon can be a relevant food item for this research because its price reflects the economic situation.
Data Collection and Analysis
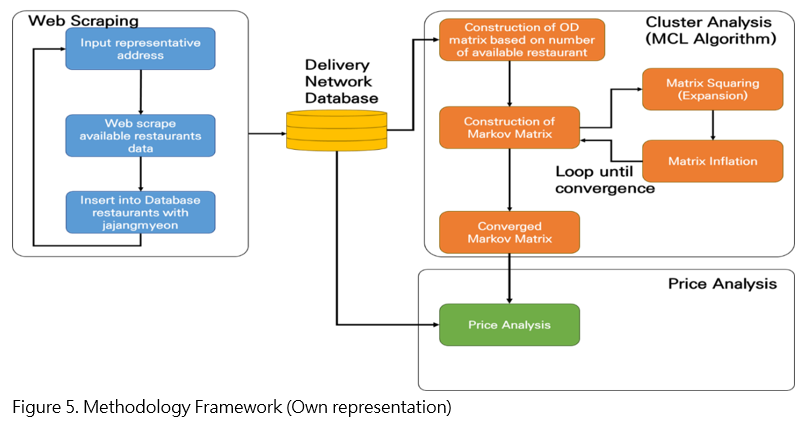
Overall analysis of this study is comprised of three steps: 1) data collection: extraction of Jajangmyeon restaurants data from a delivery application exploiting web-scraping; 2) network cluster analysis: identification of clusters and attractor nodes of Jajangmyeon restaurants through Markov Cluster Algorithm (MCL); and 3) price analysis: analysis of spatial price patterns. The following Figure 5 shows the framework of the study.
Web scraping of delivery app
Web scraping allows authors to collect and process a large amount of data from online spaces using an automated process, as opposed to previously when a manual effort was needed. Web scraping is, therefore, a more efficient way to collect online data than the traditional copy and paste method (Nylen and Wallisch, 2017).
This study scraped Jajangmyeon restaurant data from the Yogiyo delivery application. We chose Yogiyo for two reasons: 1) technical availability of web browser-based interface; and 2) popularity. Unlike other delivery applications in Korea, Yogiyo provides a web browser-based interface which enables web-scraping to collect data from the platform. Baemin which is the top delivery application in Korea does not utilize a web browser-based interface, preventing researchers from web scraping data on the platform. Second, Yogiyo is the second-largest delivery application in Korea and accounts for approximately 22% of the total delivery application market (Nielson Korea Click, 2020). However, this analysis is not about how oligopolistic delivery applications exercise their market shares on restaurants by charging higher commission fees. Rather, this is about pricing strategies of restaurants registered in delivery applications. That being said, examining restaurants’ pricing strategies in one of the leading delivery applications may provide economic insights representing strategic behaviors in restaurant businesses as well as online delivery markets in Korea.
The Octoparse platform (https://service.octoparse.com/ecommercedata), which offers customizable scraping engines and platforms, was used for web-scraping in this analysis.[4] Three stages of data collection using Octoparse were conducted in this study: 1) searching available Jajangmyeon restaurants based on addresses at subdivision level; 2) extracting the data of such information as menus of searched Jajangmyeon restaurants; and 3) inserting restaurant data into the database if the restaurant has Jajangmyeon on their menu.
Network cluster analysis
Network cluster analysis decomposes a network into a sub-network based on connections between nodes. The traditional sub-division-based spatial market boundaries might have been expanded by delivery application introduction. This potential expansion of the market boundaries might have then altered spatial market structure. Thus, this study identifies sub-networks of delivery on a delivery application to specify altered market boundaries, and to analyze the spatial market structure.
This study uses MCL algorithm for network cluster analysis. MCL is an unsupervised cluster analysis algorithm for networks, which is based on the simulation of random walks in a network (Van Dongen, 2000). MCL has been applied in various types of big-data-based network identification research because of its speed and simplicity. For example, MCL was used to identify flight sub-networks from global flight networks (Xu et al., 2017) and researcher networks (Chandrasekharan et al., 2021).
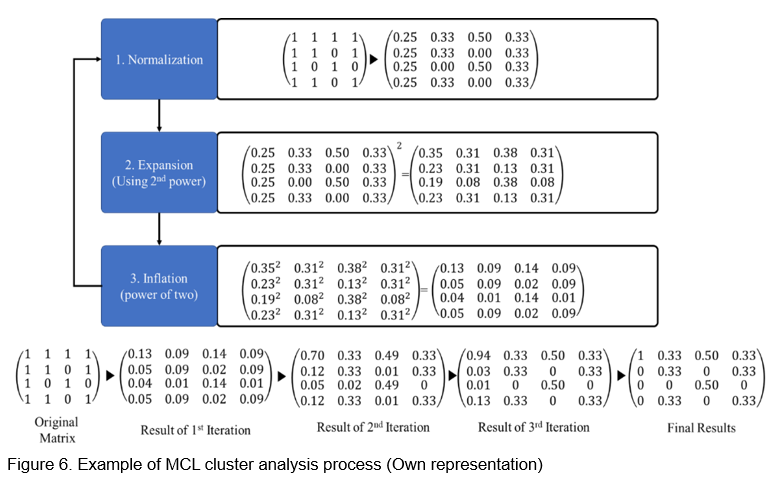
The MCL algorithm starts with the construction of the Origin-Destination matrix. It then alternates the Origin-Destination matrix by iterating three steps: scaling, expansion, and inflation (Van Dongen, 2000). Scaling is the process that constructs the Markov matrix, which shows the probability of transition, by matrix normalization process. The expansion step takes the power of the Markov matrix using the matrix product. This step spreads connections to new vertices and also enhances connections to reachable vertices. In other words, the expansion step enhances within-cluster connection by increasing paths between the two nodes in the same cluster. Then, inflation is conducted by raising each matrix entry to power of over one. The inflation step will inflate entries over one, while deflating entries less than one. Therefore, the effect of the inflation step is to make strong connections stronger and weak connections weaker.
These steps are repeated until the matrix becomes an idempotent Markov matrix, which will not have any further change through expansion and inflation. The rows with one or more positive elements are interpreted as clusters. Each cluster has a star-like form, with one attractor in the center and has connections from all participant nodes. Thus, attractor nodes can be interpreted as the local center of networks. Figure 6 shows an example results of the MCL algorithm.
 Price analysis
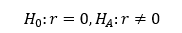
It is hypothesized that the delivery application has changed the spatial pricing structure by expanding Jajangmyeon restaurants’ reach to neighboring subdivisions. Correlations were explored to discern relationships among the price of Jajangmyeon and additional Jajangmyeon restaurants by delivery apps to explore the prospect of significant relationships between average local price and differences in price between the average local price and the average delivery application prices,  . Authors define the average local price as average aggregate price totaled food item price and delivery fees of restaurants in the subdivisions where the restaurants are located. The average delivery application price is defined to be the average aggregate price available from the delivery application accounting for the restaurants both in subdivisions where the restaurants are located and in neighboring subdivisions. If the difference is positive (negative), the average delivery application price is higher (lower) than the average local price. The test is based on the following hypothesis:

The P-value is calculated based on the t-value, which is calculated by the following formula:
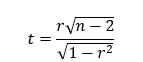
where n is the number of connected sub-divisions.
RESULTS AND DISCUSSION
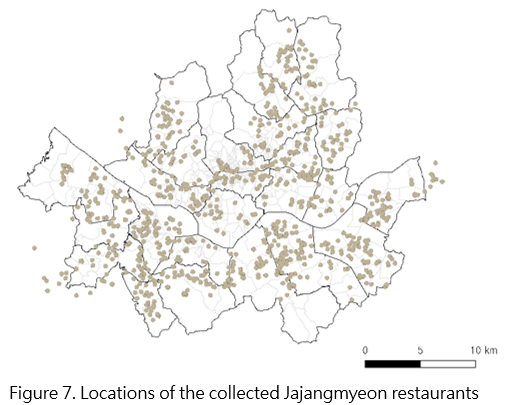
This study collected 1,088 Jajangmyeon restaurants' information on the Yogiyo delivery application from July 2021 to August 2021, accounting for approximately 39% of the total Jajangmyeon restaurants in Seoul. Figure 7 shows the location of collected Jajangmyeon restaurants.

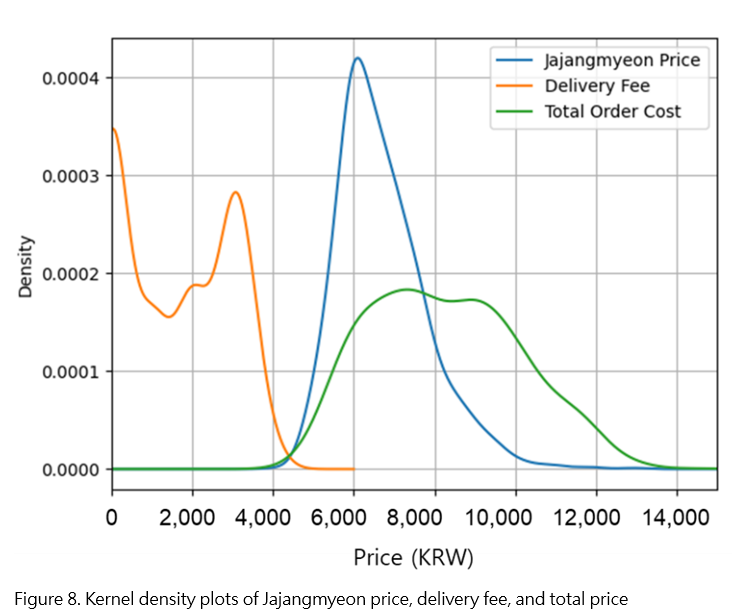
The collected data shows that there are 2.27 Jajangmyeon restaurants on average per subdivision, the average Jajangmyeon price as KRW6,715 (US$5.45 with currency rate as of March 7, 2022), and the average delivery fee as KRW1,552 (US$1.24 with currency rate as of March 7, 2022)[5]. Thus, the average aggregate Jajangmyeon price is KRW8,267 (US$6.71), of which delivery fee accounts for non-trivial 18%. Figure 8 shows the kernel density plot of Jajangmyeon price, delivery fee, and total order cost[6]. The kernel density shows the distribution of Jajangmyeon price and total order cost are right skewed, and delivery fee has two peaks at KRW0 and KRW3,000 (US$2.43 with currency rate as of March 7, 2022) reflecting the current reality that many restaurants still do not charge a delivery fee on the delivery application.
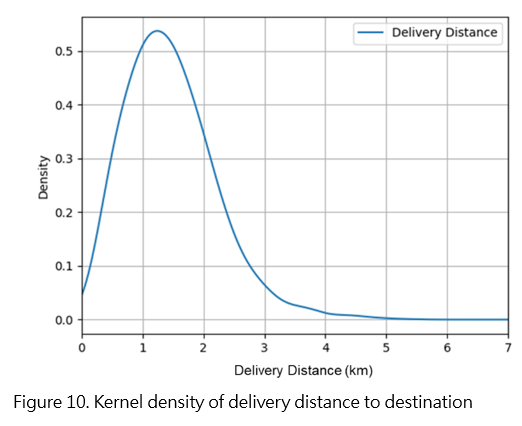
The delivery boundary shows that on average individual Jajangmyeon restaurants deliver to seven subdivisions with an average delivery distance is 1.46 km, which is close to the average radius one subdivision (which is 1.2 km). The delivery boundary is used to generate the Origin-Destination matrix by counting the number of restaurants that can deliver from one subdivision to the other subdivision. Figure 9 and figure 10 shows the Origin-Destination network and kernel density of delivery distance to delivery destination, respectively. Variations of network across districts reflect two market attributes: 1) the number of subdivisions in a single district; and 2) the number of restaurants.
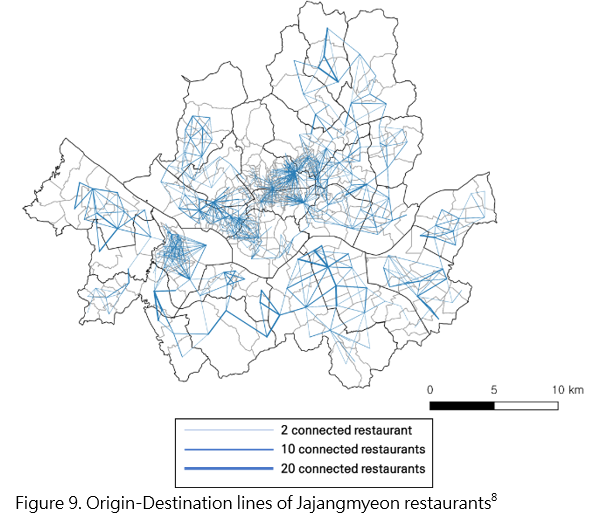

The network in Figure 9 indicates two differences in aspects of Origin-Destination lines. There are thin but many lines in the central and mid-west regions while thick but a smaller number of lines in other regions. Such dense districts as Jongno-gu, Jung-gu were older historical districts developed around 100 years ago with lots of small subdivisions with narrow and mediocre road conditions. On the other hand, other districts such as Gangnam-gu and Seocho-gu were developed relatively recently less than 30 years ago with wider and well-paved road conditions.
Historical urban areas around the central and mid-west districts have complex thin lines with restaurants connecting lots of subdivisions. For example, subdivisions of old historical urban areas have 61.31 connected subdivisions on average, but each connection has 1.15 restaurants on average. On the other hand, the younger modern urban areas encompassing southern districts have simpler thick lines with many restaurants connected across a few subdivisions. Average numbers of connected subdivisions in the young and modern urban areas have 6.41 and each connection have 3.53 restaurants. The results suggest that the market has been expanded more in the older historical urban areas, resulting in a rise in spatial competition after delivery applications came into play in Jajangmyeon food service.
Cluster Analysis
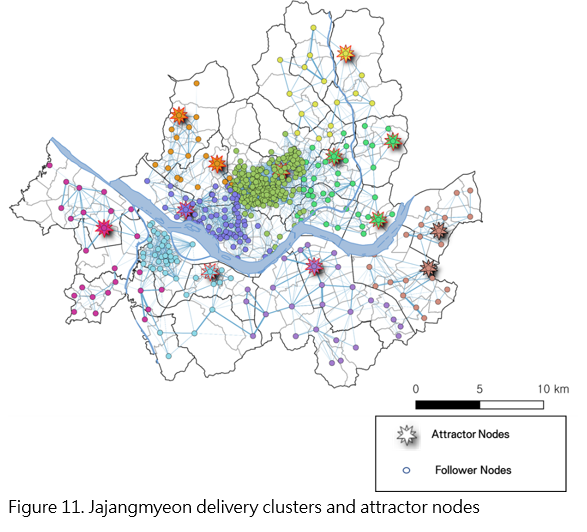
The cluster analysis identifies 9 clusters (9 different colors of dots) and 13 attractor nodes. Figure 11 shows identified clusters and their attractor nodes. Clusters illustrate nodes representing subdivisions connected for deliveries and the identified clusters are almost equivalent to the union of 2 to 4 administrative district units. Since administrative districts are usually separated by geographical barriers, like streams and railroads, delivery clusters are similar to the administrative districts and separated by the river, as expected. Attractor nodes show local centers in clusters and the 13 identified attractor nodes are denser population or denser restaurant areas than their neighbors.
Changes in the number of orderable restaurants
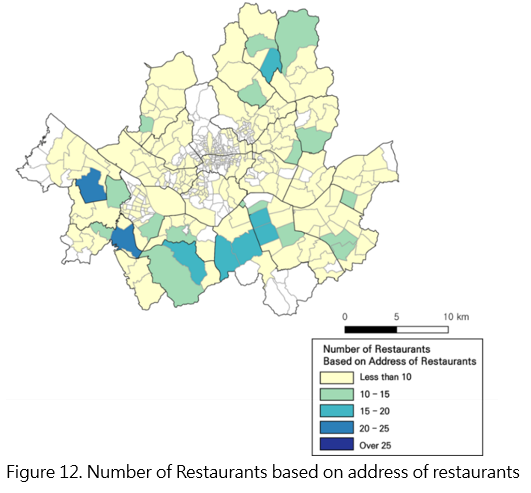
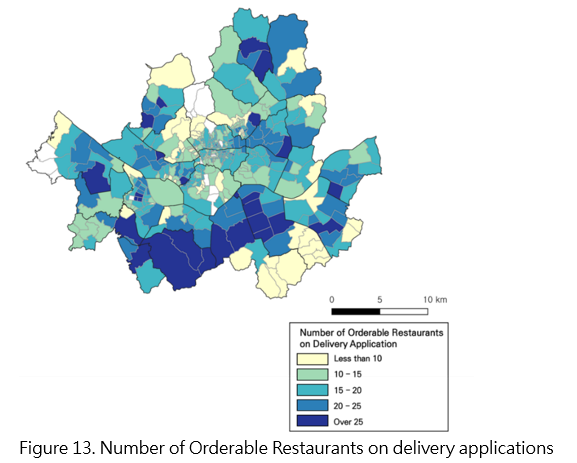
Traditionally, people ordered Jajangmyeon within their own sub-division. From the collected data, only 2.3 restaurants are available to order from in individual subdivisions if delivery applications are not considered (Figure 12). However, Figure 13 illustrates that the Jajangmyeon can be ordered from 13.5 additional Jajangmyeon restaurants from the neighboring subdivisions through the delivery application. Thus, the results show the expansion of consumer choices in the Jajangmyeon market, potentially leading to more competition among restaurants, although expanding competition to include both food and delivery prices/costs.
Changes in the price by delivery apps
The average local price, which is the average aggregate price for foods item and delivery fees of restaurants in the subdivisions where the restaurants are located, is illustrated in Figure 14. Figure 15, on the other hand, displays the average delivery application price, which is the average aggregate price available from the delivery application accounting for the restaurants both in subdivisions where the restaurants are located and in neighboring subdivisions.
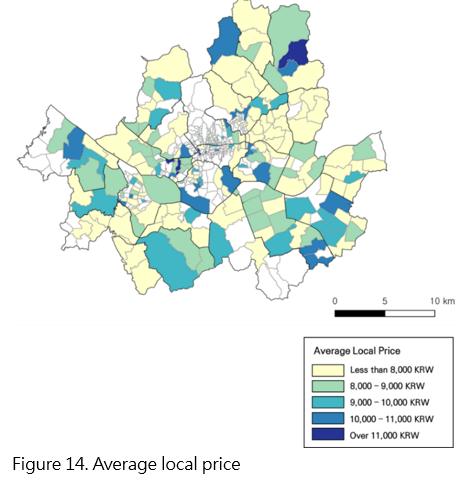

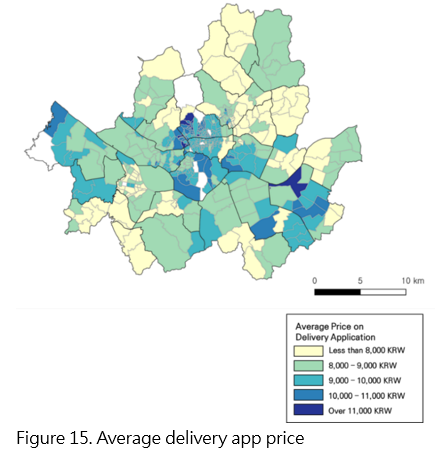
The results present a converging pattern of the Jajangmyeon prices with delivery applications. Restaurants with higher local prices reduce prices in farther and more competitive regions to absorb more customers while restaurants with lower local prices have some rooms to raise prices (but still lower than other competing restaurants) to increase profits. Figure 16 illustrates the relationship between average local price and differences in price between the average local price and the average delivery application prices, . If the difference is positive (negative), the average delivery application price is higher (lower) than the average local price. Prices around the subdivisions with higher average local prices decreased with the introduction of delivery applications, while the ones in subdivisions with lower average local prices increased. A negative relationship between price difference and average delivery application price was found. Based on the correlation analysis, the Pearson correlation coefficient is -0.82 and the p-value is 0.000, indicating the negative correlation is statistically significant. Thus, the results suggest a convergence in price, the negative relationship between local prices and delivery application prices, and more competition in the restaurant business.
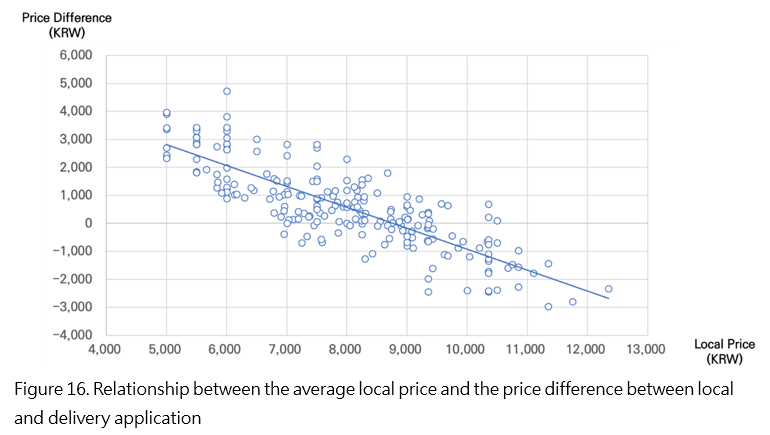
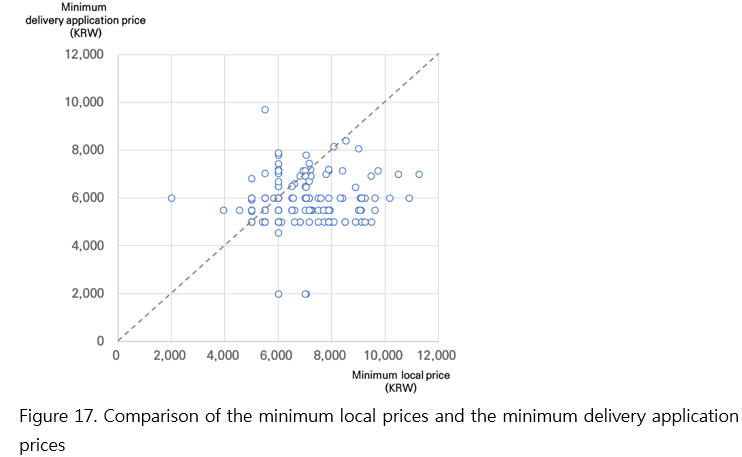
Figure 17 illustrates the relationship between the minimum local price and the minimum delivery application price. The minimum delivery prices of 129 out of 213 subdivision areas are less than the minimum local prices. Therefore, the results empirically show the possibility of an increase in spatial competition.
CONCLUSION
The introduction of delivery applications has brought changes to the food service industry. Delivery applications charge customers delivery-related costs, and thus, change spatial market structure. As more people now use delivery applications, the importance of delivery application-induced market structure changes becomes more significant.
This paper analyzes delivery application-induced market structure changes using web-scraping and network analysis. Compared with traditional data collection methods, web-scraping can provide more detailed price and delivery boundary information at the individual restaurant level. Web-scraping data facilitated addressing subdivision level spatial market structure changes by cluster and price analysis, but additional analyses are possible in other contexts.
Cluster and price analysis of this study suggests that the number of orderable restaurants has increased by spatial market expansion with the advent of delivery applications. In addition, there was a negative correlation between the average local price and the average price difference between local price and delivery application price, suggesting a converging pattern of Jajangmyeon prices. After the delivery application came into the marketplace, the price increased in low local price areas, while high local price areas experienced the opposite. This may suggest that additional competition might have led the Jajangmyeon price to converge with delivery applications. In addition, the negative correlation was more apparent in more competitive historical urban areas than in less competitive modern urban areas. Given the rapid changes experienced in many urban areas due to pandemic-related disruptions, less frequenting of commercial districts, and more consumption taking place at home, the prospect of changes in spatial competition of restaurants traditionally servicing smaller regions within a city is of particular interest.
Limitations and future research
The results of this study suggest that delivery applications may render food service markets more competitive with price convergence. However, this analysis does not provide insight about individual restaurant’s performance in terms of changes in revenue and profit, nor changes in consumers’ welfare. Web scraping can scrape only visible or accessible information on websites (for example prices, but not quantity sold) which limits the range of research that could be conducted.
Despite the limitation of the techniques one of the major benefits of web-scraping is large-scale data collection which can be used to lessen information asymmetry and make markets more competitive and economically efficient. Datasets do not usually stand alone, but are often used in analysis with other data sources for context and to enrich the depth of the analysis. The main purpose of the current study is to demonstrate the potential of using new methods of online data collection and network analysis for conducting market research. Using these methods, the availability of such information as the number of restaurants in different locations, menu prices, delivery fees, distance between combinations of origins (restaurants)-destinations (customers) facilitates analysis on pricing strategies, promotions strategies, or price differentiation on market structure.
REFERENCES
Alalwan, A.A., 2020. Mobile food ordering apps: An empirical study of the factors affecting customer e-satisfaction and continued intention to reuse. International Journal of Information Management 50: 28–44. https://doi.org/10.1016/j.ijinfomgt.2019.04.008
Baedal Minjok, 2022. Setting Delivery Fee [WWW Document]. Baedal Minjok Manual for Restaurant Owners. URL https://ceo.baemin.com/guide/G81011 (accessed 7.2.22).
Cavallo, A., 2020. Inflation with Covid Consumption Baskets. Working Paper Series. https://doi.org/10.3386/w27352
Cavallo, A. and R. Rigobon. 2016. The Billion Prices Project: Using Online Prices for Measurement and Research. Journal of Economic Perspectives 30: 151–178. https://doi.org/10.1257/jep.30.2.151
CDC, 2022. Food Delivery Safety [WWW Document]. Centers for Disease Control and Prevention. URL https://www.cdc.gov/foodsafety/communication/food-safety-meal-kits.html (accessed 5.4.22).
Chandrasekharan, S., M. Zaka, S. Gallo, W. Zhao, D. Korobskiy, T. Warnow and G. Chacko. 2021. Finding scientific communities in citation graphs: Articles and authors. Quantitative Science Studies 2: 184–203. https://doi.org/10.1162/qss_a_00095
Cheng, C.-C., Y.-Y. Chang and C.-T. Chen. 2021. Construction of a service quality scale for the online food delivery industry. International Journal of Hospitality Management 95: 102938. https://doi.org/10.1016/j.ijhm.2021.102938
Cho, M., M.A. Bonn, J Li. 2019. Differences in perceptions about food delivery apps between single-person and multi-person households. International Journal of Hospitality Management 77: 108–116. https://doi.org/10.1016/j.ijhm.2018.06.019
Correa, J.C., W. Garzón, P. Brooker, G. Sakarkar, S.A. Carranza, L. Yunado and A. Rincón. 2019. Evaluation of collaborative consumption of food delivery services through web mining techniques. Journal of Retailing and Consumer Services 46: 45–50. https://doi.org/10.1016/j.jretconser.2018.05.002
Etumnu, C.E., K. Foster, N.O. Widmar, J.L. Lusk, D.L. Ortega. 2020. Does the distribution of ratings affect online grocery sales? Evidence from Amazon. Agribusiness 36: 501–521. https://doi.org/10.1002/agr.21653
Frankel, A. 2022. Anti-hacking law does not bar data scraping from public websites - 9th Circuit [WWW Document]. URL https://www.reuters.com/legal/litigation/anti-hacking-law-does-not-bar-data-scraping-public-websites-9th-circuit-2022-04-19/ (accessed 5.4.22).
Global Competition Review. 2022. Asia-Pacific Antitrust Review 2022 - China:Overview [WWW Document]. URL https://globalcompetitionreview.com/review/the-asia-pacific-antitrust-review/2022/article/china-overview (accessed 9.11.22).
Gunden, N., C. Morosan and A. DeFranco. 2020. Consumers’ intentions to use online food delivery systems in the USA. International Journal of Contemporary Hospitality Management 32: 1325–1345. https://doi.org/10.1108/IJCHM-06-2019-0595
Hwang, J., S.-B. Cho and W. Kim. 2019. Consequences of psychological benefits of using eco-friendly services in the context of drone food delivery services. Journal of Travel and Tourism Marketing 36: 835–846. https://doi.org/10.1080/10548408.2019.1586619
Hwang, J. and J.J. Kim. 2021b. Expected benefits with using drone food delivery services: its impacts on attitude and behavioral intentions. Journal of Hospitality and Tourism Technology 12: 593–606. https://doi.org/10.1108/JHTT-05-2020-0123
Hwang, J., W. Kim and J.J. Kim. 2020b. Application of the value-belief-norm model to environmentally friendly drone food delivery services: The moderating role of product involvement. International Journal of Contemporary Hospitality Management 32: 1775–1794. https://doi.org/10.1108/IJCHM-08-2019-0710
IMARC. 2021a. Online Food Delivery Market Research, Size, Share 2022-2027 [WWW Document]. URL https://www.imarcgroup.com/online-food-delivery-market (accessed 3.12.22).
IMARC. 2021b. Global Online Food Delivery Market to Grow at 11.44% During 2022-2027, Supported by Rising Demand for RTE Products [WWW Document]. URL https://www.imarcgroup.com/global-online-food-delivery-market (accessed 3.12.22).
Jiang, Y., P.-L. Lai, C.-C. Yang and X. Wang. 2023. Exploring the factors that drive consumers to use contactless delivery services in the context of the continued COVID-19 pandemic. Journal of Retailing and Consumer Services 103276. https://doi.org/10.1016/j.jretconser.2023.103276
Jung, J. 2021. A case study of analyzing agricultural and food retails in Korea with web scraping [WWW Document]. URL https://www.krei.re.kr/krei/researchReportView.do?key=67andpageType=010101andbiblioId=528517andpageUnit=10andsearchCnd=allandsearchKrwd=andpageIndex=7andengView= (accessed 5.4.22).
KFTC, 2020. Yogiyo Baemin Conditional Merger Approval [WWW Document]. URL https://www.ftc.go.kr/www/selectReportUserView.do?key=10andrpttype=1andreport_data_no=8891 (accessed 5.4.22).
Kim, M. 2009. Inculturation of jajangmyeon in Korea. Korean Folklore 50, 159–207.
Korea JoongAng Daily. 2021. Delivery Hero and the game of monopoly.
Korea Rural Economic Institute. 2021. The consumer behavior survey for food 2021. Korea Rural Economic Institute.
Korea Rural Economic Institute. 2019. The consumer behavior survey for food 2019. Korea Rural Economic Institute.
Korean Bapsang. 2020. Jajangmyeon (Noodles in Black Bean Sauce). Korean Bapsang. URL https://www.koreanbapsang.com/jajangmyeon-noodles-in-black-bean-sauce/ (accessed 3.11.22).
Kumar, S. and A. Shah. 2021. Revisiting food delivery apps during COVID-19 pandemic? Investigating the role of emotions. Journal of Retailing and Consumer Services 62: 102595. https://doi.org/10.1016/j.jretconser.2021.102595
Macias, P., D. Stelmasiak and K. Szafranek. 2022. Nowcasting food inflation with a massive amount of online prices. International Journal of Forecasting 39(2): 809-826, https://doi.org/10.1016/j.ijforecast.2022.02.007
Meena, P. and G. Kumar. 2022. Online food delivery companies’ performance and consumers expectations during Covid-19: An investigation using machine learning approach. Journal of Retailing and Consumer Services 68: 103052. https://doi.org/10.1016/j.jretconser.2022.103052
Ministry of SMEs and Startups. 2021. 2021 Online Platform Users Survey [WWW Document]. URL https://www.mss.go.kr/site/smba/ex/bbs/View.do?cbIdx=86andbcIdx=1030621andparentSeq=1030621 (accessed 5.4.22).
MobileIndex. 2022a. Restaurant Business Report [WWW Document]. URL https://hd.mobileindex.com/report/?s=180 (accessed 7.12.22).
MobileIndex. 2022b. Mobile Application Usage Report [WWW Document]. URL (accessed 7.13.22).
Nielson Korea Click. 2020. Contactless life, inducing expansion delivery markets [WWW Document]. URL http://www.koreanclick.com/english/insights/newsletter_view.html?code=topicandid=591andpage=1 (accessed 3.12.22).
Novita, D. and N. Husna. 2020. The Influence Factors of Consumer Behavioral Intention Towards Online Food Delivery Services. International Journal of Business 3: 40–42. https://doi.org/10.33365/tb.v3i2.840
Nylen, E. L and P. Wallisch. 2017. Neural Data Science: A Primer with MATLAB and Python, 1st edition. ed. Academic Press, London, United Kingdom.
Okumus, B., F. Ali, A. Bilgihan and A.B. Ozturk. 2018. Psychological factors influencing customers’ acceptance of smartphone diet apps when ordering food at restaurants. International Journal of Hospitality Management 72: 67–77. https://doi.org/10.1016/j.ijhm.2018.01.001
Ray, A., A. Dhir, P.K. Bala and P. Kaur. 2019. Why do people use food delivery apps (FDA)? A uses and gratification theory perspective. Journal of Retailing and Consumer Services 51: 221–230. https://doi.org/10.1016/j.jretconser.2019.05.025
Seoul Open Data. 2021. Sub-division Level Statistics of Seoul [WWW Document]. URL https://data.seoul.go.kr (accessed 4.20.22).
Shah, A.M., A.Z. Abbasi and X. Yan. 2023. Do online peer reviews stimulate diners’ continued log-in behavior: Investigating the role of emotions in the O2O meal delivery apps context. Journal of Retailing and Consumer Services 72: 103234. https://doi.org/10.1016/j.jretconser.2022.103234
Statistics Korea. 2022a. Consumer price index [WWW Document]. URL https://kosis.kr/statHtml/statHtml.do?orgId=101andtblId=DT_1J15112andconn_path=I3 (accessed 3.11.22).
Statistics Korea. 2022b. Monthly Online Shopping Survey [WWW Document]. URL https://kostat.go.kr/portal/eng/surveyOutline/2/5/index.static (accessed 3.11.22).
Statistics Korea. 2021a. Business Demography Statistics in Korea [WWW Document]. URL https://kosis.kr/statHtml/statHtml.do?orgId=101andtblId=DT_1IN1502andconn_path=I2andlanguage=en (accessed 3.12.22).
Statistics Korea. 2021b. Population, Households and Housing Units [WWW Document]. URL https://kosis.kr/statHtml/statHtml.do?orgId=101andtblId=DT_1IN1502andconn_path=I2andlanguage=en (accessed 3.12.22).
Tandon, A., P. Kaur, Y. Bhatt, M. Mäntymäki and A. Dhir. 2021. Why do people purchase from food delivery apps? A consumer value perspective. Journal of Retailing and Consumer Services 63: 102667. https://doi.org/10.1016/j.jretconser.2021.102667
Van Dongen, S.M. 2000. Graph clustering by flow simulation (PhD Thesis). University Utrecht.
Wang, O. and F. Scrimgeour. 2021. Consumer adoption of online-to-offline food delivery services in China and New Zealand. British Food Journal 124: 1590–1608. https://doi.org/10.1108/BFJ-03-2021-0208
Whittaker, Z. 2022. Web scraping is legal, US appeals court reaffirms. TechCrunch. URL https://social.techcrunch.com/2022/04/18/web-scraping-legal-court/ (accessed 5.4.22).
Williams, G., M. Tushev, F. Ebrahimi and A. Mahmoud. 2020. Modeling user concerns in Sharing Economy: the case of food delivery apps. Automated Software Engineering 27: 229–263. https://doi.org/10.1007/s10515-020-00274-7
Xu, K., T. Long, S. Qiao, Y. Zheng and N. Han. 2017. A Global Flight Networks Analysis Approach Using Markov Clustering and PageRank. 2017 IEEE International Conference on Big Knowledge (ICBK). https://doi.org/10.1109/ICBK.2017.42
Zhao, Y. and F. Bacao. 2020. What factors determining customer continuingly using food delivery apps during 2019 novel coronavirus pandemic period? International Journal of Hospitality Management 91: 102683. https://doi.org/10.1016/j.ijhm.2020.102683
[1] Web-scrapping has been extensively used for other research topics such as retail prices (Cavallo, 2020), inflation (Cavallo and Rigobon, 2016), food price now/forecasting (Macias et al., 2022), etc., but not for geographical market structure in restaurant businesses from delivery applications.
[2] There is a minimum total amount due at checkout to use delivery service in Korea and it varies from restaurant to restaurant. That being said, in this study, only orders qualified for delivery service by meeting the minimum total amount due are considered, as explained in the Methods section.
[3] Introduction of Jajangmyeon and recipes are available at Korean Bapsang (2020).
[4] The raw data scraped is available upon request. In addition to the Octoparse platform, the data is currently being scraped with the Python selenium code that authors created.
[5] The delivery fee was initially averaged at the restaurant level, then the total average delivery fee was calculated.
[6] The total order cost is defined as the sum of the Jajangmyeon price and delivery fee.
[7] One restaurant connection is omitted for simplicity.


Spatial Differentiation in Food Service Pricing: An Explorative Study with Web-Scrapped Data
ABSTRACT
Food delivery applications have grown rapidly in recent years, fueled by increasing consumer demand for convenience and prepared foods. Previous studies on what factors encourage consumers to use delivery platforms rely largely on survey data, likely due to the lack of availability of restaurant or industry level data. Utilizing web scraping techniques to collect restaurant level data from one of the biggest delivery applications in South Korea, Yogiyo, this study conducts an analysis on spatial market structure of the restaurant business. Through restaurant level data, market expansion, changes in the number of restaurants to order from, and changes in prices across regions with delivery application are considered. Analysis suggests that the average number of orderable restaurants increased from a nearby 2.3 restaurants to distant 13.5 restaurants with customers willingly paying for delivery fees according to distance via the delivery application. As the restaurant delivery market becomes more competitive, it is found that aggregate prices totaled with food prices and delivery fees from two restaurants in different locations converge to serve the customer between the two restaurants, which may benefit customers with more competitive pricing. This exploratory study uniquely demonstrates how web-scrapped data and network analysis can be used for gaining insights on geographical market structure of food markets by presenting variations in such information as food prices and/or the number of restaurants across the subdivided regions in Seoul, South Korea.
Keywords: food delivery; food economics; restaurant business; spatial competition; web scraping; network analysis
INTRODUCTION
The global food delivery market size reached US$106.1 billion in 2021 (IMARC, 2021a) and it is expected to grow at a CAGR (Compounded Annual Growth Rate) of 11.44% over the period 2022 through 2027, reaching US$223.7 billion (IMARC, 2021b). The food service industry has undergone substantial changes recently with the rapid growth in innovative food delivery applications on smartphones and desktops. An increasing number of consumers and restaurant owners have adopted delivery applications/platforms for convenience and profit improvement, respectively.
Almost half the population of South Korea is using delivery applications to order food from restaurants delivered to dinner tables (MobileIndex, 2022a). South Korea has a food delivery marketplace which is valued at almost 10 times what it was just four years ago (Statistics Korea, 2022a). According to the Statistics Korea (2022a), the size of the food service delivery market, where the top three delivery platforms account for more than 90%, is estimated to be US$21.4 billion in 2021. Recently social distancing due to the COVID-19 pandemic limits mobility of people to dine out, inducing rapid delivery platform growth over the past two years under the pandemic (Statistics Korea, 2022b).
The rapid growth of delivery applications has brought many changes in the restaurant industry. For example, consumers have more options for ordering diverse foods as restaurants may expand their geographical service areas to more distant customers. As markets develop monopolistic delivery platforms could potentially seek to charge higher delivery fees to consumers and/or higher commissions to restaurants which could lead to higher menu prices if such costs are passed along (Global Competition Review, 2022; Korea JoongAng Daily, 2021a). In addition, more competition among restaurants which possibly benefits consumers may place pressure on small restaurants’ thin profit margins. Extended delivery to distant destinations leads to longer travel time of food, bringing a food safety issue into the topic of food delivery (CDC, 2022).
To the authors' best knowledge, there has not been much economic research on changes in the market structure of the restaurant markets/food delivery service industries induced by the appearance of delivery applications. Because online food delivery is an emerging phenomenon, most of the existing studies analyzed consumer behavior or attitude based on psychological, marketing, and communication standpoints, but not market structure based on economic knowledge. Previous studies have examined consumers’ intention of adopting online food delivery services (Gunden et al., 2020; Hwang et al., 2019; Hwang and Kim, 2021; Okumus et al., 2018; Ray et al., 2019; Wang and Scrimgeour, 2021). Another group of existing studies are about consumers’ motivation to use delivery applications (Jiang et al., 2023; Novita and Husna, 2020; Ray et al., 2019; Tandon et al., 2021) and to return to the applications (Alalwan, 2020). A few published studies have estimated consumers’ willingness to pay (WTP) for the delivery application service (Hwang et al., 2020), examined rate of satisfaction (Alalwan, 2020; Cho et al., 2019; Kumar and Shah, 2021; Meena and Kumar, 2022; Shah et al., 2023; Zhao and Bacao, 2020). However, existing literature largely lacks a market structure approach, indicating the findings of this study may contribute to providing a new insight for the online food delivery industry.
One reason for the lack of empirical research on restaurant businesses with delivery platforms may be the unavailability of restaurant level data. In the existing studies, data have been collected mainly through surveys of consumers/customers. Three papers constitute exceptions (Cheng et al., 2021; Correa et al., 2019; Williams et al., 2020) and they used web-scraping or mining for data collection for restaurant businesses. Correa et al. (2019) in their analysis of the relationship between actual delivery time and restaurants’ performance use web-scraping and other online data sources such as Facebook and Google Maps API. Correa et al. (2019) scraped key performance indicators such as consumer review comments of fast-food providers from a Colombian online food delivery platform. They also generated information on traffic conditions by utilizing the location of the restaurants obtained from Facebook and travel time from Google Maps API. Traffic conditions were found to have exerted no practical effects on transaction volume and delivery time fulfillment, even though early deliveries showed a mild association with the number of comments provided by customers after receiving their orders at home (Correa et al., 2019). In addition, Cheng et al. (2021) and Williams et al. (2020) studied consumer attitudes toward restaurants or online food delivery by scraping comments from App store reviews, online communities, blogs or media.
Recently, there appeared a new data collection technique in online space namely web-scraping, to collect data from online retailers or social media platforms (Jung, 2021; Cavallo, 2020; Cavallo and Rigobon, 2016). Recent analyses on food products have used web-scraping to facilitate data collection on product data, including reviews (Etumnu et al., 2020). This study utilizes web-scraping for collecting such data in restaurant businesses as information of item names, prices, delivery fees, possible delivery regions, and exact restaurant locations with addresses that are available from online delivery applications in South Korea. Compared to consumers survey data for expenditures on food service or food away from home, web-scraping has several benefits. First, web-scraping collects information from all the restaurants registered in the delivery application with detailed attributes of restaurants and dishes, such as exact locations of restaurants with address, menu prices, all deliverable destinations and differentiated delivery fees, etc. On the other hand, consumer surveys provide such information only on purchased dishes from chosen restaurants, which limits generalization of analyses and insights. Second, web-scraping allows precise data collection from literal descriptions from the application while consumers surveys rely on respondents’ recollecting activities and/or experiences. That being said, web-scraped data provides high quality datasets with reduced possibility of missing or mis-specified information.
To the best of authors’ knowledge, this study is the first to research market structure in the restaurant markets with food delivery services using data amassed from delivery applications[1], thus exploiting web-scraping and network analysis applied to examine relations across regions. Conducting network analysis with scraped data including geographical information of restaurants allows the authors to investigate spatial market structure of restaurant businesses, allowing insights into how restaurants facing different market condition adjust their pricing strategies. The primary objectives of this study are: 1) sharing new methods of data collection (web-scraping) and analyzing technique (network analysis) for investigating the restaurant business; and 2) providing empirical research about online delivery platform and market structure of the restaurant business utilizing the big data scraped.
CONCEPTUAL BACKGROUND
Changes in Delivery Industry with the Appearance of Delivery Applications
Seoul, the capital city of South Korea and home to 20% of the total country’s population, is composed of 25 administrative districts called “Gu”, with 467 legal-status subdivisions called “Dong” (Figure 1). The average area of 25 districts is 24 square kilometers ranging from 10 to 47 square kilometers (Seoul Open Data, 2021). Boldly estimating, 5 kilometers (3 – 7 kilometers) may be a maximum distance of delivery inside districts from edge to edge which takes up to 15-20 minute-delivery time. Furthermore, the average area of 467 subdivisions is 1.43 square kilometers ranging from 0.23 to 12.68 square kilometers (Seoul Open Data, 2021). The maximum distance from edge to edge is 1.2 kilometers (0.5 - 3.6 kilometers), taking up to 3-5 minutes-delivery time.
Considering most restaurants on delivery applications provide information about delivery regions based on the level of subdivision, it is assumed by authors that delivery markets are generally defined as a single subdivision, sometimes including neighboring subdivisions depending on precise restaurant locations. In South Korea, delivery costs used to be absorbed by restaurant owners and customers did not pay ‘delivery fees’ before delivery applications came into play in the restaurant industry in early 2010 (Kim, 2009). Restaurant owners hired part-time delivery drivers or riders, most of whom used to earn almost minimum wage. Given the limited geographical scope in which delivery was available, there was less competition among restaurants in localized markets due both to the delivery-related costs that restaurant owners were responsible for and food quality quickly degraded depending on delivery time, limiting arbitrage.
With the appearance of delivery applications, however, delivery fees have been introduced and are passed on to customers. The non-trivial delivery fees have created independent professional delivery drivers or riders, who are encouraged to deliver to a little farther location than the restaurants themselves did previously. The introduction of delivery fees through the delivery applications has spurred more options of restaurants for consumers to order from through the expanded delivery market boundaries.[2] Customers may now be able to order food items from distant restaurants by paying higher delivery fees.
Restaurant’s menu prices are not determined solely by its direct costs of inputs such as ingredients, electricity, and gas, but also by costs of other economic factors varying across districts depending on zoning attributes whether it is residential or commercial/business regions such as rent payment and/or average incomes. Thus, it is possible that ordering a food item from a restaurant located in another subdivision is cheaper than ordering a comparable food item from a restaurant located in a subdivision where customers are staying. If it is the case, geographical market size of restaurants can be expanded with delivery applications compared to pre-delivery application era.
Delivery fees incurred in Korean delivery applications are based on uniform-delivered pricing with multiple zones addressing subdivisions in this study (Baedal Minjok, 2022). All customers within a subdivision are charged the same delivery fee irrespective of their specific locations within that subdivision. However, delivery fees vary by subdivision depending on distance from restaurants. Figure 2 illustrates conceptual description of changes in market boundaries. Figure 2 describes the market structure and its changes based on uniform-delivery pricing. Before the delivery platform came into play, restaurant 1 with higher price circumscribes its market up to the distance
  serving a customer while restaurant 2 with lower price
  covers up to
  not serving the same customer in the middle. Two restaurants serve separate markets on their own depending on their transportation cost. With the advent of delivery application service, however, market boundaries for both restaurants expand to more distant regions, competing for customers along the whole lines in Figure 2. Delivery fees in the regions where restaurants are located are
  and
and  , uniform inside their own zones. Higher delivery fees will be charged to farther regions. For example,
  will be charged to customers in the region of restaurant 1 if they order food from restaurant 2, vice versa. In Figure 2, therefore, two restaurants compete for the customer in the middle who faces a higher aggregate price from its local restaurant 1 than the one from distant restaurant 2. Therefore, it may be possible for both restaurants to adjust prices to serve customers and win the competition.
Delivery platform industry in South Korea
Delivery platforms in South Korea have experienced substantial growth over the past 10 years. The proportion of food deliveries requested through delivery applications compared to direct phone calls to restaurants has been increasing from 22% in 2019 to 45% in 2021 (Korea Rural Economic Institute, 2019, 2021). According to Statistics Korea (2022), the industry has increased from KRW2.4 trillion (US$1.9 billion) in 2017 to KRW17.3 trillion (US$14.1 billion) in 2020. There are around 10 delivery applications in the South Korea delivery industry: Baemin, Yogiyo, Coupang Eats, WMPO, Baedaltong, KakaoTalk Delivery, Naver Delivery, etc. Of the applications, the top three, Baemin (59.7%), Yogiyo (23.8%), and Coupang Eats (15.2%), account for 98.7% of the total delivery market (MobileIndex, 2022a), rendering the market oligopolistic with the three leading delivery applications.
At the end of 2019, Delivery Hero, a German multinational online food delivery service company that used to own Yogiyo and Baedaltong, proposed to purchase Baemin, the biggest delivery firm. In response to the proposal, the Korea Fair Trade Commission (KFTC) investigated the possibility of afoul of antitrust law resulting in the delivery markets concentrated after the mergers and acquisitions. In December 2020, KFTC approved the MandA proposal conditioning on divestiture of Yogiyo (KFTC, 2020) because the MandA would have allowed Delivery Hero to take almost 97% of Korean total delivery market share without the condition. Despite the effort of KFTC to keep the market competitive, there are still complaints about high delivery fees from customers and high commissions from restaurants. On average, the delivery fee is KRW3,394 (US$2.71 with currency rate as of March 7, 2022) (Ministry of SMEs and Startups, 2021) and commission charged on restaurants is 12 - 15% of the total food price (Korea JoongAng Daily, 2021b).
Anecdotally speaking, restaurants may have two countervailing effects with delivery applications: 1) burden of commission; and 2) market expansion. Consequences of the expansion of delivery applications on consumers and restaurants themselves have not been examined so far due mostly to unavailability of restaurant level data. In order to fill this gap, this study exploits web scraping and network analysis to examine impacts of delivery applications as a first attempt.
METHODOLOGY
The objective of the study is to investigate the spatial market structure patterns of restaurant businesses and related food delivery by network analysis based on data collected with web scraping. In investigating degrees of competition in the spatial markets, major factors that differentiate products and service should be related to geographical attributes such as distance, travel times and/or transportation cost. Attributes other than geographical features should be similar or close to homogeneous across products. This study examines the spatial price structure of the Jajangmyeon business.
Jajangmyeon market in South Korea
In this study, an item called Jajangmyeon[3] has been chosen as the product of study; it is a noodle dish topped with black bean sauce, diced pork, and vegetables and it was selected because it is relatively homogeneous in ingredients, taste, quality, and portion sizes across restaurants. However, prices vary across restaurants based not only on ingredients and restaurant operating costs, but also on regional characteristics such as income levels, zoning classification (residential, commercial, and industrial zones), and rents in different subdivisions/districts. In addition, delivery fees charged to consumers increase as the distance between restaurant and subdivision where consumers place an order from increases.
There were 4,805 restaurants (which is about 5.5% of total restaurants) selling Jajangmyeon in Seoul in 2019 (Statistics Korea, 2021a) servicing a total population of 9.6 million in the same year (Statistics Korea, 2021b). Figure 3 illustrates the number of Jajangmyeon restaurants and potential market size in the number of populations per restaurant across individual districts (Statistics Korea, 2021a). Table 1 summarized the status of the Jajangmyeon market in Seoul.
Most people in Korea enjoy Jajangmyeon and it is known for “We deliver even to a boat in the middle of the ocean”, which means it is delivered universally not only to closed indoor places like billiards, but also to wide open outdoor places such as parks, riversides, and the top of the mountains. Providing that 4,595 out of 4,805 restaurants serving Jajangmyeon are owned by individuals (Statistics Korea, 2021a), each of them practices their own pricing strategies. In addition, Statistics Korea has Jajangmyeon Price Index as another method for estimating Consumer Price Index (CPI) over time (Statistics Korea, 2022a). As Figure 4 shows, the Jajangmyeon Price Index moves along with CPI just as Housing Rent does. Therefore, it is suggested that Jajangmyeon can be a relevant food item for this research because its price reflects the economic situation.
Data Collection and Analysis
Overall analysis of this study is comprised of three steps: 1) data collection: extraction of Jajangmyeon restaurants data from a delivery application exploiting web-scraping; 2) network cluster analysis: identification of clusters and attractor nodes of Jajangmyeon restaurants through Markov Cluster Algorithm (MCL); and 3) price analysis: analysis of spatial price patterns. The following Figure 5 shows the framework of the study.
Web scraping of delivery app
Web scraping allows authors to collect and process a large amount of data from online spaces using an automated process, as opposed to previously when a manual effort was needed. Web scraping is, therefore, a more efficient way to collect online data than the traditional copy and paste method (Nylen and Wallisch, 2017).
This study scraped Jajangmyeon restaurant data from the Yogiyo delivery application. We chose Yogiyo for two reasons: 1) technical availability of web browser-based interface; and 2) popularity. Unlike other delivery applications in Korea, Yogiyo provides a web browser-based interface which enables web-scraping to collect data from the platform. Baemin which is the top delivery application in Korea does not utilize a web browser-based interface, preventing researchers from web scraping data on the platform. Second, Yogiyo is the second-largest delivery application in Korea and accounts for approximately 22% of the total delivery application market (Nielson Korea Click, 2020). However, this analysis is not about how oligopolistic delivery applications exercise their market shares on restaurants by charging higher commission fees. Rather, this is about pricing strategies of restaurants registered in delivery applications. That being said, examining restaurants’ pricing strategies in one of the leading delivery applications may provide economic insights representing strategic behaviors in restaurant businesses as well as online delivery markets in Korea.
The Octoparse platform (https://service.octoparse.com/ecommercedata), which offers customizable scraping engines and platforms, was used for web-scraping in this analysis.[4] Three stages of data collection using Octoparse were conducted in this study: 1) searching available Jajangmyeon restaurants based on addresses at subdivision level; 2) extracting the data of such information as menus of searched Jajangmyeon restaurants; and 3) inserting restaurant data into the database if the restaurant has Jajangmyeon on their menu.
Network cluster analysis
Network cluster analysis decomposes a network into a sub-network based on connections between nodes. The traditional sub-division-based spatial market boundaries might have been expanded by delivery application introduction. This potential expansion of the market boundaries might have then altered spatial market structure. Thus, this study identifies sub-networks of delivery on a delivery application to specify altered market boundaries, and to analyze the spatial market structure.
This study uses MCL algorithm for network cluster analysis. MCL is an unsupervised cluster analysis algorithm for networks, which is based on the simulation of random walks in a network (Van Dongen, 2000). MCL has been applied in various types of big-data-based network identification research because of its speed and simplicity. For example, MCL was used to identify flight sub-networks from global flight networks (Xu et al., 2017) and researcher networks (Chandrasekharan et al., 2021).
The MCL algorithm starts with the construction of the Origin-Destination matrix. It then alternates the Origin-Destination matrix by iterating three steps: scaling, expansion, and inflation (Van Dongen, 2000). Scaling is the process that constructs the Markov matrix, which shows the probability of transition, by matrix normalization process. The expansion step takes the power of the Markov matrix using the matrix product. This step spreads connections to new vertices and also enhances connections to reachable vertices. In other words, the expansion step enhances within-cluster connection by increasing paths between the two nodes in the same cluster. Then, inflation is conducted by raising each matrix entry to power of over one. The inflation step will inflate entries over one, while deflating entries less than one. Therefore, the effect of the inflation step is to make strong connections stronger and weak connections weaker.
These steps are repeated until the matrix becomes an idempotent Markov matrix, which will not have any further change through expansion and inflation. The rows with one or more positive elements are interpreted as clusters. Each cluster has a star-like form, with one attractor in the center and has connections from all participant nodes. Thus, attractor nodes can be interpreted as the local center of networks. Figure 6 shows an example results of the MCL algorithm.
It is hypothesized that the delivery application has changed the spatial pricing structure by expanding Jajangmyeon restaurants’ reach to neighboring subdivisions. Correlations were explored to discern relationships among the price of Jajangmyeon and additional Jajangmyeon restaurants by delivery apps to explore the prospect of significant relationships between average local price and differences in price between the average local price and the average delivery application prices, . Authors define the average local price as average aggregate price totaled food item price and delivery fees of restaurants in the subdivisions where the restaurants are located. The average delivery application price is defined to be the average aggregate price available from the delivery application accounting for the restaurants both in subdivisions where the restaurants are located and in neighboring subdivisions. If the difference is positive (negative), the average delivery application price is higher (lower) than the average local price. The test is based on the following hypothesis:
The P-value is calculated based on the t-value, which is calculated by the following formula:
where n is the number of connected sub-divisions.
RESULTS AND DISCUSSION
This study collected 1,088 Jajangmyeon restaurants' information on the Yogiyo delivery application from July 2021 to August 2021, accounting for approximately 39% of the total Jajangmyeon restaurants in Seoul. Figure 7 shows the location of collected Jajangmyeon restaurants.
The collected data shows that there are 2.27 Jajangmyeon restaurants on average per subdivision, the average Jajangmyeon price as KRW6,715 (US$5.45 with currency rate as of March 7, 2022), and the average delivery fee as KRW1,552 (US$1.24 with currency rate as of March 7, 2022)[5]. Thus, the average aggregate Jajangmyeon price is KRW8,267 (US$6.71), of which delivery fee accounts for non-trivial 18%. Figure 8 shows the kernel density plot of Jajangmyeon price, delivery fee, and total order cost[6]. The kernel density shows the distribution of Jajangmyeon price and total order cost are right skewed, and delivery fee has two peaks at KRW0 and KRW3,000 (US$2.43 with currency rate as of March 7, 2022) reflecting the current reality that many restaurants still do not charge a delivery fee on the delivery application.
The delivery boundary shows that on average individual Jajangmyeon restaurants deliver to seven subdivisions with an average delivery distance is 1.46 km, which is close to the average radius one subdivision (which is 1.2 km). The delivery boundary is used to generate the Origin-Destination matrix by counting the number of restaurants that can deliver from one subdivision to the other subdivision. Figure 9 and figure 10 shows the Origin-Destination network and kernel density of delivery distance to delivery destination, respectively. Variations of network across districts reflect two market attributes: 1) the number of subdivisions in a single district; and 2) the number of restaurants.
The network in Figure 9 indicates two differences in aspects of Origin-Destination lines. There are thin but many lines in the central and mid-west regions while thick but a smaller number of lines in other regions. Such dense districts as Jongno-gu, Jung-gu were older historical districts developed around 100 years ago with lots of small subdivisions with narrow and mediocre road conditions. On the other hand, other districts such as Gangnam-gu and Seocho-gu were developed relatively recently less than 30 years ago with wider and well-paved road conditions.
Historical urban areas around the central and mid-west districts have complex thin lines with restaurants connecting lots of subdivisions. For example, subdivisions of old historical urban areas have 61.31 connected subdivisions on average, but each connection has 1.15 restaurants on average. On the other hand, the younger modern urban areas encompassing southern districts have simpler thick lines with many restaurants connected across a few subdivisions. Average numbers of connected subdivisions in the young and modern urban areas have 6.41 and each connection have 3.53 restaurants. The results suggest that the market has been expanded more in the older historical urban areas, resulting in a rise in spatial competition after delivery applications came into play in Jajangmyeon food service.
Cluster Analysis
The cluster analysis identifies 9 clusters (9 different colors of dots) and 13 attractor nodes. Figure 11 shows identified clusters and their attractor nodes. Clusters illustrate nodes representing subdivisions connected for deliveries and the identified clusters are almost equivalent to the union of 2 to 4 administrative district units. Since administrative districts are usually separated by geographical barriers, like streams and railroads, delivery clusters are similar to the administrative districts and separated by the river, as expected. Attractor nodes show local centers in clusters and the 13 identified attractor nodes are denser population or denser restaurant areas than their neighbors.
Changes in the number of orderable restaurants
Traditionally, people ordered Jajangmyeon within their own sub-division. From the collected data, only 2.3 restaurants are available to order from in individual subdivisions if delivery applications are not considered (Figure 12). However, Figure 13 illustrates that the Jajangmyeon can be ordered from 13.5 additional Jajangmyeon restaurants from the neighboring subdivisions through the delivery application. Thus, the results show the expansion of consumer choices in the Jajangmyeon market, potentially leading to more competition among restaurants, although expanding competition to include both food and delivery prices/costs.
Changes in the price by delivery apps
The average local price, which is the average aggregate price for foods item and delivery fees of restaurants in the subdivisions where the restaurants are located, is illustrated in Figure 14. Figure 15, on the other hand, displays the average delivery application price, which is the average aggregate price available from the delivery application accounting for the restaurants both in subdivisions where the restaurants are located and in neighboring subdivisions.
The results present a converging pattern of the Jajangmyeon prices with delivery applications. Restaurants with higher local prices reduce prices in farther and more competitive regions to absorb more customers while restaurants with lower local prices have some rooms to raise prices (but still lower than other competing restaurants) to increase profits. Figure 16 illustrates the relationship between average local price and differences in price between the average local price and the average delivery application prices, . If the difference is positive (negative), the average delivery application price is higher (lower) than the average local price. Prices around the subdivisions with higher average local prices decreased with the introduction of delivery applications, while the ones in subdivisions with lower average local prices increased. A negative relationship between price difference and average delivery application price was found. Based on the correlation analysis, the Pearson correlation coefficient is -0.82 and the p-value is 0.000, indicating the negative correlation is statistically significant. Thus, the results suggest a convergence in price, the negative relationship between local prices and delivery application prices, and more competition in the restaurant business.
Figure 17 illustrates the relationship between the minimum local price and the minimum delivery application price. The minimum delivery prices of 129 out of 213 subdivision areas are less than the minimum local prices. Therefore, the results empirically show the possibility of an increase in spatial competition.
CONCLUSION
The introduction of delivery applications has brought changes to the food service industry. Delivery applications charge customers delivery-related costs, and thus, change spatial market structure. As more people now use delivery applications, the importance of delivery application-induced market structure changes becomes more significant.
This paper analyzes delivery application-induced market structure changes using web-scraping and network analysis. Compared with traditional data collection methods, web-scraping can provide more detailed price and delivery boundary information at the individual restaurant level. Web-scraping data facilitated addressing subdivision level spatial market structure changes by cluster and price analysis, but additional analyses are possible in other contexts.
Cluster and price analysis of this study suggests that the number of orderable restaurants has increased by spatial market expansion with the advent of delivery applications. In addition, there was a negative correlation between the average local price and the average price difference between local price and delivery application price, suggesting a converging pattern of Jajangmyeon prices. After the delivery application came into the marketplace, the price increased in low local price areas, while high local price areas experienced the opposite. This may suggest that additional competition might have led the Jajangmyeon price to converge with delivery applications. In addition, the negative correlation was more apparent in more competitive historical urban areas than in less competitive modern urban areas. Given the rapid changes experienced in many urban areas due to pandemic-related disruptions, less frequenting of commercial districts, and more consumption taking place at home, the prospect of changes in spatial competition of restaurants traditionally servicing smaller regions within a city is of particular interest.
Limitations and future research
The results of this study suggest that delivery applications may render food service markets more competitive with price convergence. However, this analysis does not provide insight about individual restaurant’s performance in terms of changes in revenue and profit, nor changes in consumers’ welfare. Web scraping can scrape only visible or accessible information on websites (for example prices, but not quantity sold) which limits the range of research that could be conducted.
Despite the limitation of the techniques one of the major benefits of web-scraping is large-scale data collection which can be used to lessen information asymmetry and make markets more competitive and economically efficient. Datasets do not usually stand alone, but are often used in analysis with other data sources for context and to enrich the depth of the analysis. The main purpose of the current study is to demonstrate the potential of using new methods of online data collection and network analysis for conducting market research. Using these methods, the availability of such information as the number of restaurants in different locations, menu prices, delivery fees, distance between combinations of origins (restaurants)-destinations (customers) facilitates analysis on pricing strategies, promotions strategies, or price differentiation on market structure.
REFERENCES
Alalwan, A.A., 2020. Mobile food ordering apps: An empirical study of the factors affecting customer e-satisfaction and continued intention to reuse. International Journal of Information Management 50: 28–44. https://doi.org/10.1016/j.ijinfomgt.2019.04.008
Baedal Minjok, 2022. Setting Delivery Fee [WWW Document]. Baedal Minjok Manual for Restaurant Owners. URL https://ceo.baemin.com/guide/G81011 (accessed 7.2.22).
Cavallo, A., 2020. Inflation with Covid Consumption Baskets. Working Paper Series. https://doi.org/10.3386/w27352
Cavallo, A. and R. Rigobon. 2016. The Billion Prices Project: Using Online Prices for Measurement and Research. Journal of Economic Perspectives 30: 151–178. https://doi.org/10.1257/jep.30.2.151
CDC, 2022. Food Delivery Safety [WWW Document]. Centers for Disease Control and Prevention. URL https://www.cdc.gov/foodsafety/communication/food-safety-meal-kits.html (accessed 5.4.22).
Chandrasekharan, S., M. Zaka, S. Gallo, W. Zhao, D. Korobskiy, T. Warnow and G. Chacko. 2021. Finding scientific communities in citation graphs: Articles and authors. Quantitative Science Studies 2: 184–203. https://doi.org/10.1162/qss_a_00095
Cheng, C.-C., Y.-Y. Chang and C.-T. Chen. 2021. Construction of a service quality scale for the online food delivery industry. International Journal of Hospitality Management 95: 102938. https://doi.org/10.1016/j.ijhm.2021.102938
Cho, M., M.A. Bonn, J Li. 2019. Differences in perceptions about food delivery apps between single-person and multi-person households. International Journal of Hospitality Management 77: 108–116. https://doi.org/10.1016/j.ijhm.2018.06.019
Correa, J.C., W. Garzón, P. Brooker, G. Sakarkar, S.A. Carranza, L. Yunado and A. Rincón. 2019. Evaluation of collaborative consumption of food delivery services through web mining techniques. Journal of Retailing and Consumer Services 46: 45–50. https://doi.org/10.1016/j.jretconser.2018.05.002
Etumnu, C.E., K. Foster, N.O. Widmar, J.L. Lusk, D.L. Ortega. 2020. Does the distribution of ratings affect online grocery sales? Evidence from Amazon. Agribusiness 36: 501–521. https://doi.org/10.1002/agr.21653
Frankel, A. 2022. Anti-hacking law does not bar data scraping from public websites - 9th Circuit [WWW Document]. URL https://www.reuters.com/legal/litigation/anti-hacking-law-does-not-bar-data-scraping-public-websites-9th-circuit-2022-04-19/ (accessed 5.4.22).
Global Competition Review. 2022. Asia-Pacific Antitrust Review 2022 - China:Overview [WWW Document]. URL https://globalcompetitionreview.com/review/the-asia-pacific-antitrust-review/2022/article/china-overview (accessed 9.11.22).
Gunden, N., C. Morosan and A. DeFranco. 2020. Consumers’ intentions to use online food delivery systems in the USA. International Journal of Contemporary Hospitality Management 32: 1325–1345. https://doi.org/10.1108/IJCHM-06-2019-0595
Hwang, J., S.-B. Cho and W. Kim. 2019. Consequences of psychological benefits of using eco-friendly services in the context of drone food delivery services. Journal of Travel and Tourism Marketing 36: 835–846. https://doi.org/10.1080/10548408.2019.1586619
Hwang, J. and J.J. Kim. 2021b. Expected benefits with using drone food delivery services: its impacts on attitude and behavioral intentions. Journal of Hospitality and Tourism Technology 12: 593–606. https://doi.org/10.1108/JHTT-05-2020-0123
Hwang, J., W. Kim and J.J. Kim. 2020b. Application of the value-belief-norm model to environmentally friendly drone food delivery services: The moderating role of product involvement. International Journal of Contemporary Hospitality Management 32: 1775–1794. https://doi.org/10.1108/IJCHM-08-2019-0710
IMARC. 2021a. Online Food Delivery Market Research, Size, Share 2022-2027 [WWW Document]. URL https://www.imarcgroup.com/online-food-delivery-market (accessed 3.12.22).
IMARC. 2021b. Global Online Food Delivery Market to Grow at 11.44% During 2022-2027, Supported by Rising Demand for RTE Products [WWW Document]. URL https://www.imarcgroup.com/global-online-food-delivery-market (accessed 3.12.22).
Jiang, Y., P.-L. Lai, C.-C. Yang and X. Wang. 2023. Exploring the factors that drive consumers to use contactless delivery services in the context of the continued COVID-19 pandemic. Journal of Retailing and Consumer Services 103276. https://doi.org/10.1016/j.jretconser.2023.103276
Jung, J. 2021. A case study of analyzing agricultural and food retails in Korea with web scraping [WWW Document]. URL https://www.krei.re.kr/krei/researchReportView.do?key=67andpageType=010101andbiblioId=528517andpageUnit=10andsearchCnd=allandsearchKrwd=andpageIndex=7andengView= (accessed 5.4.22).
KFTC, 2020. Yogiyo Baemin Conditional Merger Approval [WWW Document]. URL https://www.ftc.go.kr/www/selectReportUserView.do?key=10andrpttype=1andreport_data_no=8891 (accessed 5.4.22).
Kim, M. 2009. Inculturation of jajangmyeon in Korea. Korean Folklore 50, 159–207.
Korea JoongAng Daily. 2021. Delivery Hero and the game of monopoly.
Korea Rural Economic Institute. 2021. The consumer behavior survey for food 2021. Korea Rural Economic Institute.
Korea Rural Economic Institute. 2019. The consumer behavior survey for food 2019. Korea Rural Economic Institute.
Korean Bapsang. 2020. Jajangmyeon (Noodles in Black Bean Sauce). Korean Bapsang. URL https://www.koreanbapsang.com/jajangmyeon-noodles-in-black-bean-sauce/ (accessed 3.11.22).
Kumar, S. and A. Shah. 2021. Revisiting food delivery apps during COVID-19 pandemic? Investigating the role of emotions. Journal of Retailing and Consumer Services 62: 102595. https://doi.org/10.1016/j.jretconser.2021.102595
Macias, P., D. Stelmasiak and K. Szafranek. 2022. Nowcasting food inflation with a massive amount of online prices. International Journal of Forecasting 39(2): 809-826, https://doi.org/10.1016/j.ijforecast.2022.02.007
Meena, P. and G. Kumar. 2022. Online food delivery companies’ performance and consumers expectations during Covid-19: An investigation using machine learning approach. Journal of Retailing and Consumer Services 68: 103052. https://doi.org/10.1016/j.jretconser.2022.103052
Ministry of SMEs and Startups. 2021. 2021 Online Platform Users Survey [WWW Document]. URL https://www.mss.go.kr/site/smba/ex/bbs/View.do?cbIdx=86andbcIdx=1030621andparentSeq=1030621 (accessed 5.4.22).
MobileIndex. 2022a. Restaurant Business Report [WWW Document]. URL https://hd.mobileindex.com/report/?s=180 (accessed 7.12.22).
MobileIndex. 2022b. Mobile Application Usage Report [WWW Document]. URL (accessed 7.13.22).
Nielson Korea Click. 2020. Contactless life, inducing expansion delivery markets [WWW Document]. URL http://www.koreanclick.com/english/insights/newsletter_view.html?code=topicandid=591andpage=1 (accessed 3.12.22).
Novita, D. and N. Husna. 2020. The Influence Factors of Consumer Behavioral Intention Towards Online Food Delivery Services. International Journal of Business 3: 40–42. https://doi.org/10.33365/tb.v3i2.840
Nylen, E. L and P. Wallisch. 2017. Neural Data Science: A Primer with MATLAB and Python, 1st edition. ed. Academic Press, London, United Kingdom.
Okumus, B., F. Ali, A. Bilgihan and A.B. Ozturk. 2018. Psychological factors influencing customers’ acceptance of smartphone diet apps when ordering food at restaurants. International Journal of Hospitality Management 72: 67–77. https://doi.org/10.1016/j.ijhm.2018.01.001
Ray, A., A. Dhir, P.K. Bala and P. Kaur. 2019. Why do people use food delivery apps (FDA)? A uses and gratification theory perspective. Journal of Retailing and Consumer Services 51: 221–230. https://doi.org/10.1016/j.jretconser.2019.05.025
Seoul Open Data. 2021. Sub-division Level Statistics of Seoul [WWW Document]. URL https://data.seoul.go.kr (accessed 4.20.22).
Shah, A.M., A.Z. Abbasi and X. Yan. 2023. Do online peer reviews stimulate diners’ continued log-in behavior: Investigating the role of emotions in the O2O meal delivery apps context. Journal of Retailing and Consumer Services 72: 103234. https://doi.org/10.1016/j.jretconser.2022.103234
Statistics Korea. 2022a. Consumer price index [WWW Document]. URL https://kosis.kr/statHtml/statHtml.do?orgId=101andtblId=DT_1J15112andconn_path=I3 (accessed 3.11.22).
Statistics Korea. 2022b. Monthly Online Shopping Survey [WWW Document]. URL https://kostat.go.kr/portal/eng/surveyOutline/2/5/index.static (accessed 3.11.22).
Statistics Korea. 2021a. Business Demography Statistics in Korea [WWW Document]. URL https://kosis.kr/statHtml/statHtml.do?orgId=101andtblId=DT_1IN1502andconn_path=I2andlanguage=en (accessed 3.12.22).
Statistics Korea. 2021b. Population, Households and Housing Units [WWW Document]. URL https://kosis.kr/statHtml/statHtml.do?orgId=101andtblId=DT_1IN1502andconn_path=I2andlanguage=en (accessed 3.12.22).
Tandon, A., P. Kaur, Y. Bhatt, M. Mäntymäki and A. Dhir. 2021. Why do people purchase from food delivery apps? A consumer value perspective. Journal of Retailing and Consumer Services 63: 102667. https://doi.org/10.1016/j.jretconser.2021.102667
Van Dongen, S.M. 2000. Graph clustering by flow simulation (PhD Thesis). University Utrecht.
Wang, O. and F. Scrimgeour. 2021. Consumer adoption of online-to-offline food delivery services in China and New Zealand. British Food Journal 124: 1590–1608. https://doi.org/10.1108/BFJ-03-2021-0208
Whittaker, Z. 2022. Web scraping is legal, US appeals court reaffirms. TechCrunch. URL https://social.techcrunch.com/2022/04/18/web-scraping-legal-court/ (accessed 5.4.22).
Williams, G., M. Tushev, F. Ebrahimi and A. Mahmoud. 2020. Modeling user concerns in Sharing Economy: the case of food delivery apps. Automated Software Engineering 27: 229–263. https://doi.org/10.1007/s10515-020-00274-7
Xu, K., T. Long, S. Qiao, Y. Zheng and N. Han. 2017. A Global Flight Networks Analysis Approach Using Markov Clustering and PageRank. 2017 IEEE International Conference on Big Knowledge (ICBK). https://doi.org/10.1109/ICBK.2017.42
Zhao, Y. and F. Bacao. 2020. What factors determining customer continuingly using food delivery apps during 2019 novel coronavirus pandemic period? International Journal of Hospitality Management 91: 102683. https://doi.org/10.1016/j.ijhm.2020.102683
[1] Web-scrapping has been extensively used for other research topics such as retail prices (Cavallo, 2020), inflation (Cavallo and Rigobon, 2016), food price now/forecasting (Macias et al., 2022), etc., but not for geographical market structure in restaurant businesses from delivery applications.
[2] There is a minimum total amount due at checkout to use delivery service in Korea and it varies from restaurant to restaurant. That being said, in this study, only orders qualified for delivery service by meeting the minimum total amount due are considered, as explained in the Methods section.
[3] Introduction of Jajangmyeon and recipes are available at Korean Bapsang (2020).
[4] The raw data scraped is available upon request. In addition to the Octoparse platform, the data is currently being scraped with the Python selenium code that authors created.
[5] The delivery fee was initially averaged at the restaurant level, then the total average delivery fee was calculated.
[6] The total order cost is defined as the sum of the Jajangmyeon price and delivery fee.
[7] One restaurant connection is omitted for simplicity.