ABSTRACT
This study tries to develop a new type of consumer prices index by utilizing price and quantity data of food items collected daily from online grocery stores via web-scrapping, E-CPI. The E-CPI introduced in this study is developed by weighing prices by quantity sold collected for individual items and stores considered in this study. It shows that the prices introduced move closely with the current prices from offline markets with higher frequency such as daily variation. Furthermore, E-CPI weighed by quantity sold presents much closer behavior with the current CPI with such higher frequency. This study contributes to the field of this study in two-fold, 1) authors firstly detect information of quantity sold from online grocery websites, which improve the quality of E-CPI developed based on online prices and 2) publishing E-CPI with daily frequency may further improve usability of CPI information and mitigate a degree of information asymmetry in the grocery markets by allowing the public and consumers to monitor price changes as more frequently as daily.
Keywords: Online Grocery Markets, Price Index, Big Data, Web-Scraping, Consumer Behavior
INTRODUCTION
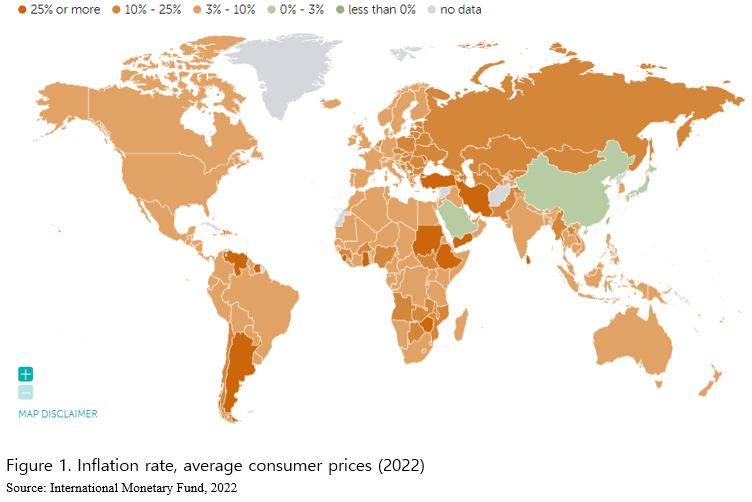
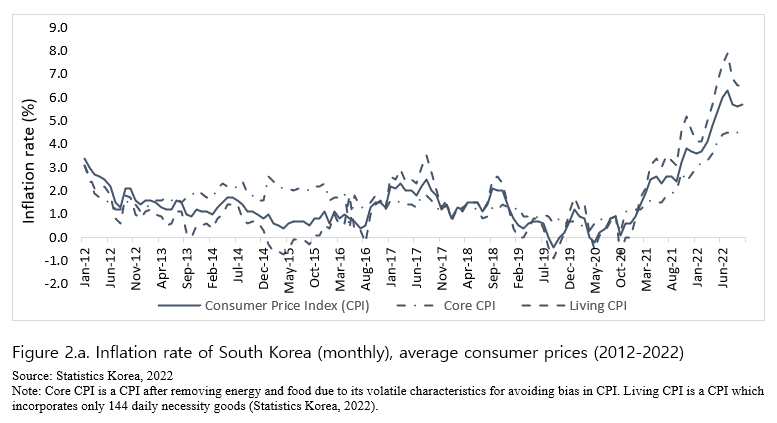
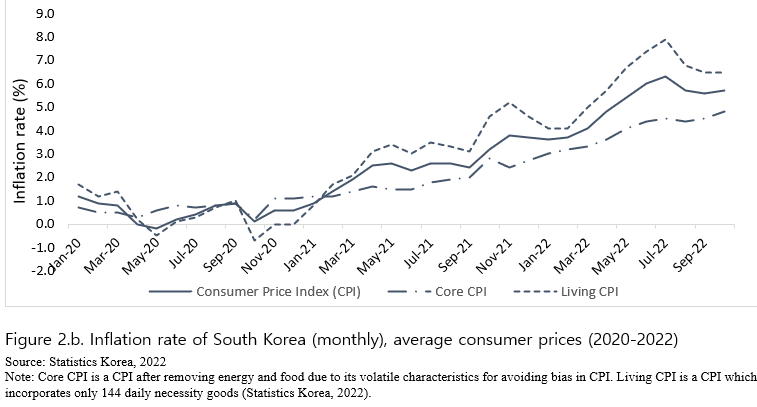
Over the recent 2 years, inflation has been continuously rising all over the world at an unprecedented rate (Figure 1). This is attributed mainly to supply disruptions, affecting almost all products from energy to food. South Korea is no exception from the recent skyrocketing inflation rate for food as well as other consumer goods (Figure 2.a). Considering that the inflation rate for food has been volatile and increasing within such shorter time period as monthly, weekly or even daily (Figure 2.b), the need for the real-time consumer price index has never been emphasized than nowadays. The current Consumer Price Index (CPI) that Statistics Korea announces is based on prices collected for pre-selected representative food items from particular grocery stores (Statistics Korea, 2022). This is carried out once a month by CPI data collectors from sampled 26,000 brick-and-mortar grocery establishments in 40 of the biggest cities in Korea (Statistics Korea, 2022). Given the process of data collection, the current CPI tends to lag behind at least by two weeks or a month (that is, the CPI for January is released in mid-February at the earliest), limiting the general usefulness of the official CPI as a real-time measure for inflation rate. It is more so for consumers who are non-economists and may also lead to a discrepancy between the released CPI and consumers’ perceived inflation for their grocery baskets.
That being said, an importance of providing an accurate CPI in a real-time manner has been underscored by previous studies that developed high frequency CPI based on scanner data (Zhen et al., 2018), collect daily prices for online micro price data exploiting web-scraping (The Billion Prices Project, 2008) and create an inflation series based on the online data (Cavallo and Rigobon, 2016), or conduct inflation nowcasts using web-scraped online grocery data (Macias et al., 2022). Using scanner data or web-scraped online data improves data quality in methods of more frequent data collection and the larger number of sample products, providing high-frequency prices indexes superior to the standard CPI (Zhen et al., 2018; Cavallo and Rigobon, 2016) or remarkably improving nowcast accuracy (Macias et al., 2022).
Meanwhile, the dramatic rise in e-commerce over COVID-19 also happened in agricultural commodity sales in the online space. The Korean Consumer Behavior Survey for Food shows that online purchase for agricultural products at the household level has increased from 20.4% in 2019 to 27.1% in 2020. In addition, the Korean Online Shopping Trends Statistics shows that agricultural products purchase has increased from KRW3.0 billion (US$2.5 million) in 2018 to KRW6.2 billion (US$5.2 million) in 2020 (Jung et al., 2021; Statistics Korea, 2021). COVID-19 in this case may be a situational factor in driving consumers to initiate online grocery shopping to mitigate potential exposure to the virus (Kvalsvik, 2022; Jensen et al., 2021; Grashius and Skevas, 2021; Hand et al., 2009). In addition, those consumers satisfied with online shopping over the COVID-19 may retain the online shopping behavior after the pandemic subsides (Singh and Söderlund, 2020; Singh, 2019; Yeo et al., 2017). The increased share in online shopping for agricultural products in combination with the increasing food inflation at the fast rate and its volatility has stimulated an interest in estimating a more accurate agricultural and food price index among economists and policymakers.
This study follows the previous studies for developing high-frequency CPI using online data collected by a novel data gathering technique called web-scraping (Macias et al., 2022; Cavallo and Rigobon, 2016; The Billion Prices Project, 2008). Web-scraping is a data collection technique for the automated extraction of information from websites (Jung et al., 2021; Hillen, 2019). It has many advantages in collecting data from online space. First, the data collection process is faster than traditional survey- or panel-based methods considering that web-scraping uses an automated process of amassing data. Second, the data collection cycle is much shorter than survey- or panel-based methods, implemented as in a short cycle as a daily basis, without additional costs. Having said that, the delay in data collection is marginal as prices can be observed, accessed, and obtained remotely at any time on demand. Third, with unlimited access to and ubiquitous availability of online data, researchers do not necessarily incur substantial cost of data gathering, which is often the case with scanner data provided by private firms (Cavallo and Rigobon, 2016). Last but not the least, web-scraping allows researchers to gather additional information such as detailed product information. Web-scraping allows researchers and policymakers to have such a vital statistic of the economy as an online price index in a real-time manner. Although web-scraping has many advantages, however, there is one critical weakness of data scrapping that limits developing web-scrapping-based price indices, the unavailability of sales data from online retailers’ websites.
However, the limitation of developing a web-scraping-based price index is a missing data for sales. The price index is estimated by weighing price based on sales proportion in most of the countries (Statistics Korea, 2022; US BLS, 2020), which is usually unavailable from online grocery stores websites. In addition, online retailers have many unsold or rarely sold items on their websites. In other words, the price index may be seriously biased without sales-based weights. Prior studies suggested various alternative methods to overcome the absence of sales data. For example, Diewert and Fox (2020) suggested a continuous expenditure survey to collect expenditure data with keeping a short price index cycle. Cavallo (2020) suggested using debit card transaction data. Aparacio, Metzman, and Rigobon (2021) utilized Nielson’s Retail Scanner data by restricting the set of matched products as those in the online data and market share of the online retailers. Macias et al., (2022) mentioned that they used official expenditure weights. Nevertheless, these alternative methods merely circumvent the unavailability and still have difficulty addressing the limited access to the online sales data. In other words, utilization of data extracted via web-scraping for estimating price index is highly limited due to the unavailability of online sales data. In particular, the online price index may be more biased for product categories where consumers’ purchasing behavior is expected to be different between online and offline such as fresh items. For example, grocery shopping behaviors may be more different between online and offline compared to other manufactured and durable goods due to the characteristics of food items that is easily perishable or degraded on its delivery and consumers’ preference to touch fresh food items.
In this case study, authors not to circumvent, but find any sources of information offering sales data from the online grocery stores websites so that it would be possible to develop online CPI based on actual sales data. This is the first study that finds a variable from online grocery stores, which represents the number of remaining stocks for individual registered items and estimates sales information by keeping track of the changes of the number of remaining stocks. This can be done by extracting the number of remaining stocks eight times a day. By doing so, nearly population data for online grocery items can be collected, which is another advantage of web-scraping in terms of data quality over scanner data representing around 40% of total expenditures. Thus, we are able to collect novel dataset for the number of sales of each item by exploiting web-scraping.
This case study contributes to the literature in three ways. First, to the best of the authors’ knowledge, this is the novel study that scrapes data of the remaining number of stocks from websites and estimate sales information to create an online agricultural commodity price index. Unlike previous studies which suggested linking alternative expenditure data, in this study, we have shown that such data can be collected through web-scraping techniques, providing exact information for estimating price index. Second, more frequent CPI and daily price information can be used to reduce degrees of information asymmetry among consumers. What this study is trying to do may be a pathway to transparent information sharing of prices of grocery items. Last but not the least, this study used natural language processing to automate the product classification process. It has automated the collection and filtering process using natural language processing. This study demonstrates a structure for empirical use of web-scraping data.
PROCEDURE OF DATA COLLECTION AND ANALYSIS
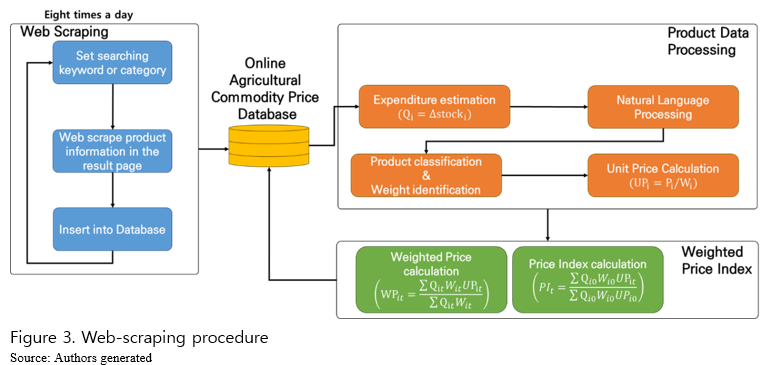
This study consists of three steps: 1) web-scraping of product information (what commodity, methods and degrees of food processing, weights, a growing method such as organic, etc.), price, and the number of remaining stocks through web-scraping; 2) data processing (estimation of sales, product classification, weight information for estimating unit prices); and 3) calculation of weighted price index at the agricultural product level. Figure 3 illustrates these steps.
Web-scraping of product information
Web-scraping is an online data collection technique. It is commonly used to extract data from websites, and some studies already tried to collect prices of agricultural commodities through web-scrapping (Macias et al., 2022; Cavallo and Rigobon, 2016; The Billion Prices Project, 2008). Web-scraping is, therefore, a more efficient way to collect data from websites with lower cost.[2]
On the first step, web-scraping is performed from 15 major online retailer websites for products of four main agricultural commodities in South Korea: garlic, onion, potato, and egg. The 15 online retailer websites were selected based on their market size and accessibility. The 15 online retailer covers about 95% of in-app purchase (IGAWorks, 2021). Thus, data amassed from the 15 online retailers covers most of the online retailer data, rendering a calculated weighted price a potentially reliable and representative source of price and quantity information. Data scrapping process is conducted eight times a day to track changes of the number of remaining stocks to estimate the quantity sold over the period of 6 months from November 2021 to April 2022. In addition, we validate the data by comparing it with the actual revenue provided from online retailers and confirm that the difference in revenue between web-scraped data and online retailer data is ignorable.
Through the web-scraping technique, this study collected product information, like product title, price, inventory quantity, and discount information. More specifically, this study collected the top 1,000 sold items for each product on 15 websites due to speed issues. It is not expected that one cycle of scrapping should not be overlapped with the next one after three hours. The top 1,000 sold products cover over 94% of the total items sold. For several websites with sales information provided on its screens, we collected both the inventory behind the websites and disclosed sales numbers for comparison. This further validates our approach of collecting the stock information for estimating sales numbers.
Data processing of product information
After the collection, we process the web-scraping data, which is stacked around 0.2 million products in a day. This step consists of three parts: 1) sales estimation; 2) product classification; and 3) weight identification. We first estimate sales volume by calculating differences in the inventory number by three hours. In the case of inventory update with a sudden rise of the number, average sales volume at the same time period from the previous two weeks was used to fill the point of inventory update. In this step, items without sales are removed. Considering most of purchases in online retailing websites happen from a few popular products, almost 90% registered products are removed.
We then perform Recurrent Neural Networks (RNN) based deep learning technique to perform text classification. The retail websites have many items with misclassified categories. For example, Xiaomi, which is considered one of the largest electronic companies, is occasionally classified as rice because of its meaning. Thus, this study builds a text classification model based on RNN. Out of various specific deep learning approaches, Long Short-Term Memory (LSTM) based text classification model is utilized. To train the model, more than 3,000 randomly selected products data for each agricultural commodity were used. The text classification model shows over 95% of accuracy. In addition, the manual test by using newly collected product titles and options shows over 90% of accuracy. Through this step, miscategorized or irrelevant items can be removed.
In the last part, this study identifies the weights of each product using natural language processing techniques. Natural language processing allows separating the product titles and options into morpheme units. From the tokenized word lists, the number before the word of weight units, like kg or g, is identified as the weight information.
Calculation of price index
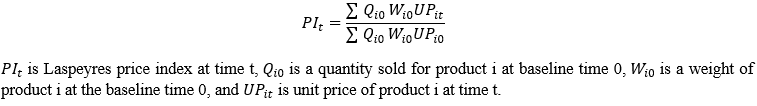
Such detailed information extracted and organized from deep learning and natural language processing enables us to calculate the weighted prices index based on estimated sales and weights. We use the Laspeyres index formula, which is the same way as the Korean official price index calculation.
ANALYSIS OF ONLINE CONSUMER PRICE INDEX
Data collected by web-scraping
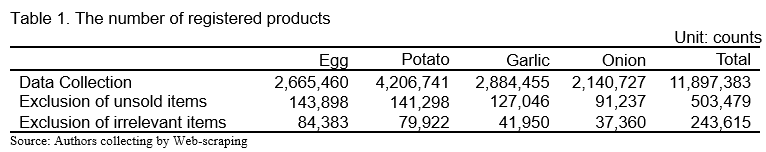
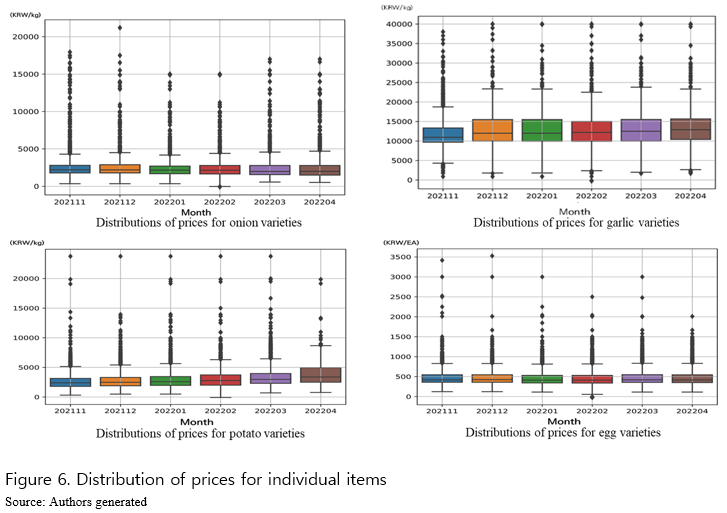
Based on the data collected, the total number of registered products are around 11,890,000; around 2,660,000 registered products of eggs, 4,200,000 registered products of potatoes, 2,880,000 registered products of garlics, and 2,140,000 registered products of onions (Table 1). Of all the products registered and collected, around 5% are actually sold (Table1). In addition, fresh food malls that specialize in grocery items shows higher proportion of purchased products over 10% for some malls. Open markets have lower proportion of purchased items albeit the largest number of registered products (Figures 4, 5, 6).[3]
Data validation
While this study collects the number of remaining stocks from websites, there is one issue in collecting such information. Does the variable represent the absolute number of remaining stocks or something else such as index? Although the variable changes and is updated exactly by the same amount of item purchased from the experiment that this study conducts, it is still a question worth asking because it is directly related to the data validation and analysis quality. For validating the quantity data collected, Korea Rural Economic Institute requested the cooperation of such online retailers in providing monthly revenue from online sales for corresponding items. As a result of comparing revenue from scrapped data (estimated revenue) and provided data (observed revenue), both revenues coincide by from 70% to 100% depending on items and retailers.[3] With that said, authors decided to use the quantity data collected by using the variables of the websites.
Analysis of CPI
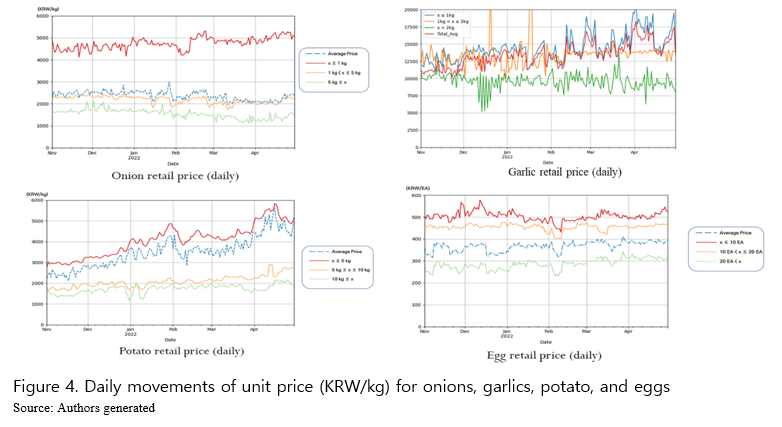
For it is expected that heavier (lighter) products have lower (higher) unit price, scrapped products are sorted into different group of weights after extracting weight information from the titles. For onions, weights are cut at 1kg, 5kg, and above. Garlics are cut at 1kg, 2kg and above. When it gets to potato which is usually heavier than onions and garlics, weights are cut at 5kg, 10kg, and above. Eggs are categorized into 10 EA, 20 EA, and above. Figure 4 illustrates that unit price (KRW/kg or KRW/EA) of individual items increases as weight of products decreases as is expected. For example, small packaged onion products less than 1kg present prices around KRW4,500/kg while big packages goods heavier than 5kg show KRW1,500/kg, one third of the small packaged products.
When it comes to garlic products, in South Korea, the unit of measuring weight is still traditional such as a one certain bucket size regardless of physical size of garlic on online grocery stores. One single bucket is equivalent to 8kg and this study converts the unit of a bucket into kg. As is the case of onions, the larger the products, the lower the unit prices are (Figure 4). The patterns are shown to be the same for other items such as potatoes and eggs (Figure 4).
E-CPI of individual items
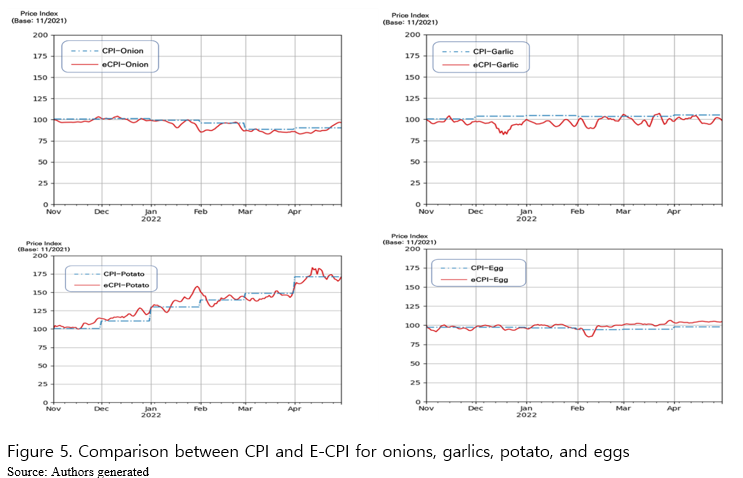
Validating the quantity sold data and daily variations of unit prices for individual products, usefulness and applicability of the suggested E-CPI are examined by comparing it to the existing CPI. As CPI is calculated by applying Laspeyres index for weighted average price, so is E-CPI with quantity sold collected for individual items sold online (Figure 5). Trend of the E-CPI is moving closely with the existing CPI very well with daily variations added over the 6 months period of interest. The closeness in trends of the two price indices suggests that E-CPI weighted by quantity sold in online grocery malls can be a useful resource and provision of daily variations of prices (Figure 4) and E-CPI (Figure 5) may enhance quality and usefulness of prices index information not only for economists and/or policymakers, but also for the general public. The existing CPI does not provide daily variations of prices and related index, which limits usefulness of the index.
In addition, compared to online data collection scrapping all the registered products on the online grocery websites, the existing CPI exploits prices of the sample products. Considering a wide distribution of the prices across product varieties based on horizontal/vertical product differentiation, sellers, and/or brands of the same food items (Figure 6), utilizing prices of several sample products may bring a certain level of bias to the price information. Given such advanced data collecting techniques available as web-scrapping which enables obtaining datasets close to a population data for price and quantity in a higher frequency and a lower cost, this study suggests online data scrapped would provide more detailed information, improving usefulness and applicability of E-CPI as a partial complement to the existing CPI. Last but not the least, as is reported by Jung et al., (2021), quantity information collected from online retailers may share more insightful information about consumers’ behavior in online spaces such as purchasing patterns over a week. Furthermore, the online datasets when used properly may expand research work in price forecasting and support monetary policymakers. For example, as Macias et al., (2022) conducts, daily prices may make it possible to nowcast rather than forecast food price, which helps monetary policymakers to make more immediate confrontation on such rapidly changing matters as the recent rise in inflation.
However, the suggested approach is not without limitations. This study considers only four representative food items. Having said that, more extensive food items and other goods included in calculating CPI should be examined to further the level of understanding and finding usefulness of the datasets collected from online retailers by web-scrapping.
A CASE OF UTILIZING ONLINE GROCERY DATA FOR INFORMATION SYMMETRY
Dashboard for monitoring grocery prices
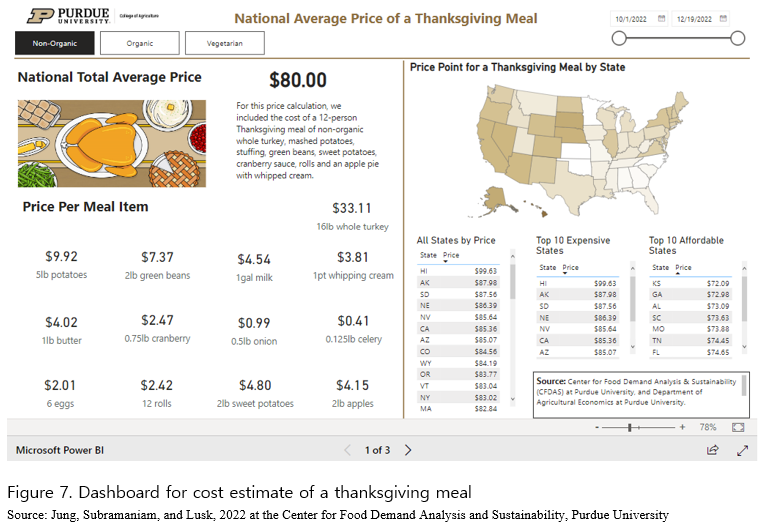
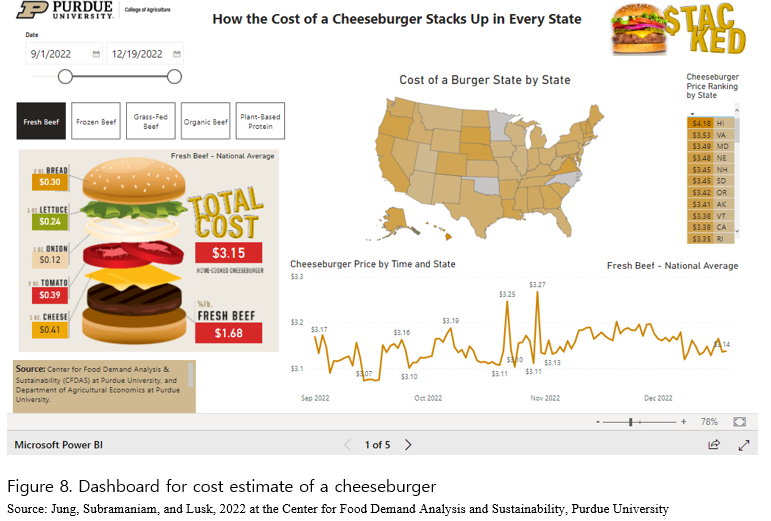
Extensive data collection via web-scraping has already been utilized for purposes of enhancing information symmetry in combination with data visualization. One major benefit of collecting data from online space via web-scrapping is that it allows the public to monitor price information in a real-time manner, which may alleviate a degree of information asymmetry in the whole economy. This study introduces one exemplary use of web-scraping and data visualization of the online grocery markets in the U.S. Center for Food Demand Analysis and Sustainability at Purdue University publishes interactive dashboards for cost estimates of grocery baskets for thanksgiving (Figure 7, https://ag.purdue.edu/cfdas/resource-library/the-cost-of-a-thanksgiving-meal/) and cheeseburger (Figure 8, https://ag.purdue.edu/cfdas/resource-library/cost-of-a-cheeseburger/) (Jung, Subramaniam, and Lusk, 2022). This is based on data collected daily via web-scrapping from 20 grocery stores across 342 Zip codes over 47 states in the US, counting upon the permission of grocery stores for data mining from its websites. The dashboard provides cost of grocery baskets and individual items that the baskets contain in each state updated daily, which allows consumers to compare cost over time and states. This daily monitoring of prices has another benefit over the present CPI. The consumers do not utilize CPI for their grocery shopping because of the misalignment in time between collection of price data and its publication. CPI announced today is usually based on prices of food items 2 weeks ago at least. Given the fast-changing environment of the world economy, web-scrapping is expected to provide price information for the public and/or consumers in a timelier manner. This may be more so when it comes to such a seasonal dinner table plan as Thanksgiving.
Considering that consumers do not have access to the information on their own while private firms/companies are already utilizing web-scrapping for their marketing or strategic purposes, provision of the similar information by government or non-profit organization such as research centers may improve market efficiency in the nearby big data era.
CONCLUSION
Utilizing novel big data analytic techniques, web-scraping for collecting online grocery data and machine learning for text mining, we amass such a novel grocery store big data that contains detailed product information such as prices, the number of stocks, methods of food process, packages based on different weights, methods of farming such as conventional or organic, etc. The main contribution of this study in comparison to previous studies in this field of research is that we provide sales data for individual items estimated by closely monitoring changes in the number of stocks from the grocery store websites eight times a day. The sales data collected allows development of online food price indices with direct expenditure weight.
This study develops price indices for four main agricultural commodities in Korea for the first time. The results show that individual food price and its indices move closely with the official CPI with such a higher frequency as daily-basis provided when the prices are weighed by sales data scrapped.
Validating quality of the web-scrapped data from online grocery stores, the dataset in this study which is for more specified products and granular frequency will be more useful for the future research not only for developing or estimating the associated measurement such as online CPI, but also for estimating price elasticity of online grocery demand for individual items and/or nowcasting food inflation rate in real-time over a challenging period such as COVID-19 and/or under the more recent supply chain disruptions. In addition, the real-time online datasets may support monetary policymakers in dealing with more immediate instances with rapidly increasing inflation.
REFERENCES
Aparicio, D. Metzman, Z., and Rigobon, R. 2021. The Pricing Strategies of Online Grocery Retailers. National Bureau of Economic Research. Working paper: 28639. Available at https://www.nber.org/papers/w28639
Billion Prices Project. 2008. The Billion Prices Project. Available at http://www.thebillionpricesproject.com/
Cavallo, A. and Rigobon, R. 2016. The Billion Prices Project: Using Online Prices for Measurement and Research. Journal of Economic Perspectives. 30 (2): 151-78.
Cavallo. 2020. Inflation with Covid Consumption Baskets. National Bureau of Economic Research. Working paper: 27352. Available at https://www.nber.org/papers/w27352
Diewert, E. and Fox, K. 2020. Measuring Real Consumption and CPI Bias under Lockdown Conditions. National Bureau of Economic Research. Working paper: 27144. Available at https://www.nber.org/papers/w27144
Grashius, J. and T. Skevas. 2020. “Grocery Shopping Preferences During the COVID-19 Pandemic.” Sustainability 12, 5369 (2020). http://dx.doi.org/10.3390/su12135369
Hand, C., Riley, F. D., Harris, P., Singh, J., and Rettie, R. 2009. Online grocery shopping: the influence of situational factors. European Journal of Marketing. 40(9/10), 1205-1218. Available from https://doi.org/10.1108/03090560910976447
Hillen, J. 2019. Web scraping for food price research. British Food Journal. 121(12), 3350-3361.
IGAWorks. 2021. Mobileindex Insight, accessed October 30, 2021
Jensen, K. L., Yenerall, J., Chen, X., and Yu, T. E. 2021. US Consumers’ Online Shopping Behavior and Intentions During and After the COVID-19 Pandemic. Journal of Agricultural and Applied Economics. 53. 416-434. Available from https://doi.org/10.1017/aae.2021.15
Jung, J., Subramaniam, and Lusk, J. L. 2022. How the Cost of a Cheeseburger Stacks Up in Every State. Center for Food Demand Analysis. Available at https://ag.purdue.edu/cfdas/resource-library/cost-of-a-cheeseburger/
Jung, J., Subramaniam, and Lusk, J. L. 2022. The Cost of a Thanksgiving Meal. Center for Food Demand Analysis. Available at https://ag.purdue.edu/cfdas/resource-library/the-cost-of-a-thanksgiving-meal/
Jung, J., Kim, Y., and Kim, S. 2021. What does web-scraping tell us about online grocery markets? A case study in South Korea. Food and Fertilizer Technology Center for the Asian and Pacific Regions. Available at https://ap.fftc.org.tw/article/2910
Kvalsvik, F. 2022. Understanding the role of situational factors on online grocery shopping among older adults. Journal of Retailing and Consumer Services. 68, 103009. Available from https://doi.org/10.1016/j.jretconser.2022.103009
Macias, P. Stelmasiak, D., and Szafranek, K. 2022. Nowcasting Food Inflation with a Massive Amount of Online Prices. International Journal of Forecasting. In Press. Available at https://doi.org/10.1016/j.ijforecast.2022.02.007
Singh, R. 2019. Why do online grocery shoppers switch or stay? An exploratory analysis of consumers’ response to online grocery shopping experience. International Journal of Retail & Distribution Management. 47(12). 1300-1317. https://doi.org/10.1108/IJRDM-10-2018-0224
Singh, R. and Söderlund, M. 2020. Extending the experience construct: an examination of online grocery shopping. European Journal of Marketing. 54(10), 2419-2446. https://doi.org/10.1108/EJM-06-2019-0536
Statistics Korea. 2022. Consumer Price Index. Available at http://kostat.go.kr/incomeNcpi/cpi/index.action
U.S. Bureau of Labor Statistics. 2020. Consumer Price Index: Calculation, Handbook of Methods. Available at https://www.bls.gov/opub/hom/cpi/calculation.htm
Yeo, VCS., Goh, S-K., and Rezaei, S. 2017. Consumer experiences, attitude and behavioral intention toward online food delivery (OFD) services. Journal or Retailing and Consumer Services. 35, 150-162. https://doi.org/10.1016/j.jretconser.2016.12.013
Zhen, C., Finkelstein, E.A., Karns, S.A., Leibtag, E.S. and Zhang, C. 2019. Scanner Data-Based Panel Price Indexes. American Journal of Agricultural Economics, 101: 311-329.
[1] This article does not focus on web-scraping, but exploit is as a main tool of collecting data from online grocery stores. Web-scraping and its pros and cons are already described by many articles. For example, Jung et al (2021) introduce web-scraping, describe its pros and cons, and utilize it for collecting online grocery data in Korea.
[2] Due to the limitation of spaces, this information is available upon request.
[3] Due to confidentiality, the exact number of revenue information cannot be disclosed. Only the ratio of the estimated revenue over the observed revenue is allowed to be presented in this study.


Sales-Weighted Online Agricultural Commodity Price Index: Using Sales and Price Data web-scraped from Online Grocery Stores in South Korea
ABSTRACT
This study tries to develop a new type of consumer prices index by utilizing price and quantity data of food items collected daily from online grocery stores via web-scrapping, E-CPI. The E-CPI introduced in this study is developed by weighing prices by quantity sold collected for individual items and stores considered in this study. It shows that the prices introduced move closely with the current prices from offline markets with higher frequency such as daily variation. Furthermore, E-CPI weighed by quantity sold presents much closer behavior with the current CPI with such higher frequency. This study contributes to the field of this study in two-fold, 1) authors firstly detect information of quantity sold from online grocery websites, which improve the quality of E-CPI developed based on online prices and 2) publishing E-CPI with daily frequency may further improve usability of CPI information and mitigate a degree of information asymmetry in the grocery markets by allowing the public and consumers to monitor price changes as more frequently as daily.
Keywords: Online Grocery Markets, Price Index, Big Data, Web-Scraping, Consumer Behavior
INTRODUCTION
Over the recent 2 years, inflation has been continuously rising all over the world at an unprecedented rate (Figure 1). This is attributed mainly to supply disruptions, affecting almost all products from energy to food. South Korea is no exception from the recent skyrocketing inflation rate for food as well as other consumer goods (Figure 2.a). Considering that the inflation rate for food has been volatile and increasing within such shorter time period as monthly, weekly or even daily (Figure 2.b), the need for the real-time consumer price index has never been emphasized than nowadays. The current Consumer Price Index (CPI) that Statistics Korea announces is based on prices collected for pre-selected representative food items from particular grocery stores (Statistics Korea, 2022). This is carried out once a month by CPI data collectors from sampled 26,000 brick-and-mortar grocery establishments in 40 of the biggest cities in Korea (Statistics Korea, 2022). Given the process of data collection, the current CPI tends to lag behind at least by two weeks or a month (that is, the CPI for January is released in mid-February at the earliest), limiting the general usefulness of the official CPI as a real-time measure for inflation rate. It is more so for consumers who are non-economists and may also lead to a discrepancy between the released CPI and consumers’ perceived inflation for their grocery baskets.
That being said, an importance of providing an accurate CPI in a real-time manner has been underscored by previous studies that developed high frequency CPI based on scanner data (Zhen et al., 2018), collect daily prices for online micro price data exploiting web-scraping (The Billion Prices Project, 2008) and create an inflation series based on the online data (Cavallo and Rigobon, 2016), or conduct inflation nowcasts using web-scraped online grocery data (Macias et al., 2022). Using scanner data or web-scraped online data improves data quality in methods of more frequent data collection and the larger number of sample products, providing high-frequency prices indexes superior to the standard CPI (Zhen et al., 2018; Cavallo and Rigobon, 2016) or remarkably improving nowcast accuracy (Macias et al., 2022).
Meanwhile, the dramatic rise in e-commerce over COVID-19 also happened in agricultural commodity sales in the online space. The Korean Consumer Behavior Survey for Food shows that online purchase for agricultural products at the household level has increased from 20.4% in 2019 to 27.1% in 2020. In addition, the Korean Online Shopping Trends Statistics shows that agricultural products purchase has increased from KRW3.0 billion (US$2.5 million) in 2018 to KRW6.2 billion (US$5.2 million) in 2020 (Jung et al., 2021; Statistics Korea, 2021). COVID-19 in this case may be a situational factor in driving consumers to initiate online grocery shopping to mitigate potential exposure to the virus (Kvalsvik, 2022; Jensen et al., 2021; Grashius and Skevas, 2021; Hand et al., 2009). In addition, those consumers satisfied with online shopping over the COVID-19 may retain the online shopping behavior after the pandemic subsides (Singh and Söderlund, 2020; Singh, 2019; Yeo et al., 2017). The increased share in online shopping for agricultural products in combination with the increasing food inflation at the fast rate and its volatility has stimulated an interest in estimating a more accurate agricultural and food price index among economists and policymakers.
This study follows the previous studies for developing high-frequency CPI using online data collected by a novel data gathering technique called web-scraping (Macias et al., 2022; Cavallo and Rigobon, 2016; The Billion Prices Project, 2008). Web-scraping is a data collection technique for the automated extraction of information from websites (Jung et al., 2021; Hillen, 2019). It has many advantages in collecting data from online space. First, the data collection process is faster than traditional survey- or panel-based methods considering that web-scraping uses an automated process of amassing data. Second, the data collection cycle is much shorter than survey- or panel-based methods, implemented as in a short cycle as a daily basis, without additional costs. Having said that, the delay in data collection is marginal as prices can be observed, accessed, and obtained remotely at any time on demand. Third, with unlimited access to and ubiquitous availability of online data, researchers do not necessarily incur substantial cost of data gathering, which is often the case with scanner data provided by private firms (Cavallo and Rigobon, 2016). Last but not the least, web-scraping allows researchers to gather additional information such as detailed product information. Web-scraping allows researchers and policymakers to have such a vital statistic of the economy as an online price index in a real-time manner. Although web-scraping has many advantages, however, there is one critical weakness of data scrapping that limits developing web-scrapping-based price indices, the unavailability of sales data from online retailers’ websites.
However, the limitation of developing a web-scraping-based price index is a missing data for sales. The price index is estimated by weighing price based on sales proportion in most of the countries (Statistics Korea, 2022; US BLS, 2020), which is usually unavailable from online grocery stores websites. In addition, online retailers have many unsold or rarely sold items on their websites. In other words, the price index may be seriously biased without sales-based weights. Prior studies suggested various alternative methods to overcome the absence of sales data. For example, Diewert and Fox (2020) suggested a continuous expenditure survey to collect expenditure data with keeping a short price index cycle. Cavallo (2020) suggested using debit card transaction data. Aparacio, Metzman, and Rigobon (2021) utilized Nielson’s Retail Scanner data by restricting the set of matched products as those in the online data and market share of the online retailers. Macias et al., (2022) mentioned that they used official expenditure weights. Nevertheless, these alternative methods merely circumvent the unavailability and still have difficulty addressing the limited access to the online sales data. In other words, utilization of data extracted via web-scraping for estimating price index is highly limited due to the unavailability of online sales data. In particular, the online price index may be more biased for product categories where consumers’ purchasing behavior is expected to be different between online and offline such as fresh items. For example, grocery shopping behaviors may be more different between online and offline compared to other manufactured and durable goods due to the characteristics of food items that is easily perishable or degraded on its delivery and consumers’ preference to touch fresh food items.
In this case study, authors not to circumvent, but find any sources of information offering sales data from the online grocery stores websites so that it would be possible to develop online CPI based on actual sales data. This is the first study that finds a variable from online grocery stores, which represents the number of remaining stocks for individual registered items and estimates sales information by keeping track of the changes of the number of remaining stocks. This can be done by extracting the number of remaining stocks eight times a day. By doing so, nearly population data for online grocery items can be collected, which is another advantage of web-scraping in terms of data quality over scanner data representing around 40% of total expenditures. Thus, we are able to collect novel dataset for the number of sales of each item by exploiting web-scraping.
This case study contributes to the literature in three ways. First, to the best of the authors’ knowledge, this is the novel study that scrapes data of the remaining number of stocks from websites and estimate sales information to create an online agricultural commodity price index. Unlike previous studies which suggested linking alternative expenditure data, in this study, we have shown that such data can be collected through web-scraping techniques, providing exact information for estimating price index. Second, more frequent CPI and daily price information can be used to reduce degrees of information asymmetry among consumers. What this study is trying to do may be a pathway to transparent information sharing of prices of grocery items. Last but not the least, this study used natural language processing to automate the product classification process. It has automated the collection and filtering process using natural language processing. This study demonstrates a structure for empirical use of web-scraping data.
PROCEDURE OF DATA COLLECTION AND ANALYSIS
This study consists of three steps: 1) web-scraping of product information (what commodity, methods and degrees of food processing, weights, a growing method such as organic, etc.), price, and the number of remaining stocks through web-scraping; 2) data processing (estimation of sales, product classification, weight information for estimating unit prices); and 3) calculation of weighted price index at the agricultural product level. Figure 3 illustrates these steps.
Web-scraping of product information
Web-scraping is an online data collection technique. It is commonly used to extract data from websites, and some studies already tried to collect prices of agricultural commodities through web-scrapping (Macias et al., 2022; Cavallo and Rigobon, 2016; The Billion Prices Project, 2008). Web-scraping is, therefore, a more efficient way to collect data from websites with lower cost.[2]
On the first step, web-scraping is performed from 15 major online retailer websites for products of four main agricultural commodities in South Korea: garlic, onion, potato, and egg. The 15 online retailer websites were selected based on their market size and accessibility. The 15 online retailer covers about 95% of in-app purchase (IGAWorks, 2021). Thus, data amassed from the 15 online retailers covers most of the online retailer data, rendering a calculated weighted price a potentially reliable and representative source of price and quantity information. Data scrapping process is conducted eight times a day to track changes of the number of remaining stocks to estimate the quantity sold over the period of 6 months from November 2021 to April 2022. In addition, we validate the data by comparing it with the actual revenue provided from online retailers and confirm that the difference in revenue between web-scraped data and online retailer data is ignorable.
Through the web-scraping technique, this study collected product information, like product title, price, inventory quantity, and discount information. More specifically, this study collected the top 1,000 sold items for each product on 15 websites due to speed issues. It is not expected that one cycle of scrapping should not be overlapped with the next one after three hours. The top 1,000 sold products cover over 94% of the total items sold. For several websites with sales information provided on its screens, we collected both the inventory behind the websites and disclosed sales numbers for comparison. This further validates our approach of collecting the stock information for estimating sales numbers.
Data processing of product information
After the collection, we process the web-scraping data, which is stacked around 0.2 million products in a day. This step consists of three parts: 1) sales estimation; 2) product classification; and 3) weight identification. We first estimate sales volume by calculating differences in the inventory number by three hours. In the case of inventory update with a sudden rise of the number, average sales volume at the same time period from the previous two weeks was used to fill the point of inventory update. In this step, items without sales are removed. Considering most of purchases in online retailing websites happen from a few popular products, almost 90% registered products are removed.
We then perform Recurrent Neural Networks (RNN) based deep learning technique to perform text classification. The retail websites have many items with misclassified categories. For example, Xiaomi, which is considered one of the largest electronic companies, is occasionally classified as rice because of its meaning. Thus, this study builds a text classification model based on RNN. Out of various specific deep learning approaches, Long Short-Term Memory (LSTM) based text classification model is utilized. To train the model, more than 3,000 randomly selected products data for each agricultural commodity were used. The text classification model shows over 95% of accuracy. In addition, the manual test by using newly collected product titles and options shows over 90% of accuracy. Through this step, miscategorized or irrelevant items can be removed.
In the last part, this study identifies the weights of each product using natural language processing techniques. Natural language processing allows separating the product titles and options into morpheme units. From the tokenized word lists, the number before the word of weight units, like kg or g, is identified as the weight information.
Calculation of price index
Such detailed information extracted and organized from deep learning and natural language processing enables us to calculate the weighted prices index based on estimated sales and weights. We use the Laspeyres index formula, which is the same way as the Korean official price index calculation.
ANALYSIS OF ONLINE CONSUMER PRICE INDEX
Data collected by web-scraping
Based on the data collected, the total number of registered products are around 11,890,000; around 2,660,000 registered products of eggs, 4,200,000 registered products of potatoes, 2,880,000 registered products of garlics, and 2,140,000 registered products of onions (Table 1). Of all the products registered and collected, around 5% are actually sold (Table1). In addition, fresh food malls that specialize in grocery items shows higher proportion of purchased products over 10% for some malls. Open markets have lower proportion of purchased items albeit the largest number of registered products (Figures 4, 5, 6).[3]
Data validation
While this study collects the number of remaining stocks from websites, there is one issue in collecting such information. Does the variable represent the absolute number of remaining stocks or something else such as index? Although the variable changes and is updated exactly by the same amount of item purchased from the experiment that this study conducts, it is still a question worth asking because it is directly related to the data validation and analysis quality. For validating the quantity data collected, Korea Rural Economic Institute requested the cooperation of such online retailers in providing monthly revenue from online sales for corresponding items. As a result of comparing revenue from scrapped data (estimated revenue) and provided data (observed revenue), both revenues coincide by from 70% to 100% depending on items and retailers.[3] With that said, authors decided to use the quantity data collected by using the variables of the websites.
Analysis of CPI
For it is expected that heavier (lighter) products have lower (higher) unit price, scrapped products are sorted into different group of weights after extracting weight information from the titles. For onions, weights are cut at 1kg, 5kg, and above. Garlics are cut at 1kg, 2kg and above. When it gets to potato which is usually heavier than onions and garlics, weights are cut at 5kg, 10kg, and above. Eggs are categorized into 10 EA, 20 EA, and above. Figure 4 illustrates that unit price (KRW/kg or KRW/EA) of individual items increases as weight of products decreases as is expected. For example, small packaged onion products less than 1kg present prices around KRW4,500/kg while big packages goods heavier than 5kg show KRW1,500/kg, one third of the small packaged products.
When it comes to garlic products, in South Korea, the unit of measuring weight is still traditional such as a one certain bucket size regardless of physical size of garlic on online grocery stores. One single bucket is equivalent to 8kg and this study converts the unit of a bucket into kg. As is the case of onions, the larger the products, the lower the unit prices are (Figure 4). The patterns are shown to be the same for other items such as potatoes and eggs (Figure 4).
E-CPI of individual items
Validating the quantity sold data and daily variations of unit prices for individual products, usefulness and applicability of the suggested E-CPI are examined by comparing it to the existing CPI. As CPI is calculated by applying Laspeyres index for weighted average price, so is E-CPI with quantity sold collected for individual items sold online (Figure 5). Trend of the E-CPI is moving closely with the existing CPI very well with daily variations added over the 6 months period of interest. The closeness in trends of the two price indices suggests that E-CPI weighted by quantity sold in online grocery malls can be a useful resource and provision of daily variations of prices (Figure 4) and E-CPI (Figure 5) may enhance quality and usefulness of prices index information not only for economists and/or policymakers, but also for the general public. The existing CPI does not provide daily variations of prices and related index, which limits usefulness of the index.
In addition, compared to online data collection scrapping all the registered products on the online grocery websites, the existing CPI exploits prices of the sample products. Considering a wide distribution of the prices across product varieties based on horizontal/vertical product differentiation, sellers, and/or brands of the same food items (Figure 6), utilizing prices of several sample products may bring a certain level of bias to the price information. Given such advanced data collecting techniques available as web-scrapping which enables obtaining datasets close to a population data for price and quantity in a higher frequency and a lower cost, this study suggests online data scrapped would provide more detailed information, improving usefulness and applicability of E-CPI as a partial complement to the existing CPI. Last but not the least, as is reported by Jung et al., (2021), quantity information collected from online retailers may share more insightful information about consumers’ behavior in online spaces such as purchasing patterns over a week. Furthermore, the online datasets when used properly may expand research work in price forecasting and support monetary policymakers. For example, as Macias et al., (2022) conducts, daily prices may make it possible to nowcast rather than forecast food price, which helps monetary policymakers to make more immediate confrontation on such rapidly changing matters as the recent rise in inflation.
However, the suggested approach is not without limitations. This study considers only four representative food items. Having said that, more extensive food items and other goods included in calculating CPI should be examined to further the level of understanding and finding usefulness of the datasets collected from online retailers by web-scrapping.
A CASE OF UTILIZING ONLINE GROCERY DATA FOR INFORMATION SYMMETRY
Dashboard for monitoring grocery prices
Extensive data collection via web-scraping has already been utilized for purposes of enhancing information symmetry in combination with data visualization. One major benefit of collecting data from online space via web-scrapping is that it allows the public to monitor price information in a real-time manner, which may alleviate a degree of information asymmetry in the whole economy. This study introduces one exemplary use of web-scraping and data visualization of the online grocery markets in the U.S. Center for Food Demand Analysis and Sustainability at Purdue University publishes interactive dashboards for cost estimates of grocery baskets for thanksgiving (Figure 7, https://ag.purdue.edu/cfdas/resource-library/the-cost-of-a-thanksgiving-meal/) and cheeseburger (Figure 8, https://ag.purdue.edu/cfdas/resource-library/cost-of-a-cheeseburger/) (Jung, Subramaniam, and Lusk, 2022). This is based on data collected daily via web-scrapping from 20 grocery stores across 342 Zip codes over 47 states in the US, counting upon the permission of grocery stores for data mining from its websites. The dashboard provides cost of grocery baskets and individual items that the baskets contain in each state updated daily, which allows consumers to compare cost over time and states. This daily monitoring of prices has another benefit over the present CPI. The consumers do not utilize CPI for their grocery shopping because of the misalignment in time between collection of price data and its publication. CPI announced today is usually based on prices of food items 2 weeks ago at least. Given the fast-changing environment of the world economy, web-scrapping is expected to provide price information for the public and/or consumers in a timelier manner. This may be more so when it comes to such a seasonal dinner table plan as Thanksgiving.
Considering that consumers do not have access to the information on their own while private firms/companies are already utilizing web-scrapping for their marketing or strategic purposes, provision of the similar information by government or non-profit organization such as research centers may improve market efficiency in the nearby big data era.
CONCLUSION
Utilizing novel big data analytic techniques, web-scraping for collecting online grocery data and machine learning for text mining, we amass such a novel grocery store big data that contains detailed product information such as prices, the number of stocks, methods of food process, packages based on different weights, methods of farming such as conventional or organic, etc. The main contribution of this study in comparison to previous studies in this field of research is that we provide sales data for individual items estimated by closely monitoring changes in the number of stocks from the grocery store websites eight times a day. The sales data collected allows development of online food price indices with direct expenditure weight.
This study develops price indices for four main agricultural commodities in Korea for the first time. The results show that individual food price and its indices move closely with the official CPI with such a higher frequency as daily-basis provided when the prices are weighed by sales data scrapped.
Validating quality of the web-scrapped data from online grocery stores, the dataset in this study which is for more specified products and granular frequency will be more useful for the future research not only for developing or estimating the associated measurement such as online CPI, but also for estimating price elasticity of online grocery demand for individual items and/or nowcasting food inflation rate in real-time over a challenging period such as COVID-19 and/or under the more recent supply chain disruptions. In addition, the real-time online datasets may support monetary policymakers in dealing with more immediate instances with rapidly increasing inflation.
REFERENCES
Aparicio, D. Metzman, Z., and Rigobon, R. 2021. The Pricing Strategies of Online Grocery Retailers. National Bureau of Economic Research. Working paper: 28639. Available at https://www.nber.org/papers/w28639
Billion Prices Project. 2008. The Billion Prices Project. Available at http://www.thebillionpricesproject.com/
Cavallo, A. and Rigobon, R. 2016. The Billion Prices Project: Using Online Prices for Measurement and Research. Journal of Economic Perspectives. 30 (2): 151-78.
Cavallo. 2020. Inflation with Covid Consumption Baskets. National Bureau of Economic Research. Working paper: 27352. Available at https://www.nber.org/papers/w27352
Diewert, E. and Fox, K. 2020. Measuring Real Consumption and CPI Bias under Lockdown Conditions. National Bureau of Economic Research. Working paper: 27144. Available at https://www.nber.org/papers/w27144
Grashius, J. and T. Skevas. 2020. “Grocery Shopping Preferences During the COVID-19 Pandemic.” Sustainability 12, 5369 (2020). http://dx.doi.org/10.3390/su12135369
Hand, C., Riley, F. D., Harris, P., Singh, J., and Rettie, R. 2009. Online grocery shopping: the influence of situational factors. European Journal of Marketing. 40(9/10), 1205-1218. Available from https://doi.org/10.1108/03090560910976447
Hillen, J. 2019. Web scraping for food price research. British Food Journal. 121(12), 3350-3361.
IGAWorks. 2021. Mobileindex Insight, accessed October 30, 2021
Jensen, K. L., Yenerall, J., Chen, X., and Yu, T. E. 2021. US Consumers’ Online Shopping Behavior and Intentions During and After the COVID-19 Pandemic. Journal of Agricultural and Applied Economics. 53. 416-434. Available from https://doi.org/10.1017/aae.2021.15
Jung, J., Subramaniam, and Lusk, J. L. 2022. How the Cost of a Cheeseburger Stacks Up in Every State. Center for Food Demand Analysis. Available at https://ag.purdue.edu/cfdas/resource-library/cost-of-a-cheeseburger/
Jung, J., Subramaniam, and Lusk, J. L. 2022. The Cost of a Thanksgiving Meal. Center for Food Demand Analysis. Available at https://ag.purdue.edu/cfdas/resource-library/the-cost-of-a-thanksgiving-meal/
Jung, J., Kim, Y., and Kim, S. 2021. What does web-scraping tell us about online grocery markets? A case study in South Korea. Food and Fertilizer Technology Center for the Asian and Pacific Regions. Available at https://ap.fftc.org.tw/article/2910
Kvalsvik, F. 2022. Understanding the role of situational factors on online grocery shopping among older adults. Journal of Retailing and Consumer Services. 68, 103009. Available from https://doi.org/10.1016/j.jretconser.2022.103009
Macias, P. Stelmasiak, D., and Szafranek, K. 2022. Nowcasting Food Inflation with a Massive Amount of Online Prices. International Journal of Forecasting. In Press. Available at https://doi.org/10.1016/j.ijforecast.2022.02.007
Singh, R. 2019. Why do online grocery shoppers switch or stay? An exploratory analysis of consumers’ response to online grocery shopping experience. International Journal of Retail & Distribution Management. 47(12). 1300-1317. https://doi.org/10.1108/IJRDM-10-2018-0224
Singh, R. and Söderlund, M. 2020. Extending the experience construct: an examination of online grocery shopping. European Journal of Marketing. 54(10), 2419-2446. https://doi.org/10.1108/EJM-06-2019-0536
Statistics Korea. 2022. Consumer Price Index. Available at http://kostat.go.kr/incomeNcpi/cpi/index.action
U.S. Bureau of Labor Statistics. 2020. Consumer Price Index: Calculation, Handbook of Methods. Available at https://www.bls.gov/opub/hom/cpi/calculation.htm
Yeo, VCS., Goh, S-K., and Rezaei, S. 2017. Consumer experiences, attitude and behavioral intention toward online food delivery (OFD) services. Journal or Retailing and Consumer Services. 35, 150-162. https://doi.org/10.1016/j.jretconser.2016.12.013
Zhen, C., Finkelstein, E.A., Karns, S.A., Leibtag, E.S. and Zhang, C. 2019. Scanner Data-Based Panel Price Indexes. American Journal of Agricultural Economics, 101: 311-329.
[1] This article does not focus on web-scraping, but exploit is as a main tool of collecting data from online grocery stores. Web-scraping and its pros and cons are already described by many articles. For example, Jung et al (2021) introduce web-scraping, describe its pros and cons, and utilize it for collecting online grocery data in Korea.
[2] Due to the limitation of spaces, this information is available upon request.
[3] Due to confidentiality, the exact number of revenue information cannot be disclosed. Only the ratio of the estimated revenue over the observed revenue is allowed to be presented in this study.