ABSTRACT
This study conducts analysis of online grocery markets by exploiting Web scraping and examines advantages and limitations of Web scraping for online market studies. On one hand, findings report that daily price variation appropriately reflects actual aspects of market situation, price dispersion between online and offline markets, across individual online grocers, and between online big retailers and open markets. On the other hand, sales information presents daily shopping patterns over the week, sales composition of degrees of process and different weights of products on sale. This information provides useful information not only for researchers to understand online grocery industry, but also for consumers to compare unit prices across online grocers and for producers to consider for their online direct marketing activities. In addition, advantages and limitations of Web scraping are also described based on the analyses conducted. At the moment of increasing trend of online grocery shopping even for fresh food items, this research provides useful information about online grocery markets as well as usage of Web scraping for data collection so that researchers on food market research may be informed about the data collecting techniques and its usefulness.
Keywords: Big Data, Web-Scraping, Online Grocery Markets, Consumer Behavior, Online Retailers
INTRODUCTION
Online grocery markets
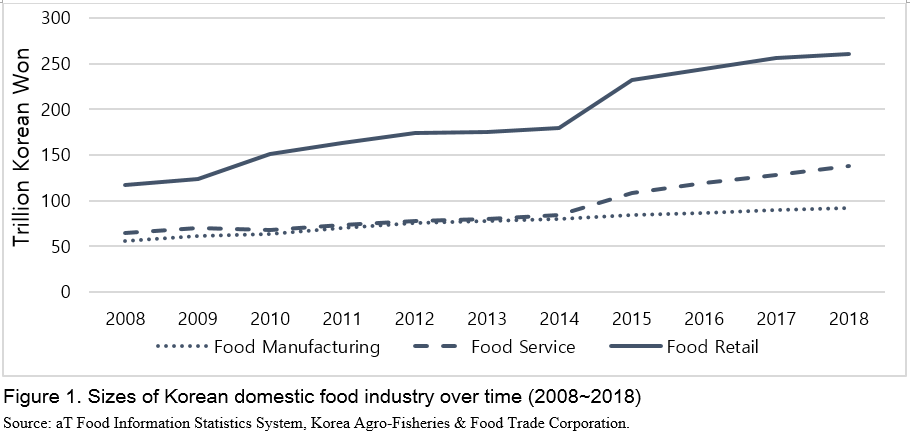
Food industry in South Korea has been growing from a decade starting from 2008 to 2018, mostly driven by food retail and food service. While food manufacturing increased by 4.5% on annual average from 2015 (KRW 84 trillion, USD 71 billion) to 2018 (KRW 92 trillion, USD 79 billion), food retail and food service grew on annual average by 10.31% (from KRW 232 to 261 trillion, from USD 198 to 223 billion) and 13.6% (from KRW 108 to 138 trillion, from USD 92 to 118 billion), respectively (Figure 1). Compared to the previous period from 2008 to 2014, the growing trend seems to be more apparent recently from 2015 to 2018.
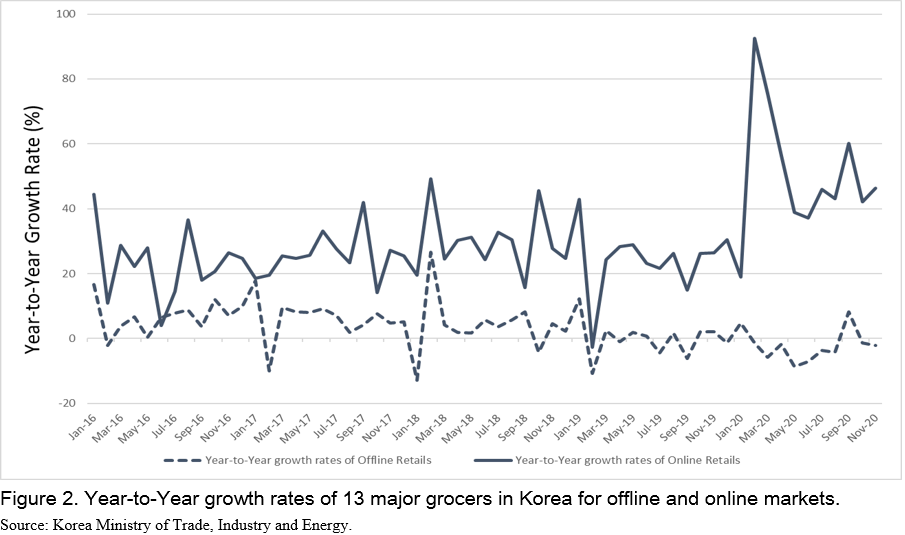
The expansion of food retail and service industries may be highly related to a growth of online grocery shopping, which is a new shopping trend. Figure 2 shows year-to-year monthly growth rates of 13 major retailers in Korea both in offline and online markets from 2016 to 2018. It is indicated that sometimes, the average growth rate of 13 offline retailers continues to decrease with negative magnitudes. On the other hand, the average growth rate of 13 online retailers stays at positive level consistently over the same period (Figure 2)
The online shopping has already been increasing before COVID-19 with the advent of Millennials familiar with the Internet access and the rise of one-person households. Furthermore, it has become more evident that more people move on to online space for their groceries as well as non-food items since social distancing was brought about by the COVID-19 pandemic and this reduced the number of visits to the brick and mortar grocery stores. According to the data of Online Shopping Trend by Statistics Korea (2020), agricultural products and food retail industries accounted for 25.6% of the total online shopping in 4Q, 2020, and increased by 6.5% from 19.1% in 4Q, 2019. Considering that it increased by 3.4% from 4Q, 2018 to 2019, it is of no doubt that COVID-19 pandemic has triggered the movement of consumers from offline to online.
COVID-19 not only took consumers to online spaces for shopping temporarily but also intrigued them for online grocery shopping experience. For example, it is expected that increased experience in online grocery shopping, expansion of meal kits and food deliveries, in combination with innovative technologies in logistics and fulfillment center for fresh food based on AI, machine learning, and big data analytics, may keep consumers in online space for their groceries after the COVID-19 comes to an end. This would be more so for the middle-aged consumers, a main consumer group of grocery shopping. Although consumers around 40s are used to be reluctant to purchase fresh food items online, the COVID-19 took them to online grocery markets inducing positive experiences in online grocery shopping (Song, 2020). In addition, Choi et al. (2018) surveyed consumers on their online shopping experiences for fresh food and 28.1% of them responded that they are willing to expand their online shopping with 60.4% of consumers keeping their level of online shopping in the future.
With that said, it is expected that online grocery shopping will continue to grow gradually in the post-COVID-19 era.
Transition to online retails in agricultural and food industries brings convenient shopping experience to consumers. There is also an observed improvement in efficiency to food supply chains and more opportunities of direct marketing to producers, and so on. Notwithstanding, online grocery industry entails many issues that have yet been examined. For example, there is antitrust of monopolizing/oligopolizing online platforms, information asymmetry between retailers and consumers, food safety for delivery, and environmental issues. In addition, agricultural producers willing to participate in direct marketing activities via online platforms need such information like retail prices, products attributes that meet consumers' needs, and characteristics of online retail stores. In order to investigate the issues, it is necessary to first grasp the status of online grocery markets such as market structure for sizes and shares, market information inclusive of unit prices, quantity sold, and etc. before delving into each of the issues. However, this has not been done so far due to unavailability of disaggregated data for online grocery markets at the retailer level.
Online Shopping Trend from the Statistics Korea provides information about status of online shopping in Korea based on revenue data collected from online retailers. For instance, growth rates, proportion of product categories, and so forth. However, it aggregates revenue up to product categories such as electronics, household goods, sports, service, agricultural produce, food and groceries, and food service across all retailers. Due to the aggregation, ability to analyze online retail markets by specific items and retail channels are highly limited. Moreover, this limitation of analysis might make it impossible to deal with issues involved with rapid development of online shopping mentioned above so far.
Big data for online space
Meanwhile, the Big Data industry has been rapidly growing recently, which induces development of data collecting techniques and enhances access to such techniques of non-computer scientists. Web scraping is a relatively new method of collecting data, which allows users to extract specific information such as prices by accessing websites and its HTML code structure. Although the technique has been utilized in various areas such as marketing, industrial organization, or inflation measurement, it has drawn little attention from online grocery industries. If Web scraping is applied for online grocers, it will become possible to collect information such as product names inclusive of weights and level of process, prices, quantity sold, and ratings. This can be done by each specific item and retailer of interest, which enables to provide such specified information for each item registered on online retailers' websites on a daily basis. This information can contribute to making the online grocery markets competitive by tackling information asymmetry in the industries.
By conducting the case study of analyzing Korean online grocery markets with Web scraping, this study examines the possibility and limitation of utilizing Web scraping as a means for research on online food industries. That said, this study has three main objectives: (1) introduce Web scraping, (2) analyze online grocery markets in Korea by channels and products based on the data collected by exploiting Web scraping, and (3) suggest values and limitations of Web scraping in online food research.
ABOUT WEB SCRAPING
Definition[1]
Web scraping (screen scraping) is an automated method of collecting online data which extract information exposed on screen of a certain website. For example, information on screen or from its corresponding HTML code can be scraped with the methods, downloaded, and stored in a data format.
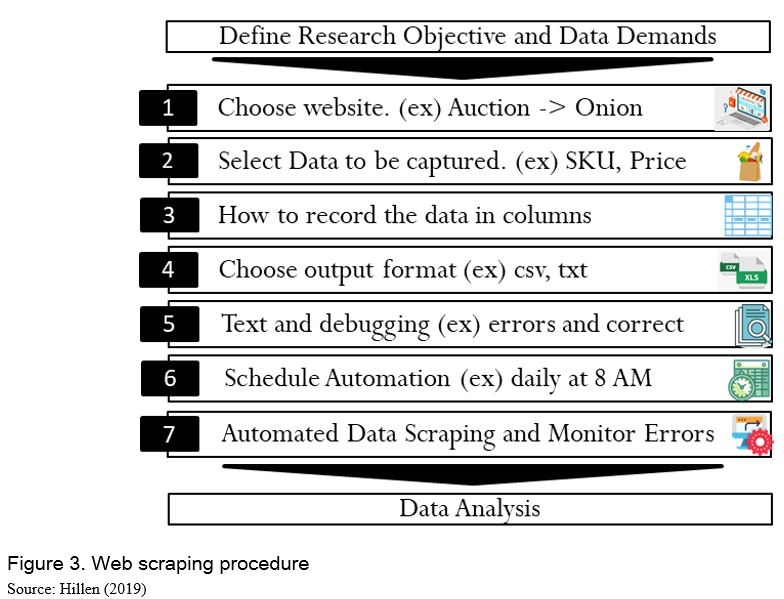
When it comes to technical procedure of collecting data, an intuitive description of how Web scraping can be implemented will be provided. Basically, Web scraping imitates an online shopper who navigates websites and extract pre-defined information. Figure 3 gives a schematic overview of developing a Web scraper. This can be coded in most common languages such as Python or R, which provide pre-programmed libraries. In the sense that a Web scraper actually navigates websites and draw information from the HTML of the websites, Web scraping is failure-prone techniques to changes of the websites, HTML code, and product classification. Therefore, consistent monitoring and continuous updates of a Web scraper is necessary/required.
Advantages and Limitations
Advantages
Web scraping has lots of advantages over traditional data collecting methods and helps overcome limitations of the traditional data sources such as official prices index or scanner data.
As the value of data is rising, datasets become more expensive. In particular, disaggregated dataset at levels of retail, products, and daily basis is expensive. On the other hand, collecting data online by Web scraping is basically free and related cost includes time required to write the code and test it, and electricity once the code is executed. Considering scales and sizes of the data, according to Cavallo (2018), marginal cost is decreasing with observation approaching to zero.
- Frequent, real-time sampling
Frequency of collecting data is totally up to the user whether it should be run once or several times a day. For food price research, daily data would probably be sufficient to see price dynamics. Of course, the higher the sampling frequency is, the more detailed analysis could be done with price dynamics. However, users should optimize frequency and data quality depending on main purpose of each research. Furthermore, because Web scraping extracts data in real-time, information is given at the moment of collecting without any delay. This can contribute to improvement in research analyzing recent events, policy changes, forecasting, and consumer price index computation.
- Product range and details
Most official statistics collect data such as consumer price based on widely defined sample products or products categories. Detailed information for food research such as weight, brand, and kinds of process is not generally unavailable. Web scraping enables users or researchers to collect this specific information for each precise products from individual websites. Researchers can aggregate the disaggregate data up to a certain level they need whenever it is necessary.
- Customization and transparency
While scanner data or consumer price index provide very reliable and well-organized data, it does not necessarily contain all the information that researchers ideally need for their analysis. It is probably a case that data are highly aggregated, not available for product by product, for retailers of interest, resulting in limitation of specific analysis. Web scraping allows to create datasets for targeted products, retailers, and locations for pre-determined information. This will improve transparency of datasets by removing omitted variables or hidden black box for estimation procedure required for datasets with samples.
Limitations
- No historic data available
While Web scraping has an advantage of collecting real-time data, it implies that one needs to start data collection as early as possible so that sufficiently long time-series data becomes available from the first day. This is a critical drawback built for Web scraping by nature.
- Too big and morphological analysis needed
Considering the minimal cost of Web scraping, it is tempting for users to collect a literally Big Data more than what is needed. This is consistent with a potential risk that users stack explosively huge size of data beyond the amount that is actually needed. In addition, 85% of Big Data generated recently is unstructured data (De Boe, 2014; Eberendu, 2016) and morphological analysis should be conducted to further extract specified information. Burden of analyzing Big Data will be heavier with bigger datasets and this can be more so when data collection is not well-designed in advance, resulting in too big datasets with meaningless information for inappropriate products.
- No transaction data available
Another critical limitation is that transaction data is not available for individual consumers. This is mainly due to only exposed information is available for being scraped while transaction information is not (Hillen, 2019). This is more likely an issue of online data exposed to website screen rather than Web scraping itself. If the information of quantity sold for individual products registered is shown on screen or users can detect such information in HTML code of websites, transaction data may be possibly extracted, enabling to conduct more research such as consumer’s price elasticity of demand.
Application in this research
Data collection in the original study targets two products, garlic and onion, for product names, prices, quantity sold, ratings and the number of reviews, registered for sale in 7 online grocery stores over March through May, 2021. Since this is a case study which examines usability of Web scraping for online food research and figure out what information can be extracted by the method, two food items, garlic and onion with high price variability, consumers' intention to purchase online again, and being relatively storable are selected.
ANALYSIS OF ONLINE GROCERY MARKETS
The original study examines the two products over 7 online grocery stores over March through May, 2021. However, due to the length and the main purposes of this paper, some meaningful results are presented. There are two major parts of the results, analyses of (1) prices and (2) sales. Seven online grocers are again divided into two categories; (1) big retailers (BR#) equivalent to Walmart or Krogers in the US and (2) Open markets (OM#) equivalent to Ebay and Amazon in the US on which any sellers can post their products for sales.
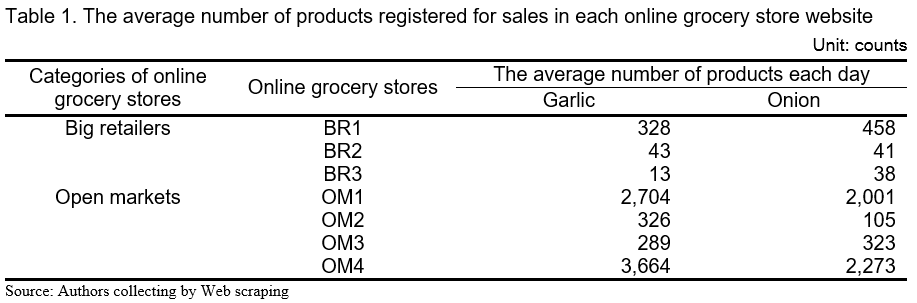
Before delving into detailed analyses results, the average number of products registered are presented in Table 1. One noticeable difference between big retailers and open markets are the number of items registered. Open markets have a lot more items registered than there are on big retailers' websites. This may be because it is possible for anyone licensed for business to post their items for sales on open markets websites.
Price analysis
Price analysis has two important implications in food retail research. First it provides unit prices for consumers to compare prices across retailers, increasing consumer surplus by reducing information symmetry. Second, unit price information supports producers willing to sell their products via direct marketing on online retail websites. Because they have hard time figuring out relevant retail prices for marketing activities, rendering unit price information public would help their direct marketing activities.
Daily variation
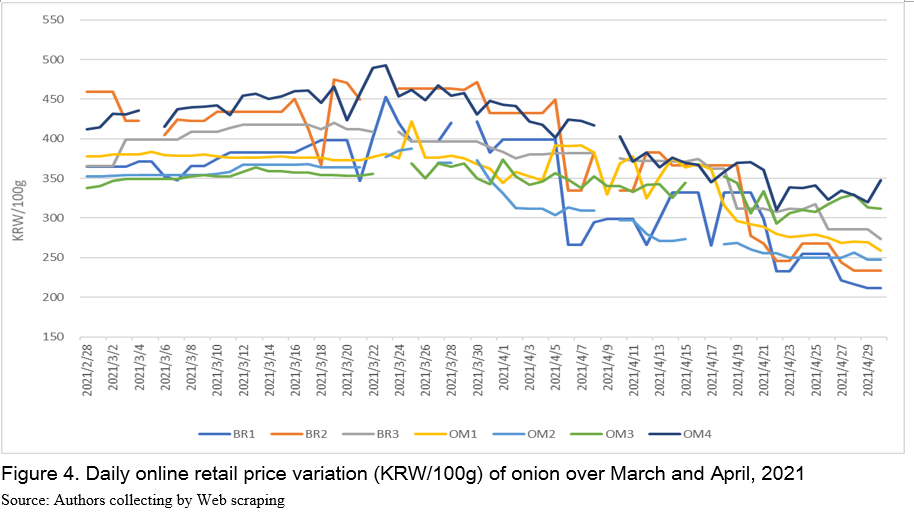
Average unit price of onions in March is KRW 396/100g (USD 0.34/100g) gradually increasing. Price movement over time varies across channels (Figure 4). For example, most retailers show large variations and prices from OM3 and BR1, BR2, and OM4 vary more largely than others (Figure 4). Figure 4 shows that prices decrease over the month of April with the monthly average price of KRW 327/100g (USD 0.27/100g). This may reflect the fact that April is a season of harvesting onions. Sellers may try to remove their onions by reducing prices. According to KREI's outlook report, prices of onion over April, 2021 are expected to decrease due to a slight overproduction of onion (KREI, 2021). This indirectly validates the quality of Web scraped data from online grocery stores.
Comparison of price between online and offline
Comparison of retail prices across online and offline stores are important in the sense that they go through different supply chains. Since individual channels go through different supply chains and marketing activities may be different, prices in each market are expected to be different. Figure 5 illustrates that price in online spaces is higher than offline markets for both high quality and lower quality onion products. This suggests that online retailers may have different pricing strategies reflecting consumers' price elasticity of demand, willingness to pay, delivery cost, and etc. This needs future research for heterogeneity of prices across online and offline markets and pricing strategies of online grocers.
Comparison of price across channels
Prices are also expected to be dispersed across seller categories: big retailers vs open markets due to heterogeneity of marketing cost, supply chains, and product qualities. Average price of big retailers, KRW 367/100g (USD 0.31/100g), is higher than the one in open markets, KRW 358/100g (USD 0.30/100g) (Figure 6). This may be due to higher marketing cost of big retailers and usually higher quality, but this information is not available publicly. Prices of big retailers in April sometimes fall below prices of open markets and this may be because big retailers try to sell off its onions at lower prices over the harvesting season. Besides, prices of big retailers and open markets are generally higher than retail prices of high-quality onions in offline retail markets.
Another interesting feature of the price dispersion is that prices received on open markets are higher than wholesale prices. For example, average price of open markets, KRW 358/100g (USD 0.31/100g), is higher than wholesale prices, KRW 156/100g (USD 0.13/100g) (Figure 7). What catches our attention is that wholesale prices plummeted over April by 55% due to higher production while prices of open markets decreased only by 31%. It suggests that producers may have received higher price than they would have earned if they supply their onion to the wholesale markets.
Sales Analysis
Sales analysis based on scraped data provides interesting aspects of online grocers especially to producers. It will contain sales pattern over the week, composition of products by degrees of process and weight. This will give useful information supporting producers online marketing activities. Among studies on food research using Web scraping, this work is the first making it successfully extract quantity sold data.
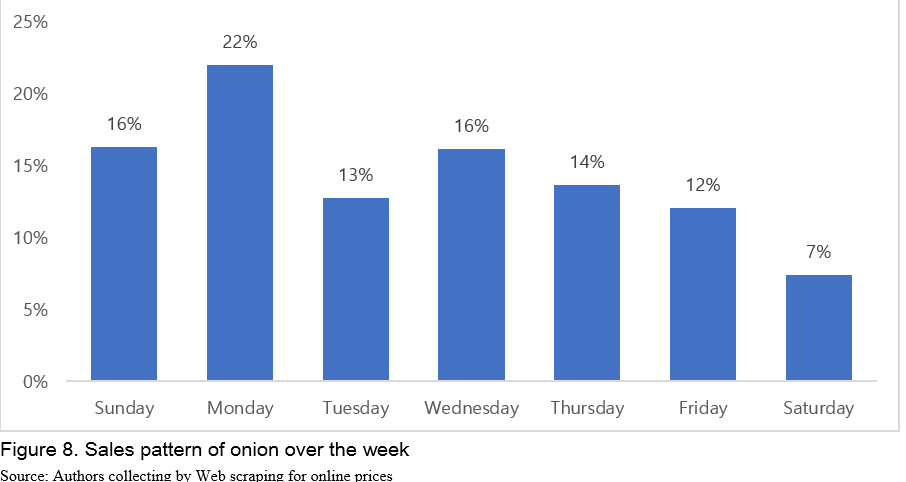
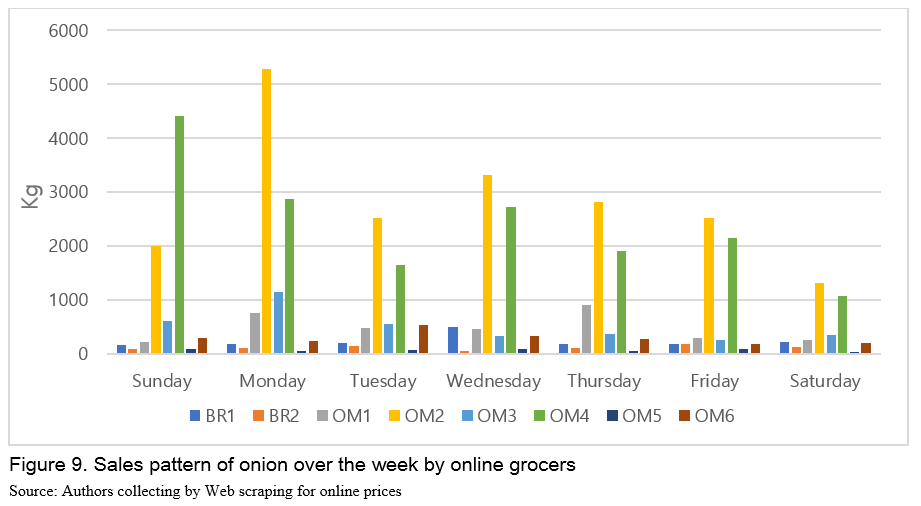
Daily sales pattern
Twenty-two percent (22%) of the total weekly sales happens on Monday, gradually decreases to 7% until Saturday, then rebounds to 16% on Sunday (Figure 8 and 9). This is consistent with typical shopping patterns that Monday shows high sales, decaying over the week until Saturday, jump back on Sunday (Hyundai Card and Ebay Korea, 2016; Joongang Daily, 2016; Criteo, 2018). This may also indirectly confirm validity of online data.
This online shopping behavior is contrary to offline shopping behavior. According to the trend analysis of Shinhan Card (2016), consumers actually go out for shopping over the weekends resulting in an increase in offline shopping. On the other hand, they begin online shopping on Sunday night that they procrastinate over the weekend and continue to do it until Monday morning. In particular, consumers have a closer look at the real products over the weekend at the offline grocery stores and place an order via online retail stores. Innovative logistics in Korea that delivers products on early days of the week may attract consumers to shop even fresh food online.
Quantity sold across channels by level of food process
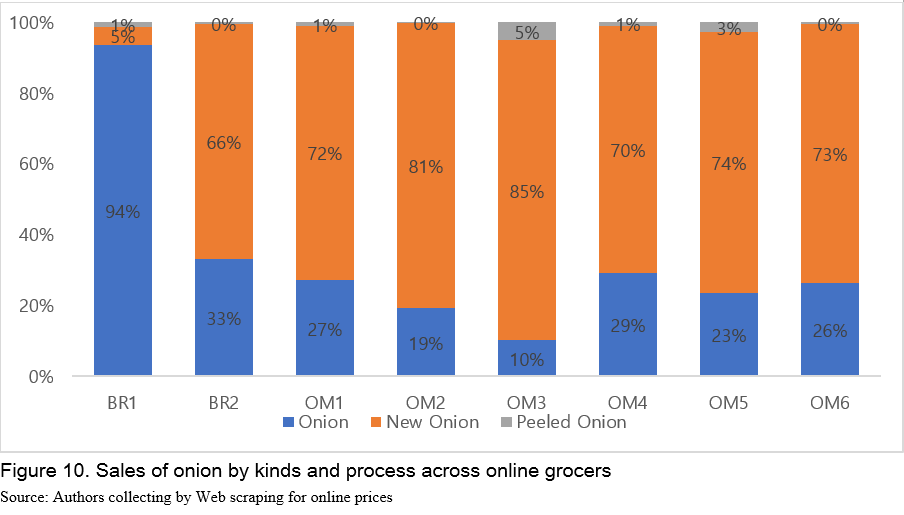
Every online store but BR1 (Big Retailer 1) shows its highest sales from New Onion. New Onion here means onions that are harvested this year (Figure 10). This may be related to channel attributes or consumers shopping behaviors. But it is hard to draw any meaningful insight with Web scraping data for this. Nonetheless, this information is reported to describe what information that data collected with Web scraping can provide.
Quantity sold across channels by weight
When it comes to sales by weight across online grocers, big retailers and open markets are largely different in weights. As illustrated in Figure 11, lightly weighted products less than 3 Kg account for more than 60% of big retailers’ total sales while heavy products over 3 Kg or even 10 Kg account for around 60% of the total sales of open markets. Based on this, it may suggest that a large portion of onions from big retailers is purchased by households. On the other hand, small restaurants may buy ingredients via open markets. Considering transportation cost for delivering ingredients from wholesale markets, this may be the case that small restaurants use open markets as a source of supplying its ingredients. Lee et al. (2020) reports that 7% of the whole restaurants order ingredients via online markets, supporting findings of this study.
CONCLUSION
With an increasing trend of online grocery shopping in Korea particularly during the COVID-19 pandemic, positive and negative externalities have appeared and understanding the online grocery industry has never been promising and emphasized. For investigating online grocery industry, this study introduces online data collecting technique, Web scraping, and conduct a case study of examining online grocery markets in Korea with data collected by the technique.
Online data collected by utilizing Web scraping in this study provides new information about online grocery markets such as unit price, quantity sold, weights, level of process, etc. on a daily basis. Unit price reflects actual market aspects such as overproduction of onion and downward movements of its price, which indirectly confirms validity of data collected. It also provides such useful information for consumers to compare unit prices across websites and for farmers to refer to for their direct marketing via online grocery platforms. In addition, online prices are on average higher than offline prices and this is more so for big retailers than open markets.
Quantity sold data also presents useful information such as daily sales over the week, proportion of sales across level of process and different sizes of products registered for sale. This may support producers' strategic behavior when they post their products online platforms. For example, they try to make their item heavier if they want to sell it on open markets. In addition, producers may be able to process their fresh products at a certain level to sell more of them. Levels of process may vary across online market categories from big retailers to open markets. Last but not least, if they post their products in early days of the week, it may raise possibility of being sold because consumers are more likely to shop online across earlier period.
Online data collected with Web scraping provides useful information that has not been available so far. However, this is not without limitation. Typical drawbacks of Web scraping such as unavailability of transaction data and/or specific information of products still remain to be resolved. This may be overcome by more improved codes of Web scraping or by being supplemented by other data sourced from scanner data or so. Nonetheless, Web scraping can be utilized to collect online data to understand market structure, daily prices, grocers' attributes, and consumers' shopping behavior. The data may not only be independently used for analyses, but also be added to data collected by traditional methods. This is totally up to its users and purposes of individual research projects.
REFERENCES
aT Food Information Statistics System, Korea Agro-Fisheries & Food Trade Corporation.
Cavallo, A. 2018. Scraped data and sticky prices. Review of Economics and Statistics. 100(1), 105-119.
Choi, J., Park, K., Choi, J., Lee. D. 2018. Status of online marketing of agricultural products. Korea Rural Economic Institute.
De Boe, B. 2014. Use Cases for Unstructured Data – Intersystems of White Paper. Intersystems Corporation.
Eberebdu, A. C. 2016. Unstructured Data: an Overview of the Data of Big Data. International Journal of Computer Trends and Technology. 38(1), 46-50.
Hillen, J. 2019. Web scraping for food price research. British Food Journal. 121(12), 3350-3361.
Korea Ministry of Trade, Industry and Energy.
Outlook in April, 2021. Korea Rural Economic Institute. Available at https://aglook.krei.re.kr/jsp/pc/front/observe/monthlyReport.jsp
[1] Since this is not a study of introducing data collecting techniques, it should be noted that only Web scraping is briefly explained.

What does Web-Scraping Tell us about Online Grocery Markets? A Case Study in South Korea
ABSTRACT
This study conducts analysis of online grocery markets by exploiting Web scraping and examines advantages and limitations of Web scraping for online market studies. On one hand, findings report that daily price variation appropriately reflects actual aspects of market situation, price dispersion between online and offline markets, across individual online grocers, and between online big retailers and open markets. On the other hand, sales information presents daily shopping patterns over the week, sales composition of degrees of process and different weights of products on sale. This information provides useful information not only for researchers to understand online grocery industry, but also for consumers to compare unit prices across online grocers and for producers to consider for their online direct marketing activities. In addition, advantages and limitations of Web scraping are also described based on the analyses conducted. At the moment of increasing trend of online grocery shopping even for fresh food items, this research provides useful information about online grocery markets as well as usage of Web scraping for data collection so that researchers on food market research may be informed about the data collecting techniques and its usefulness.
Keywords: Big Data, Web-Scraping, Online Grocery Markets, Consumer Behavior, Online Retailers
INTRODUCTION
Online grocery markets
Food industry in South Korea has been growing from a decade starting from 2008 to 2018, mostly driven by food retail and food service. While food manufacturing increased by 4.5% on annual average from 2015 (KRW 84 trillion, USD 71 billion) to 2018 (KRW 92 trillion, USD 79 billion), food retail and food service grew on annual average by 10.31% (from KRW 232 to 261 trillion, from USD 198 to 223 billion) and 13.6% (from KRW 108 to 138 trillion, from USD 92 to 118 billion), respectively (Figure 1). Compared to the previous period from 2008 to 2014, the growing trend seems to be more apparent recently from 2015 to 2018.
The expansion of food retail and service industries may be highly related to a growth of online grocery shopping, which is a new shopping trend. Figure 2 shows year-to-year monthly growth rates of 13 major retailers in Korea both in offline and online markets from 2016 to 2018. It is indicated that sometimes, the average growth rate of 13 offline retailers continues to decrease with negative magnitudes. On the other hand, the average growth rate of 13 online retailers stays at positive level consistently over the same period (Figure 2)
The online shopping has already been increasing before COVID-19 with the advent of Millennials familiar with the Internet access and the rise of one-person households. Furthermore, it has become more evident that more people move on to online space for their groceries as well as non-food items since social distancing was brought about by the COVID-19 pandemic and this reduced the number of visits to the brick and mortar grocery stores. According to the data of Online Shopping Trend by Statistics Korea (2020), agricultural products and food retail industries accounted for 25.6% of the total online shopping in 4Q, 2020, and increased by 6.5% from 19.1% in 4Q, 2019. Considering that it increased by 3.4% from 4Q, 2018 to 2019, it is of no doubt that COVID-19 pandemic has triggered the movement of consumers from offline to online.
COVID-19 not only took consumers to online spaces for shopping temporarily but also intrigued them for online grocery shopping experience. For example, it is expected that increased experience in online grocery shopping, expansion of meal kits and food deliveries, in combination with innovative technologies in logistics and fulfillment center for fresh food based on AI, machine learning, and big data analytics, may keep consumers in online space for their groceries after the COVID-19 comes to an end. This would be more so for the middle-aged consumers, a main consumer group of grocery shopping. Although consumers around 40s are used to be reluctant to purchase fresh food items online, the COVID-19 took them to online grocery markets inducing positive experiences in online grocery shopping (Song, 2020). In addition, Choi et al. (2018) surveyed consumers on their online shopping experiences for fresh food and 28.1% of them responded that they are willing to expand their online shopping with 60.4% of consumers keeping their level of online shopping in the future.
With that said, it is expected that online grocery shopping will continue to grow gradually in the post-COVID-19 era.
Transition to online retails in agricultural and food industries brings convenient shopping experience to consumers. There is also an observed improvement in efficiency to food supply chains and more opportunities of direct marketing to producers, and so on. Notwithstanding, online grocery industry entails many issues that have yet been examined. For example, there is antitrust of monopolizing/oligopolizing online platforms, information asymmetry between retailers and consumers, food safety for delivery, and environmental issues. In addition, agricultural producers willing to participate in direct marketing activities via online platforms need such information like retail prices, products attributes that meet consumers' needs, and characteristics of online retail stores. In order to investigate the issues, it is necessary to first grasp the status of online grocery markets such as market structure for sizes and shares, market information inclusive of unit prices, quantity sold, and etc. before delving into each of the issues. However, this has not been done so far due to unavailability of disaggregated data for online grocery markets at the retailer level.
Online Shopping Trend from the Statistics Korea provides information about status of online shopping in Korea based on revenue data collected from online retailers. For instance, growth rates, proportion of product categories, and so forth. However, it aggregates revenue up to product categories such as electronics, household goods, sports, service, agricultural produce, food and groceries, and food service across all retailers. Due to the aggregation, ability to analyze online retail markets by specific items and retail channels are highly limited. Moreover, this limitation of analysis might make it impossible to deal with issues involved with rapid development of online shopping mentioned above so far.
Big data for online space
Meanwhile, the Big Data industry has been rapidly growing recently, which induces development of data collecting techniques and enhances access to such techniques of non-computer scientists. Web scraping is a relatively new method of collecting data, which allows users to extract specific information such as prices by accessing websites and its HTML code structure. Although the technique has been utilized in various areas such as marketing, industrial organization, or inflation measurement, it has drawn little attention from online grocery industries. If Web scraping is applied for online grocers, it will become possible to collect information such as product names inclusive of weights and level of process, prices, quantity sold, and ratings. This can be done by each specific item and retailer of interest, which enables to provide such specified information for each item registered on online retailers' websites on a daily basis. This information can contribute to making the online grocery markets competitive by tackling information asymmetry in the industries.
By conducting the case study of analyzing Korean online grocery markets with Web scraping, this study examines the possibility and limitation of utilizing Web scraping as a means for research on online food industries. That said, this study has three main objectives: (1) introduce Web scraping, (2) analyze online grocery markets in Korea by channels and products based on the data collected by exploiting Web scraping, and (3) suggest values and limitations of Web scraping in online food research.
ABOUT WEB SCRAPING
Definition[1]
Web scraping (screen scraping) is an automated method of collecting online data which extract information exposed on screen of a certain website. For example, information on screen or from its corresponding HTML code can be scraped with the methods, downloaded, and stored in a data format.
When it comes to technical procedure of collecting data, an intuitive description of how Web scraping can be implemented will be provided. Basically, Web scraping imitates an online shopper who navigates websites and extract pre-defined information. Figure 3 gives a schematic overview of developing a Web scraper. This can be coded in most common languages such as Python or R, which provide pre-programmed libraries. In the sense that a Web scraper actually navigates websites and draw information from the HTML of the websites, Web scraping is failure-prone techniques to changes of the websites, HTML code, and product classification. Therefore, consistent monitoring and continuous updates of a Web scraper is necessary/required.
Advantages and Limitations
Advantages
Web scraping has lots of advantages over traditional data collecting methods and helps overcome limitations of the traditional data sources such as official prices index or scanner data.
As the value of data is rising, datasets become more expensive. In particular, disaggregated dataset at levels of retail, products, and daily basis is expensive. On the other hand, collecting data online by Web scraping is basically free and related cost includes time required to write the code and test it, and electricity once the code is executed. Considering scales and sizes of the data, according to Cavallo (2018), marginal cost is decreasing with observation approaching to zero.
Frequency of collecting data is totally up to the user whether it should be run once or several times a day. For food price research, daily data would probably be sufficient to see price dynamics. Of course, the higher the sampling frequency is, the more detailed analysis could be done with price dynamics. However, users should optimize frequency and data quality depending on main purpose of each research. Furthermore, because Web scraping extracts data in real-time, information is given at the moment of collecting without any delay. This can contribute to improvement in research analyzing recent events, policy changes, forecasting, and consumer price index computation.
Most official statistics collect data such as consumer price based on widely defined sample products or products categories. Detailed information for food research such as weight, brand, and kinds of process is not generally unavailable. Web scraping enables users or researchers to collect this specific information for each precise products from individual websites. Researchers can aggregate the disaggregate data up to a certain level they need whenever it is necessary.
While scanner data or consumer price index provide very reliable and well-organized data, it does not necessarily contain all the information that researchers ideally need for their analysis. It is probably a case that data are highly aggregated, not available for product by product, for retailers of interest, resulting in limitation of specific analysis. Web scraping allows to create datasets for targeted products, retailers, and locations for pre-determined information. This will improve transparency of datasets by removing omitted variables or hidden black box for estimation procedure required for datasets with samples.
Limitations
While Web scraping has an advantage of collecting real-time data, it implies that one needs to start data collection as early as possible so that sufficiently long time-series data becomes available from the first day. This is a critical drawback built for Web scraping by nature.
Considering the minimal cost of Web scraping, it is tempting for users to collect a literally Big Data more than what is needed. This is consistent with a potential risk that users stack explosively huge size of data beyond the amount that is actually needed. In addition, 85% of Big Data generated recently is unstructured data (De Boe, 2014; Eberendu, 2016) and morphological analysis should be conducted to further extract specified information. Burden of analyzing Big Data will be heavier with bigger datasets and this can be more so when data collection is not well-designed in advance, resulting in too big datasets with meaningless information for inappropriate products.
Another critical limitation is that transaction data is not available for individual consumers. This is mainly due to only exposed information is available for being scraped while transaction information is not (Hillen, 2019). This is more likely an issue of online data exposed to website screen rather than Web scraping itself. If the information of quantity sold for individual products registered is shown on screen or users can detect such information in HTML code of websites, transaction data may be possibly extracted, enabling to conduct more research such as consumer’s price elasticity of demand.
Application in this research
Data collection in the original study targets two products, garlic and onion, for product names, prices, quantity sold, ratings and the number of reviews, registered for sale in 7 online grocery stores over March through May, 2021. Since this is a case study which examines usability of Web scraping for online food research and figure out what information can be extracted by the method, two food items, garlic and onion with high price variability, consumers' intention to purchase online again, and being relatively storable are selected.
ANALYSIS OF ONLINE GROCERY MARKETS
The original study examines the two products over 7 online grocery stores over March through May, 2021. However, due to the length and the main purposes of this paper, some meaningful results are presented. There are two major parts of the results, analyses of (1) prices and (2) sales. Seven online grocers are again divided into two categories; (1) big retailers (BR#) equivalent to Walmart or Krogers in the US and (2) Open markets (OM#) equivalent to Ebay and Amazon in the US on which any sellers can post their products for sales.
Before delving into detailed analyses results, the average number of products registered are presented in Table 1. One noticeable difference between big retailers and open markets are the number of items registered. Open markets have a lot more items registered than there are on big retailers' websites. This may be because it is possible for anyone licensed for business to post their items for sales on open markets websites.
Price analysis
Price analysis has two important implications in food retail research. First it provides unit prices for consumers to compare prices across retailers, increasing consumer surplus by reducing information symmetry. Second, unit price information supports producers willing to sell their products via direct marketing on online retail websites. Because they have hard time figuring out relevant retail prices for marketing activities, rendering unit price information public would help their direct marketing activities.
Daily variation
Average unit price of onions in March is KRW 396/100g (USD 0.34/100g) gradually increasing. Price movement over time varies across channels (Figure 4). For example, most retailers show large variations and prices from OM3 and BR1, BR2, and OM4 vary more largely than others (Figure 4). Figure 4 shows that prices decrease over the month of April with the monthly average price of KRW 327/100g (USD 0.27/100g). This may reflect the fact that April is a season of harvesting onions. Sellers may try to remove their onions by reducing prices. According to KREI's outlook report, prices of onion over April, 2021 are expected to decrease due to a slight overproduction of onion (KREI, 2021). This indirectly validates the quality of Web scraped data from online grocery stores.
Comparison of price between online and offline
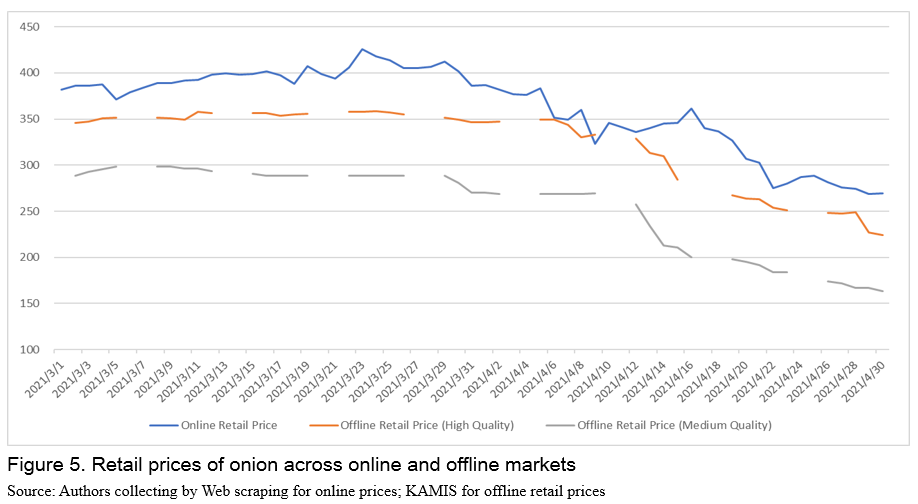
Comparison of retail prices across online and offline stores are important in the sense that they go through different supply chains. Since individual channels go through different supply chains and marketing activities may be different, prices in each market are expected to be different. Figure 5 illustrates that price in online spaces is higher than offline markets for both high quality and lower quality onion products. This suggests that online retailers may have different pricing strategies reflecting consumers' price elasticity of demand, willingness to pay, delivery cost, and etc. This needs future research for heterogeneity of prices across online and offline markets and pricing strategies of online grocers.
Comparison of price across channels
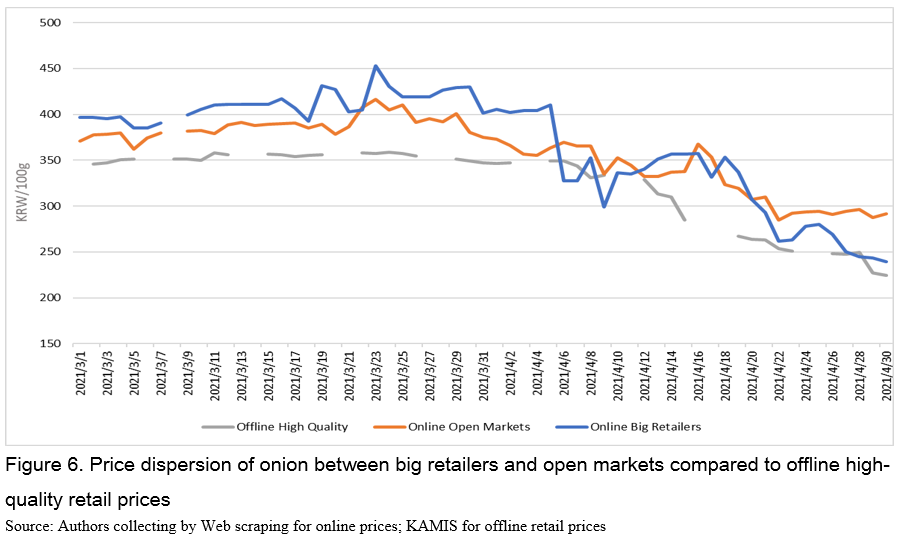
Prices are also expected to be dispersed across seller categories: big retailers vs open markets due to heterogeneity of marketing cost, supply chains, and product qualities. Average price of big retailers, KRW 367/100g (USD 0.31/100g), is higher than the one in open markets, KRW 358/100g (USD 0.30/100g) (Figure 6). This may be due to higher marketing cost of big retailers and usually higher quality, but this information is not available publicly. Prices of big retailers in April sometimes fall below prices of open markets and this may be because big retailers try to sell off its onions at lower prices over the harvesting season. Besides, prices of big retailers and open markets are generally higher than retail prices of high-quality onions in offline retail markets.
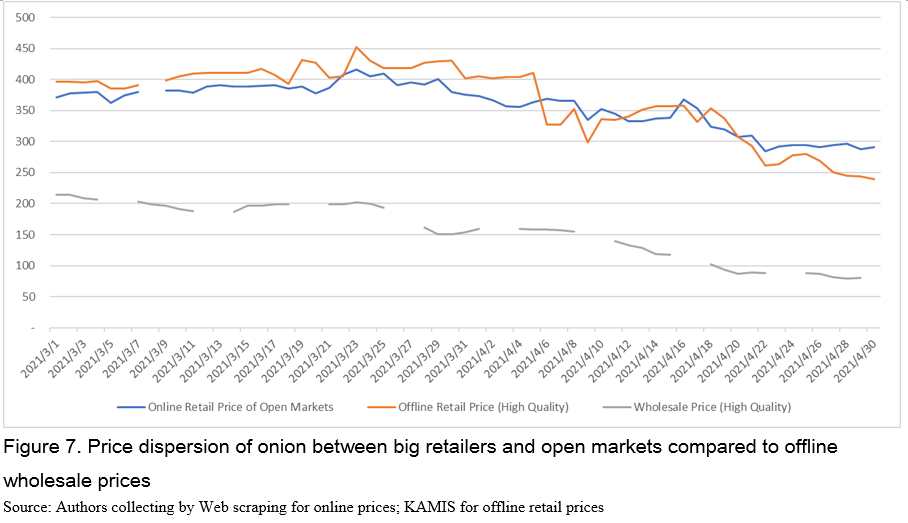
Another interesting feature of the price dispersion is that prices received on open markets are higher than wholesale prices. For example, average price of open markets, KRW 358/100g (USD 0.31/100g), is higher than wholesale prices, KRW 156/100g (USD 0.13/100g) (Figure 7). What catches our attention is that wholesale prices plummeted over April by 55% due to higher production while prices of open markets decreased only by 31%. It suggests that producers may have received higher price than they would have earned if they supply their onion to the wholesale markets.
Sales Analysis
Sales analysis based on scraped data provides interesting aspects of online grocers especially to producers. It will contain sales pattern over the week, composition of products by degrees of process and weight. This will give useful information supporting producers online marketing activities. Among studies on food research using Web scraping, this work is the first making it successfully extract quantity sold data.
Daily sales pattern
Twenty-two percent (22%) of the total weekly sales happens on Monday, gradually decreases to 7% until Saturday, then rebounds to 16% on Sunday (Figure 8 and 9). This is consistent with typical shopping patterns that Monday shows high sales, decaying over the week until Saturday, jump back on Sunday (Hyundai Card and Ebay Korea, 2016; Joongang Daily, 2016; Criteo, 2018). This may also indirectly confirm validity of online data.
This online shopping behavior is contrary to offline shopping behavior. According to the trend analysis of Shinhan Card (2016), consumers actually go out for shopping over the weekends resulting in an increase in offline shopping. On the other hand, they begin online shopping on Sunday night that they procrastinate over the weekend and continue to do it until Monday morning. In particular, consumers have a closer look at the real products over the weekend at the offline grocery stores and place an order via online retail stores. Innovative logistics in Korea that delivers products on early days of the week may attract consumers to shop even fresh food online.
Quantity sold across channels by level of food process
Every online store but BR1 (Big Retailer 1) shows its highest sales from New Onion. New Onion here means onions that are harvested this year (Figure 10). This may be related to channel attributes or consumers shopping behaviors. But it is hard to draw any meaningful insight with Web scraping data for this. Nonetheless, this information is reported to describe what information that data collected with Web scraping can provide.
Quantity sold across channels by weight
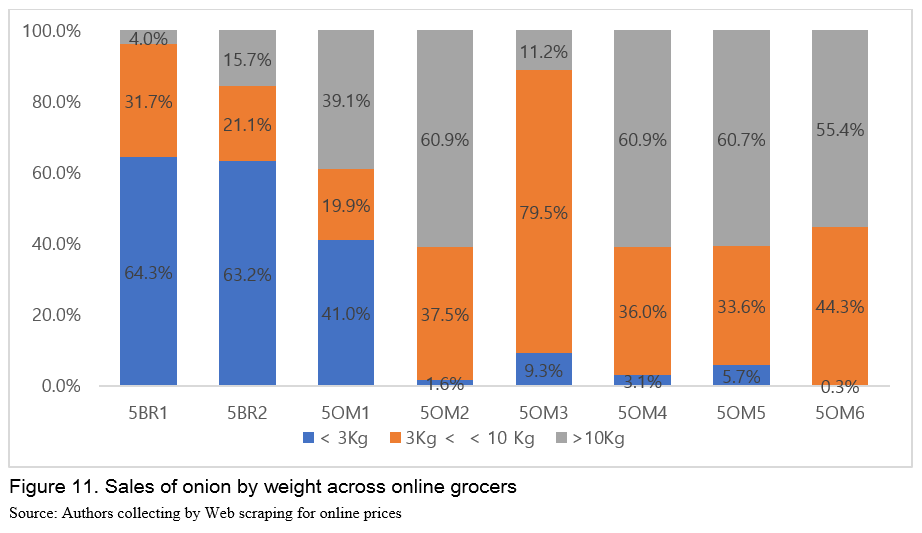
When it comes to sales by weight across online grocers, big retailers and open markets are largely different in weights. As illustrated in Figure 11, lightly weighted products less than 3 Kg account for more than 60% of big retailers’ total sales while heavy products over 3 Kg or even 10 Kg account for around 60% of the total sales of open markets. Based on this, it may suggest that a large portion of onions from big retailers is purchased by households. On the other hand, small restaurants may buy ingredients via open markets. Considering transportation cost for delivering ingredients from wholesale markets, this may be the case that small restaurants use open markets as a source of supplying its ingredients. Lee et al. (2020) reports that 7% of the whole restaurants order ingredients via online markets, supporting findings of this study.
CONCLUSION
With an increasing trend of online grocery shopping in Korea particularly during the COVID-19 pandemic, positive and negative externalities have appeared and understanding the online grocery industry has never been promising and emphasized. For investigating online grocery industry, this study introduces online data collecting technique, Web scraping, and conduct a case study of examining online grocery markets in Korea with data collected by the technique.
Online data collected by utilizing Web scraping in this study provides new information about online grocery markets such as unit price, quantity sold, weights, level of process, etc. on a daily basis. Unit price reflects actual market aspects such as overproduction of onion and downward movements of its price, which indirectly confirms validity of data collected. It also provides such useful information for consumers to compare unit prices across websites and for farmers to refer to for their direct marketing via online grocery platforms. In addition, online prices are on average higher than offline prices and this is more so for big retailers than open markets.
Quantity sold data also presents useful information such as daily sales over the week, proportion of sales across level of process and different sizes of products registered for sale. This may support producers' strategic behavior when they post their products online platforms. For example, they try to make their item heavier if they want to sell it on open markets. In addition, producers may be able to process their fresh products at a certain level to sell more of them. Levels of process may vary across online market categories from big retailers to open markets. Last but not least, if they post their products in early days of the week, it may raise possibility of being sold because consumers are more likely to shop online across earlier period.
Online data collected with Web scraping provides useful information that has not been available so far. However, this is not without limitation. Typical drawbacks of Web scraping such as unavailability of transaction data and/or specific information of products still remain to be resolved. This may be overcome by more improved codes of Web scraping or by being supplemented by other data sourced from scanner data or so. Nonetheless, Web scraping can be utilized to collect online data to understand market structure, daily prices, grocers' attributes, and consumers' shopping behavior. The data may not only be independently used for analyses, but also be added to data collected by traditional methods. This is totally up to its users and purposes of individual research projects.
REFERENCES
aT Food Information Statistics System, Korea Agro-Fisheries & Food Trade Corporation.
Cavallo, A. 2018. Scraped data and sticky prices. Review of Economics and Statistics. 100(1), 105-119.
Choi, J., Park, K., Choi, J., Lee. D. 2018. Status of online marketing of agricultural products. Korea Rural Economic Institute.
De Boe, B. 2014. Use Cases for Unstructured Data – Intersystems of White Paper. Intersystems Corporation.
Eberebdu, A. C. 2016. Unstructured Data: an Overview of the Data of Big Data. International Journal of Computer Trends and Technology. 38(1), 46-50.
Hillen, J. 2019. Web scraping for food price research. British Food Journal. 121(12), 3350-3361.
Korea Ministry of Trade, Industry and Energy.
Outlook in April, 2021. Korea Rural Economic Institute. Available at https://aglook.krei.re.kr/jsp/pc/front/observe/monthlyReport.jsp
[1] Since this is not a study of introducing data collecting techniques, it should be noted that only Web scraping is briefly explained.