ABSTRACT
With the double blow of the nationwide COVID-19 pandemic and the coup crisis, the demand for production inputs and consumer goods was extensively affected even after the initial lockdown and movement restrictions were eased. The reduction suggests fewer households experiencing food insecurity and malnutrition during the combined crisis and significantly influences accessibility, affordability and consumption of food and nutrition status. The objective of this research was to cope with the findings of the ratio of food cost and income and expenditure of selected households, the diversity of consumption patterns and the correlation between household’s income and the number of outdoor eating behavior in Nay Pyi Taw (n=400), Myanmar. There were 1,498 total household members and the ratio of female and male respondents was 15.67. The most common consumption pattern for breakfast at home in the study areas found the pattern based on rice and some snack, pulses, vegetables, fish and beverages and also include wheat being the most stable. A good range of food consumption patterns in each household can be found depending on the monthly income, food availability and nutrition concerns. The majority of sample households consumed the rice based without meat in the breakfast at home while the minority of sample households only mentioned fish in their combination pattern in the study areas. The common combination pattern for lunch and dinner found the same combination pattern which contains rice, meat, fish, and vegetables was the most common one for lunch and dinner at home. Therefore, the household daily consumption patterns contain a wide range of essential nutrients for health. Rice, vegetables, and wheat-based snacks were the main food items consumed outside the home however; the total outdoor consumption rate was low. Although rice, meat, fish, vegetables, and pulses consumption pattern were found to be common, the consumption amount for pulses was low. According to the results, rice and vegetables are commonly consumed. Meanwhile, the proportion of food items based on their combination can change based on their family income and food price. The results of the research demonstrated that there was a significant correlation between the household’s income and the number of outdoor eating days per month which means the better the household income is, the more number of outdoor eating days per month except for outdoor dining. While the results indicate considerable resilience in the nutrition-sensitive food system, increasing investment in agricultural research related to nutrient dense crops and changing consumption patterns with new dietary diversity is also deemed beneficial.
Keywords: diversification of common food items, consumption pattern, income and expenditure ratio
INTRODUCTION
Nowadays, the food system has become serious based on the demographic change and growing population (Mottaleb, K.A. et.al, 2018). In developing countries during the pandemic period, changing lifestyles and food consumption patterns are rapidly transforming in both urban and rural areas. Therefore, the issue of how much food gets to the households, which is fundamental to a household’s food security, is a function of food production level, food marketing efficiency and the households’ income level. Rural households continue to face varied economic conditions which impact their living standard and food security situation which consequently create gaps in resource availability and a considerable imbalance between the demand and supply of food among the poor households. The Gross Domestic Product (GDP) per capita in Myanmar was at US$1,218.35 and equivalent to 10% of the world's average in 2020 (World Bank, 2020). Due to the combined crisis effect in Myanmar, more than 13.2 million people are moderately food insecure in 2022 (World Food Programme [WFP], 2022). Therefore, getting food on the table for many families around the country is steadily becoming difficult especially with the ongoing political conflicts and the COVID-19 pandemic. Given the many challenges confronting these countries, the food systems in different countries are challenged and transformed to respond to various shocks and stressors while delivering economic and food and nutrition security. Therefore, the study focusses to formulate how the diversification of food consumption pattern indoors and outdoors during different eating times during the economic shock and its relationship between household income and eating behaviour outdoor in the study area.
Objectives
The specific objectives are as follows:
- To determine the ratio of income, food cost and expenditure of selected households in Nay Pyi Taw;
- To establish the dietary diversity of selected households in the study areas; and
- To identify the correlation between a household’s income and the number of outdoor eating behaviour in the study areas
METHODOLOGY
Sampling method and data analysis
In this study, primary data collection was conducted in 8 townships in Nay Pyi Taw which included the rural and urban areas to collect data on demographic characteristics, age groups, family monthly income, expenditure, the total cost of food, the diversification of food consumption pattern of indoor eating and outdoor eating by a structured questionnaire. A convenience sampling method was used for primary data collection from a total sample of 400 respondents in October and November, 2021. After collecting the primary data, it was coded first before being loaded into EXCEL for consumption patterns, food items and different eating times. The collected data were entered and arranged by using Microsoft Office Excel and statistically analyzed by using STATA 15 to generate correlation between household incomes and eating behavior outdoors.
RESULTS AND DISCUSSION
Demographic information of respondents of selected households
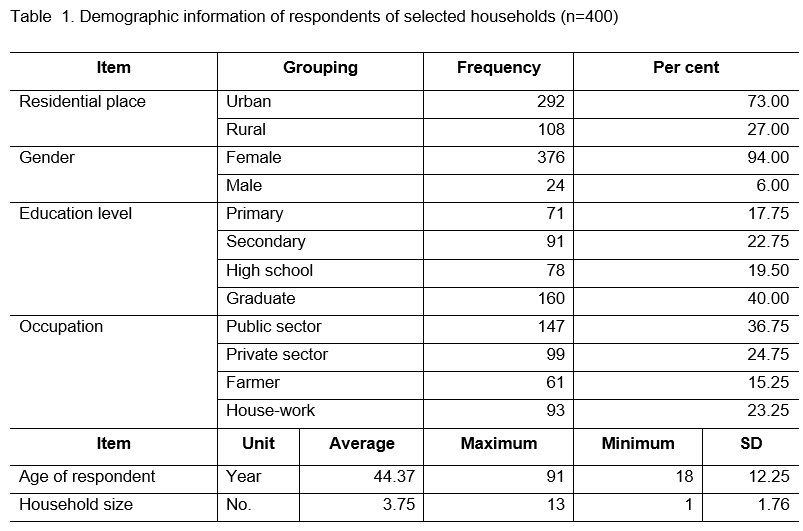
The socio-economics characteristics of 400 respondents within the study area are shown in Table 1. The female and male respondent ratio was 15.67. More than 70% of respondents were living in the urban area while near one-fourth was from the rural area. As for education level, 40% of selected respondents were graduates. The remaining 17.75% were in their primary education level, 22.75 % were in their secondary education level, and 19.50% were in high school. In the study area, 36.75% of respondents were working in the public sector whereas 24.75 % of them were working in the private sector and these were their main income sources. Farm households took up 15.25 % of the sample households. Some sample respondents who spend their time doing housework like cooking, washing, and child-caring took account for 23.25% in total. The average age of respondents in selected households was 44.37 years while the utmost age was 91-year-old, and therefore the minimum age was 18 years old. The average household size in the study area was 4 with the range of 1-13 household members.
Income, expenditure and food cost information
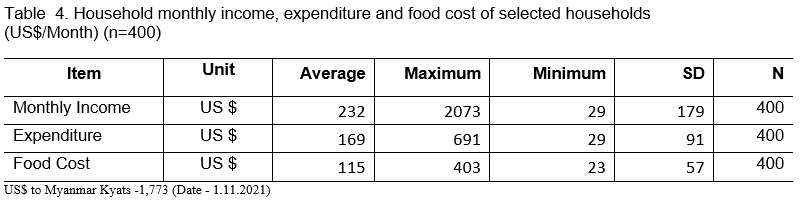
Based on the country notes (CGIAR, 2021), the COVID-19 disruptions impact on men’s and women’s abilities to access paid work when mills registered lower overall production, employee layoffs, and less credit availability. The households’ monthly income, expenditure and food costs of 400 selected households are shown in Table 4. The average income of the total household was US$232 per month, divided into US$169 per month, as household expenditure and US$115 per month, as food costs.
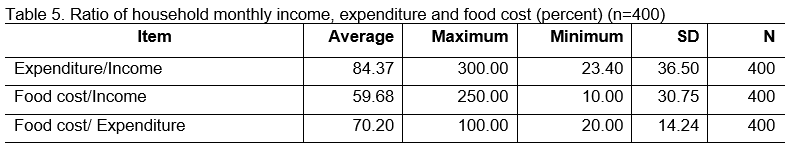
The household monthly income, expenditure and food cost ratios are shown in Table 5. According to the results, the typical contribution of expenditure to income of sample households (n=400) was 84.37%, and the maximum contribution was 300% which means some households were in debt because of limited household income and they spent more money than they could earn. The average share of food cost to income was 59.68 % which has the same meaning as their monthly food cost and were higher than their monthly income. The typical proportion of food cost into expenditure was 70.20% and therefore the maximum proportion within households was 100% which reveals that the household’s food cost and expenditure were the same amounts and there was no income for other uses.
Most common consumption patterns at home
During this study, the foremost common daily consumption patterns for breakfast, lunch and dinner including eating at home and eating outside patterns were investigated. In keeping with the result of the study, different food consumption patterns in each household can be found depending on their monthly income, food preferences and availability, and health and nutrition concerns. The eating habits and culture of Myanmar people are comprised of three main meals – breakfast, lunch and dinner. Some eat these meals at home; however, some prefer eating outside irregularly.
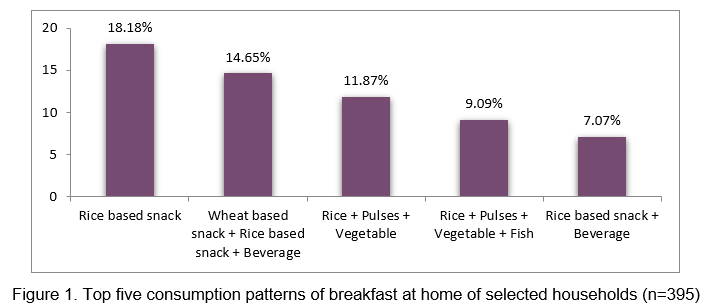
Consumption pattern of breakfast at home: More than 90% of family members consumed five common consumption patterns for breakfast at home. According to the result of the breakfast consumption pattern, the highest five common patterns of breakfast at the home of selected households (n=395) are shown in Figure 1. Among them, the foremost common consumption pattern was a rice-based snack (18.18%), the combination of wheat-based snack, rice-based snack and beverage pattern (14.65%) and rice, pulses and vegetable combination (11.87%). The minority of sample households consumed the opposite pattern of rice, pulses, and vegetables including fish combination pattern (9.09%) and rice-based snack and beverage food combinations (7.07%) for breakfast at home in the study area. Consistent with the result found, the majority of sample had a consumption pattern of without meat during breakfast at home while the minority of sample households only mentioned fish in their combination pattern in the study areas. In this study area, most of the respondents wish to drink coffee or tea with a different type of snacks for breakfast.
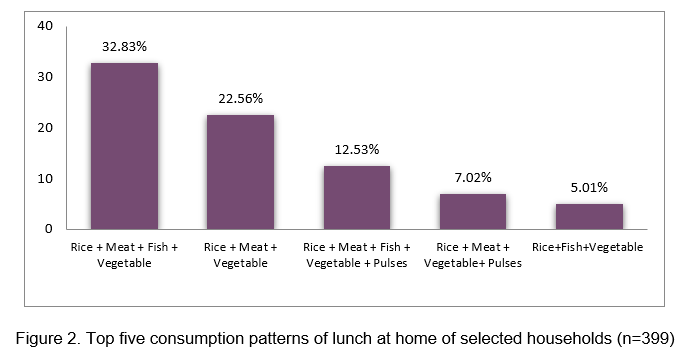
Consumption pattern of lunch at home: The majority of sample respondents had a food consumption pattern of having more combination food during lunch than breakfast. According to the result, the five common consumption patterns for lunch at home of selected households (n=399) described in Figure 2. Rice, meat, fish and vegetables combination pattern was the most common food consumption pattern, and it accounted for 32.83% compared with other food patterns for lunch. This is often the traditional Myanmar food combination pattern that includes one dish for meat and fermented fish and fried vegetables or soup with rice. Second most food combination pattern was rice, meat, and vegetables (22.56%) and therefore the third most food combination pattern was rice, meat, vegetables and pulses (12.53%).
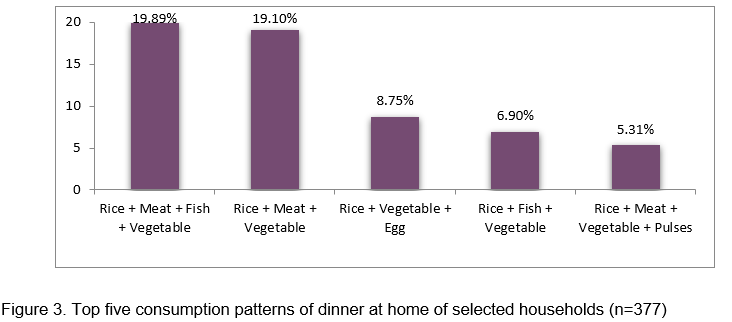
Consumption pattern of dinner at home: The majority of sample respondents had a food consumption pattern similar to combination pattern at home in the study area. Among different types of consumption patterns, the top-five most common consumption patterns for dinner at the home of selected households (n=377) are described in Figure 3. Rice, meat, fish and vegetables combination pattern was the most common food consumption pattern for dinner at home, and they accounted for 19.89% in comparison with other food combination patterns for dinner. Second, the most food combination pattern was the rice, meat and vegetables consumption pattern (19.10%) and therefore the third most food combination pattern was rice, meat and egg (8.75%). The proportion of the remaining consumption patterns was at low per cent, and everyone was under 10 % which means there was high variation within food consumption patterns for dinner at home.
Most common outdoor eating patterns
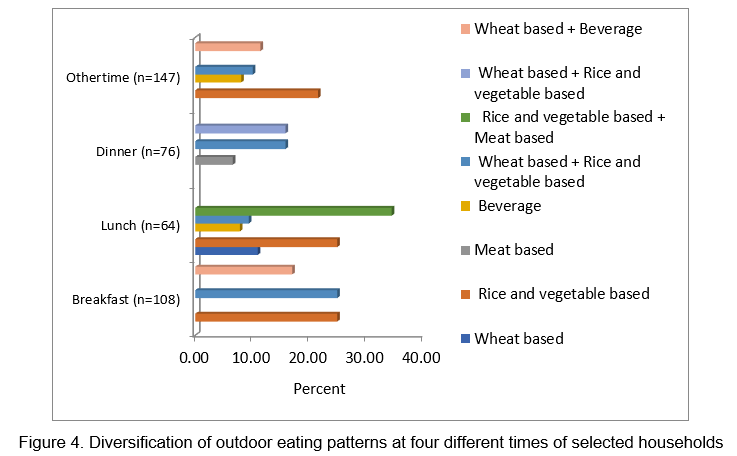
Outdoor eating pattern of breakfast: The diversification of outdoor eating patterns at different times in the sample households in the selected areas is shown in Figure 4. For outdoor eating food consumption patterns for breakfast, nearly 30% of the selected households consumed a combination of rice and vegetable-based food consumption pattern and rice, vegetables and wheat-based consumption pattern by the selected households (n=108). The third most common pattern was wheat-based with beverage (16.67%) among others eating outside the pattern of breakfast as shown in Figure 4.
For outdoor lunch, about 16% of selected households (n=64) ate lunch outside and the rice vegetable-based food pattern was the top outdoor eating consumption pattern among other food patterns. However, the percentages of all these common food patterns were under 10 % except for rice, vegetables and meat-based consumption patterns (34.38%) and rice and vegetable-based (17.19%). The results conclude that the selected households consumed various food combinations when they eat outside for lunch.
For the most common eating patterns for outdoor dinner, about 19% of selected households ate dinner outside and therefore had the top five outdoor dinner eating patterns by selected households (n=64). The top consumption pattern for outdoor dinner was made up of rice, vegetables and meat-based combination pattern and therefore the proportion of that pattern was 28.95%. The identical proportion of the second most common patterns (15.79%) was rice, vegetables, meat-based and wheat-based combination pattern and wheat-based, rice and vegetable-based combination pattern. The remaining two patterns have a tiny proportion at 11.84% and 6.58% within the selected households that found wheat-based and meat-based patterns.
Apart from breakfast, lunch and dinner, some people eat outside on other times, for instance, teatime or snack time. Consistent with the result, one-third of selected households (36.75%) ate outside during break time. For such sort of combination of eating patterns, rice and the vegetable-based outdoor eating pattern was the most common one and it contributed 21.48% among other patterns. Among other patterns, wheat-based and beverage (11.41%) and wheat-based, rice and vegetable-based (10.07%) were also popular food combinations for outdoor eating at their proportion within the selected households’ outdoor eating pattern of other time (Figure 4).
Comparison between eating at home and outdoor based on household income
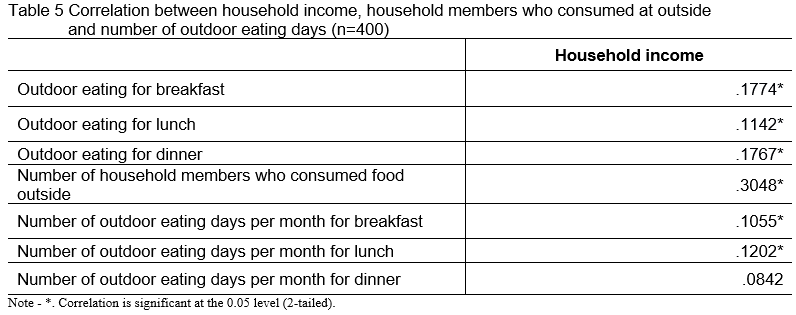
Table 5 described the results of the statistical correlation analysis using the Pearson’s correlation test as shown below. The results obtained indicate that there is a significant relationship between the household income with the number of meal time of outdoor eating per day and the number of household’s size who consumed outside and the number of outdoor eating days per month. These results indicate that the higher the household income, the higher number of eating times per day. The more household size consumed outside, the more household income received which is positively correlated based on the result. The better household income found, the more number of outdoor eating days per month except for outdoor dining. This is in line with the research that the reason for the absence of household income became the lower times of outdoor eating behaviour for different times.
CONCLUSION AND RECOMMENDATION
The study jibed with the findings of the ratio of food cost and income and expenditure of selected households in Nay Pyi Taw, the consumption pattern and food diversity of selected households and the correlation between household’s income and the number of outdoor eating behaviour in the study areas. According to the survey results of the 400 selected households, there were 1,498 total household members and the ratio of female and male respondents was 15.67. The majority of the selected households were from urban areas and 40% of selected respondents were graduates of a university. The majority of sample respondents were working in public sectors and the others belong to the private sectors, as farmers and so on. The sample surveyed households were found to have a high food cost to income ratio and high food cost to the total expense ratio. The result means that the proportion of income utilization for food and total expenditure was higher utilization based on the average family income per month.
The most common patterns of breakfast at the home of selected households were the rice-based snack, wheat-based snack, and the combination of rice-based snack and beverage pattern. The minority of sample respondents mentioned the combination of food consumption with fish in breakfast at home. For lunch, the food combination pattern at home in the study area found that the majority of sample respondents consumed more than two items of food with rice which was a combination of meat, vegetables and pulses. The most common consumption pattern for dinner is at home, and the most common food combination pattern was at least two food items and meat, which is the primary item with other food items like vegetables and egg with rice. Most of the diets pattern for breakfast, lunch and dinner at home were found nutritious and healthy food combination with different food items in the study areas. Meat and vegetables are the main common food items among other food items in combination and the minority of the sample respondents only mentioned that there was a small percentage of combining patterns with pulses among different consumption patterns. During the COVID-19 pandemic period, the findings described that the majority of sample respondents were becoming more conscious about the nutritious consumption patterns and changing to a healthier diet pattern. The author (Chue Htet Hnin et.al, 2022) mentioned that more than 80% of sample respondents were satisfied with the quality and quantity of the basic perceptions and practices for food consumption. In Myanmar culture, mostly those of women (mothers) were more responsible for cooking in their families make the decision on the different food combination patterns at home based on the food preferences of their family members.
For outdoor eating food consumption patterns for breakfast, the sample selected households consumed the combination of rice and vegetable-based food consumption pattern and rice, vegetables and wheat-based consumption pattern. The third most common was wheat-based and beverage consumption pattern among others eating outside. For the top common consumption pattern for outdoor lunch, rice and vegetables were the top outdoor eating consumption pattern among other food patterns with meat and without meat. The consumption pattern with meat was highest mentioned among other food items of food combination at outside. For outdoor dinner, the top consumption pattern found that the main food combination with rice and vegetable and other types of priority such as meat, and wheat-based food items. Wheat-based food items were found to be of another type of priority for outdoor dining in the study areas. Based on the study areas, the result found that the sample respondents normally consumed other outdoor meal times (snack time or tea break) except breakfast, lunch and dinner. Consistent with the result, rice and vegetable consumption pattern and wheat-based food combination pattern included the popular common outdoor eating consumption pattern. Even though, according to the results, rice and vegetable are commonly consumed at the other meal time. Based on Pearson’s correlation test results, there were indicators that the better household income, the more outdoor eating days per month except for outdoor dining. According to the findings, the combination of rice, meat and vegetable and rice based snack is the most preferable type of food items when we compared with the combination of fish in their daily life. Therefore, the result clearly modified that this combination is higher demand the sample respondent’s daily life while the proportion of food amount can change by the combination of preferable of eatable types, their family income and food price. During the post-COVID-19 Pandemic, most consumption patterns within the households transformed into healthy and nutritious food patterns which contain the high dietary value. Therefore, there is a focus to improve on increasing investments in agricultural research related to nutrient-dense crops, improving agricultural crop productivity with nutritionally enhanced crops. Therefore, changing consumption patterns with new food recipes handle to increase the nutritional status of the households by accessing the nutrition-sensitive food systems.
REFERENCES
Chue Htet Hnin, Theingi Myint, May Thet Htar, Htet Marlar Aye, Thi Thi Soe, Moh Moh, Yin Nyein Aye (2022) “Who Likes What? Intra-household Food Preferences in Nay Pyi Taw, Myanmar”, Food and Fertilizer Technology Center for the Asian and Pacific Region, Agricultural Policy Platform (FFTC_AP), https://ap.fftc.org.tw/article/3008
Covid-19 HUB (2021), Myanmar: The impact of COVID-19 and food system responses, Country Note, CGIAR Research Program.
Espino A et.al (2021, a). Espino A, Monville-Oro E, Barbon WJ, Ruba CD, Gummadi S, Gonsalves J. 2021. Local food systems in Cambodia, Myanmar and the Philippines: Perspective from the local communities. CCAFS Working Paper no. 356. Wageningen, the Netherlands: CGIAR Research Program on Climate Change, Agriculture and Food Security (CCAFS).
Espino A et.al (2021, b). Espino A, Monville-Oro E, Barbon WJ, Ruba CD, Gummadi S, Gonsalves J. 2021. Local food systems in Cambodia, Myanmar and the Philippines: Perspective from the local communities. CCAFS Working Paper no. 356. Wageningen, the Netherlands: CGIAR Research Program on Climate Change, Agriculture and Food Security (CCAFS).
Mottaleb, K.A., Rahut, D.B., Kruseman, G. and Erenstein, O., 2018. Changing food consumption of households in developing countries: a Bangladesh case. Journal of International Food & Agribusiness Marketing, 30(2), pp.156-174.
Myanmar GDP per capita (World Bank, 2020), Secondary data sources form Trading Economics, https://tradingeconomics.com/myanmar/gdp-per-capita
WFP, 2022. Myanmar emergency, 2022 [online], https://www.wfp.org/emergencies/myanmar-emergency

How Household Income Influences on Dietary Diversity in Nay Pyi Taw, Myanmar?
ABSTRACT
With the double blow of the nationwide COVID-19 pandemic and the coup crisis, the demand for production inputs and consumer goods was extensively affected even after the initial lockdown and movement restrictions were eased. The reduction suggests fewer households experiencing food insecurity and malnutrition during the combined crisis and significantly influences accessibility, affordability and consumption of food and nutrition status. The objective of this research was to cope with the findings of the ratio of food cost and income and expenditure of selected households, the diversity of consumption patterns and the correlation between household’s income and the number of outdoor eating behavior in Nay Pyi Taw (n=400), Myanmar. There were 1,498 total household members and the ratio of female and male respondents was 15.67. The most common consumption pattern for breakfast at home in the study areas found the pattern based on rice and some snack, pulses, vegetables, fish and beverages and also include wheat being the most stable. A good range of food consumption patterns in each household can be found depending on the monthly income, food availability and nutrition concerns. The majority of sample households consumed the rice based without meat in the breakfast at home while the minority of sample households only mentioned fish in their combination pattern in the study areas. The common combination pattern for lunch and dinner found the same combination pattern which contains rice, meat, fish, and vegetables was the most common one for lunch and dinner at home. Therefore, the household daily consumption patterns contain a wide range of essential nutrients for health. Rice, vegetables, and wheat-based snacks were the main food items consumed outside the home however; the total outdoor consumption rate was low. Although rice, meat, fish, vegetables, and pulses consumption pattern were found to be common, the consumption amount for pulses was low. According to the results, rice and vegetables are commonly consumed. Meanwhile, the proportion of food items based on their combination can change based on their family income and food price. The results of the research demonstrated that there was a significant correlation between the household’s income and the number of outdoor eating days per month which means the better the household income is, the more number of outdoor eating days per month except for outdoor dining. While the results indicate considerable resilience in the nutrition-sensitive food system, increasing investment in agricultural research related to nutrient dense crops and changing consumption patterns with new dietary diversity is also deemed beneficial.
Keywords: diversification of common food items, consumption pattern, income and expenditure ratio
INTRODUCTION
Nowadays, the food system has become serious based on the demographic change and growing population (Mottaleb, K.A. et.al, 2018). In developing countries during the pandemic period, changing lifestyles and food consumption patterns are rapidly transforming in both urban and rural areas. Therefore, the issue of how much food gets to the households, which is fundamental to a household’s food security, is a function of food production level, food marketing efficiency and the households’ income level. Rural households continue to face varied economic conditions which impact their living standard and food security situation which consequently create gaps in resource availability and a considerable imbalance between the demand and supply of food among the poor households. The Gross Domestic Product (GDP) per capita in Myanmar was at US$1,218.35 and equivalent to 10% of the world's average in 2020 (World Bank, 2020). Due to the combined crisis effect in Myanmar, more than 13.2 million people are moderately food insecure in 2022 (World Food Programme [WFP], 2022). Therefore, getting food on the table for many families around the country is steadily becoming difficult especially with the ongoing political conflicts and the COVID-19 pandemic. Given the many challenges confronting these countries, the food systems in different countries are challenged and transformed to respond to various shocks and stressors while delivering economic and food and nutrition security. Therefore, the study focusses to formulate how the diversification of food consumption pattern indoors and outdoors during different eating times during the economic shock and its relationship between household income and eating behaviour outdoor in the study area.
Objectives
The specific objectives are as follows:
METHODOLOGY
Sampling method and data analysis
In this study, primary data collection was conducted in 8 townships in Nay Pyi Taw which included the rural and urban areas to collect data on demographic characteristics, age groups, family monthly income, expenditure, the total cost of food, the diversification of food consumption pattern of indoor eating and outdoor eating by a structured questionnaire. A convenience sampling method was used for primary data collection from a total sample of 400 respondents in October and November, 2021. After collecting the primary data, it was coded first before being loaded into EXCEL for consumption patterns, food items and different eating times. The collected data were entered and arranged by using Microsoft Office Excel and statistically analyzed by using STATA 15 to generate correlation between household incomes and eating behavior outdoors.
RESULTS AND DISCUSSION
Demographic information of respondents of selected households
The socio-economics characteristics of 400 respondents within the study area are shown in Table 1. The female and male respondent ratio was 15.67. More than 70% of respondents were living in the urban area while near one-fourth was from the rural area. As for education level, 40% of selected respondents were graduates. The remaining 17.75% were in their primary education level, 22.75 % were in their secondary education level, and 19.50% were in high school. In the study area, 36.75% of respondents were working in the public sector whereas 24.75 % of them were working in the private sector and these were their main income sources. Farm households took up 15.25 % of the sample households. Some sample respondents who spend their time doing housework like cooking, washing, and child-caring took account for 23.25% in total. The average age of respondents in selected households was 44.37 years while the utmost age was 91-year-old, and therefore the minimum age was 18 years old. The average household size in the study area was 4 with the range of 1-13 household members.
Income, expenditure and food cost information
Based on the country notes (CGIAR, 2021), the COVID-19 disruptions impact on men’s and women’s abilities to access paid work when mills registered lower overall production, employee layoffs, and less credit availability. The households’ monthly income, expenditure and food costs of 400 selected households are shown in Table 4. The average income of the total household was US$232 per month, divided into US$169 per month, as household expenditure and US$115 per month, as food costs.
The household monthly income, expenditure and food cost ratios are shown in Table 5. According to the results, the typical contribution of expenditure to income of sample households (n=400) was 84.37%, and the maximum contribution was 300% which means some households were in debt because of limited household income and they spent more money than they could earn. The average share of food cost to income was 59.68 % which has the same meaning as their monthly food cost and were higher than their monthly income. The typical proportion of food cost into expenditure was 70.20% and therefore the maximum proportion within households was 100% which reveals that the household’s food cost and expenditure were the same amounts and there was no income for other uses.
Most common consumption patterns at home
During this study, the foremost common daily consumption patterns for breakfast, lunch and dinner including eating at home and eating outside patterns were investigated. In keeping with the result of the study, different food consumption patterns in each household can be found depending on their monthly income, food preferences and availability, and health and nutrition concerns. The eating habits and culture of Myanmar people are comprised of three main meals – breakfast, lunch and dinner. Some eat these meals at home; however, some prefer eating outside irregularly.
Consumption pattern of breakfast at home: More than 90% of family members consumed five common consumption patterns for breakfast at home. According to the result of the breakfast consumption pattern, the highest five common patterns of breakfast at the home of selected households (n=395) are shown in Figure 1. Among them, the foremost common consumption pattern was a rice-based snack (18.18%), the combination of wheat-based snack, rice-based snack and beverage pattern (14.65%) and rice, pulses and vegetable combination (11.87%). The minority of sample households consumed the opposite pattern of rice, pulses, and vegetables including fish combination pattern (9.09%) and rice-based snack and beverage food combinations (7.07%) for breakfast at home in the study area. Consistent with the result found, the majority of sample had a consumption pattern of without meat during breakfast at home while the minority of sample households only mentioned fish in their combination pattern in the study areas. In this study area, most of the respondents wish to drink coffee or tea with a different type of snacks for breakfast.
Consumption pattern of lunch at home: The majority of sample respondents had a food consumption pattern of having more combination food during lunch than breakfast. According to the result, the five common consumption patterns for lunch at home of selected households (n=399) described in Figure 2. Rice, meat, fish and vegetables combination pattern was the most common food consumption pattern, and it accounted for 32.83% compared with other food patterns for lunch. This is often the traditional Myanmar food combination pattern that includes one dish for meat and fermented fish and fried vegetables or soup with rice. Second most food combination pattern was rice, meat, and vegetables (22.56%) and therefore the third most food combination pattern was rice, meat, vegetables and pulses (12.53%).
Consumption pattern of dinner at home: The majority of sample respondents had a food consumption pattern similar to combination pattern at home in the study area. Among different types of consumption patterns, the top-five most common consumption patterns for dinner at the home of selected households (n=377) are described in Figure 3. Rice, meat, fish and vegetables combination pattern was the most common food consumption pattern for dinner at home, and they accounted for 19.89% in comparison with other food combination patterns for dinner. Second, the most food combination pattern was the rice, meat and vegetables consumption pattern (19.10%) and therefore the third most food combination pattern was rice, meat and egg (8.75%). The proportion of the remaining consumption patterns was at low per cent, and everyone was under 10 % which means there was high variation within food consumption patterns for dinner at home.
Most common outdoor eating patterns
Outdoor eating pattern of breakfast: The diversification of outdoor eating patterns at different times in the sample households in the selected areas is shown in Figure 4. For outdoor eating food consumption patterns for breakfast, nearly 30% of the selected households consumed a combination of rice and vegetable-based food consumption pattern and rice, vegetables and wheat-based consumption pattern by the selected households (n=108). The third most common pattern was wheat-based with beverage (16.67%) among others eating outside the pattern of breakfast as shown in Figure 4.
For outdoor lunch, about 16% of selected households (n=64) ate lunch outside and the rice vegetable-based food pattern was the top outdoor eating consumption pattern among other food patterns. However, the percentages of all these common food patterns were under 10 % except for rice, vegetables and meat-based consumption patterns (34.38%) and rice and vegetable-based (17.19%). The results conclude that the selected households consumed various food combinations when they eat outside for lunch.
For the most common eating patterns for outdoor dinner, about 19% of selected households ate dinner outside and therefore had the top five outdoor dinner eating patterns by selected households (n=64). The top consumption pattern for outdoor dinner was made up of rice, vegetables and meat-based combination pattern and therefore the proportion of that pattern was 28.95%. The identical proportion of the second most common patterns (15.79%) was rice, vegetables, meat-based and wheat-based combination pattern and wheat-based, rice and vegetable-based combination pattern. The remaining two patterns have a tiny proportion at 11.84% and 6.58% within the selected households that found wheat-based and meat-based patterns.
Apart from breakfast, lunch and dinner, some people eat outside on other times, for instance, teatime or snack time. Consistent with the result, one-third of selected households (36.75%) ate outside during break time. For such sort of combination of eating patterns, rice and the vegetable-based outdoor eating pattern was the most common one and it contributed 21.48% among other patterns. Among other patterns, wheat-based and beverage (11.41%) and wheat-based, rice and vegetable-based (10.07%) were also popular food combinations for outdoor eating at their proportion within the selected households’ outdoor eating pattern of other time (Figure 4).
Comparison between eating at home and outdoor based on household income
Table 5 described the results of the statistical correlation analysis using the Pearson’s correlation test as shown below. The results obtained indicate that there is a significant relationship between the household income with the number of meal time of outdoor eating per day and the number of household’s size who consumed outside and the number of outdoor eating days per month. These results indicate that the higher the household income, the higher number of eating times per day. The more household size consumed outside, the more household income received which is positively correlated based on the result. The better household income found, the more number of outdoor eating days per month except for outdoor dining. This is in line with the research that the reason for the absence of household income became the lower times of outdoor eating behaviour for different times.
CONCLUSION AND RECOMMENDATION
The study jibed with the findings of the ratio of food cost and income and expenditure of selected households in Nay Pyi Taw, the consumption pattern and food diversity of selected households and the correlation between household’s income and the number of outdoor eating behaviour in the study areas. According to the survey results of the 400 selected households, there were 1,498 total household members and the ratio of female and male respondents was 15.67. The majority of the selected households were from urban areas and 40% of selected respondents were graduates of a university. The majority of sample respondents were working in public sectors and the others belong to the private sectors, as farmers and so on. The sample surveyed households were found to have a high food cost to income ratio and high food cost to the total expense ratio. The result means that the proportion of income utilization for food and total expenditure was higher utilization based on the average family income per month.
The most common patterns of breakfast at the home of selected households were the rice-based snack, wheat-based snack, and the combination of rice-based snack and beverage pattern. The minority of sample respondents mentioned the combination of food consumption with fish in breakfast at home. For lunch, the food combination pattern at home in the study area found that the majority of sample respondents consumed more than two items of food with rice which was a combination of meat, vegetables and pulses. The most common consumption pattern for dinner is at home, and the most common food combination pattern was at least two food items and meat, which is the primary item with other food items like vegetables and egg with rice. Most of the diets pattern for breakfast, lunch and dinner at home were found nutritious and healthy food combination with different food items in the study areas. Meat and vegetables are the main common food items among other food items in combination and the minority of the sample respondents only mentioned that there was a small percentage of combining patterns with pulses among different consumption patterns. During the COVID-19 pandemic period, the findings described that the majority of sample respondents were becoming more conscious about the nutritious consumption patterns and changing to a healthier diet pattern. The author (Chue Htet Hnin et.al, 2022) mentioned that more than 80% of sample respondents were satisfied with the quality and quantity of the basic perceptions and practices for food consumption. In Myanmar culture, mostly those of women (mothers) were more responsible for cooking in their families make the decision on the different food combination patterns at home based on the food preferences of their family members.
For outdoor eating food consumption patterns for breakfast, the sample selected households consumed the combination of rice and vegetable-based food consumption pattern and rice, vegetables and wheat-based consumption pattern. The third most common was wheat-based and beverage consumption pattern among others eating outside. For the top common consumption pattern for outdoor lunch, rice and vegetables were the top outdoor eating consumption pattern among other food patterns with meat and without meat. The consumption pattern with meat was highest mentioned among other food items of food combination at outside. For outdoor dinner, the top consumption pattern found that the main food combination with rice and vegetable and other types of priority such as meat, and wheat-based food items. Wheat-based food items were found to be of another type of priority for outdoor dining in the study areas. Based on the study areas, the result found that the sample respondents normally consumed other outdoor meal times (snack time or tea break) except breakfast, lunch and dinner. Consistent with the result, rice and vegetable consumption pattern and wheat-based food combination pattern included the popular common outdoor eating consumption pattern. Even though, according to the results, rice and vegetable are commonly consumed at the other meal time. Based on Pearson’s correlation test results, there were indicators that the better household income, the more outdoor eating days per month except for outdoor dining. According to the findings, the combination of rice, meat and vegetable and rice based snack is the most preferable type of food items when we compared with the combination of fish in their daily life. Therefore, the result clearly modified that this combination is higher demand the sample respondent’s daily life while the proportion of food amount can change by the combination of preferable of eatable types, their family income and food price. During the post-COVID-19 Pandemic, most consumption patterns within the households transformed into healthy and nutritious food patterns which contain the high dietary value. Therefore, there is a focus to improve on increasing investments in agricultural research related to nutrient-dense crops, improving agricultural crop productivity with nutritionally enhanced crops. Therefore, changing consumption patterns with new food recipes handle to increase the nutritional status of the households by accessing the nutrition-sensitive food systems.
REFERENCES
Chue Htet Hnin, Theingi Myint, May Thet Htar, Htet Marlar Aye, Thi Thi Soe, Moh Moh, Yin Nyein Aye (2022) “Who Likes What? Intra-household Food Preferences in Nay Pyi Taw, Myanmar”, Food and Fertilizer Technology Center for the Asian and Pacific Region, Agricultural Policy Platform (FFTC_AP), https://ap.fftc.org.tw/article/3008
Covid-19 HUB (2021), Myanmar: The impact of COVID-19 and food system responses, Country Note, CGIAR Research Program.
Espino A et.al (2021, a). Espino A, Monville-Oro E, Barbon WJ, Ruba CD, Gummadi S, Gonsalves J. 2021. Local food systems in Cambodia, Myanmar and the Philippines: Perspective from the local communities. CCAFS Working Paper no. 356. Wageningen, the Netherlands: CGIAR Research Program on Climate Change, Agriculture and Food Security (CCAFS).
Espino A et.al (2021, b). Espino A, Monville-Oro E, Barbon WJ, Ruba CD, Gummadi S, Gonsalves J. 2021. Local food systems in Cambodia, Myanmar and the Philippines: Perspective from the local communities. CCAFS Working Paper no. 356. Wageningen, the Netherlands: CGIAR Research Program on Climate Change, Agriculture and Food Security (CCAFS).
Mottaleb, K.A., Rahut, D.B., Kruseman, G. and Erenstein, O., 2018. Changing food consumption of households in developing countries: a Bangladesh case. Journal of International Food & Agribusiness Marketing, 30(2), pp.156-174.
Myanmar GDP per capita (World Bank, 2020), Secondary data sources form Trading Economics, https://tradingeconomics.com/myanmar/gdp-per-capita
WFP, 2022. Myanmar emergency, 2022 [online], https://www.wfp.org/emergencies/myanmar-emergency