ABSTRACT
The ratio of food cost, total expenditure, and income is a useful indicator of food security at the household level. In this study, a total of 220 respondents from Nay Pyi Taw region were interviewed about their monthly food consumption, its costs, and income of their households. On average, the share of food cost was 71% of the households’ total expenditure and 63% of their income. Among the respondents, 80.45% were satisfied with their current consumption pattern, however, 65% of the respondents felt that their food cost is high. The ratio of household expenditure to income higher than 1 was found in 14% of the households while the ratio of food cost to income higher than 1 was found in 9% of the households. A large share of costs for rice, edible oil, chicken, fish, beef and pork in the total food cost was observed. Rice-based snack was commonly consumed for breakfast while, the combination of rice, meat, fish and vegetables is commonly consumed for both lunch and dinner. The common food pattern was found toward a healthy food system as the combination of diverse nutritious items. Therefore, the improving nutrition sensitive food system should be more promoted through the interventions in the production systems, value chains and distribution networks and healthy consumption pattern via affordable approach which should be disseminated by public health education program for vulnerable consumer groups. Chicken was the highly consumed meat type while pulses and eggs were also commonly consumed for protein. In this regard, pulses consumption of Myanmar people would be promoted as the cheap protein-based food item. Further research should be conducted to identify the per capita consumption and calories intakes of these important food items in these regions to further measure the food security in Nay Pyi Taw region and wider Myanmar by extension.
Keywords: Food system, Household expenditure, Consumption pattern, Food cost
INTRODUCTION
Over the past years, the increasing number of research has been conducted for food system analysis at the household level for the purpose of food security assessment. Food system studies at the household level usually provide important and valuable information for public policymakers since food is the main driver of health, nutrition, and well-being. In addition, by studying food system, the important food items will be identified which will act as important implications for policymakers such as for the aspects of supply chains, import, and export of a country.
Within the food system, INDDEX Project (2018) stated that the share of food cost in total household expenditure can be used to identify the population that may be vulnerable to economic shocks. Lele et al., (2016) also explored that the share of total household expenditure directed to household food cost acts as an important household level indicator of food security. This stems from Engel’s law which states that poorer populations generally have to allocate a larger share of their resources to access food (Zimmerman, 1932). According to the data from Knoema (2018), the average share of food cost in the income was 56.11% in Myanmar in 2018 and it was the top three highest in the world after Nigeria and Ethiopia.
Myanmar Living Conditions Survey, MLCS (2017) stated that there is a positive correlation between the ratio of food cost and income and poverty incidence in Myanmar. Therefore, in Myanmar, the higher the food cost/income ratio, the poorer the population becomes. MLCS (2017) described the food cost/income ratio of different states in Myanmar in 2017. However, the detailed ratio for each state should be further analysed especially during this COVID-19 pandemic period where there are several economic and social pressures. Therefore, this study aims to empirically identify the respondents’ household ratio of food cost, total expenditure and income of selected households in Nay Pyi Taw region. The study also observed the cost share of main food items vis a’ vis the total food cost. These findings will ultimately highlight the importance of building resilient food systems within Nay Pyi Taw region and possibly in the wider Myanmar by extension.
Ruban et al., (2018) pointed out the five food systems levels that are critically important for interventions such as (a) Production systems, (b) Value chains, (c) Distribution networks, (d) Household livelihoods, and (e) Food choices. For the development interventions to be delivered to these five systems, it is firstly important to identify the most common food items in the household food systems. There has been an increasing number of research that studies dietary intakes and consumption of eating occasions and meals (Murakami, 2017). However, little is known about the food combination pattern for meals in Myanmar. Understanding the common daily patterns of food combinations for meals at the household level can be useful for public health nutrition policymakers and development of recommendations. By studying the households’ common food consumption patterns, the commonly consumed food items are also expected to be identified.
Objectives of the study
- To estimate the ratio of household food cost, total household expenditure and income of selected households in Nay Pyi Taw
- To determine the ratio of main food item costs by total monthly food cost of selected households
- To identify the common consumption pattern of the households and their perception on their consumption pattern
METHODOLOGY
Study areas and sample selection of primary data collection
The study was implemented in Nay Pyi Taw Region in November, 2021. The respondents were from Zeyarthiri, Ottarathiri and Pobbathiri townships in Nay Pyi Taw, Myanmar. The potential respondents were the household members who were mostly managing food at the households to obtain accurate data on food consumption. The research was based on convenience sampling and the potential participants were self-selected on a voluntary way.
Method of data collection, data analysis and ethical considerations
For primary data collection, the research team visited the households, explained the purpose of the study, and solicited their voluntary participation. If the respondent agreed to be involved in the study, the interview was conducted using the structured questionnaire. In the first section, the questionnaire asked the sociodemographic information of the respondents. It was followed by the set of questions that asked the households’ monthly income, households’ monthly food cost, and households’ monthly total expenditure. A total of 36 types of combination patterns of food items were coded for the three meals: breakfast, lunch and dinner. During the interview, the income, food cost, total expenditure and the costs of main food items, food consumption pattern of the respondents’ households were subjected to the previous month to reduce the recall period bias (Smith & Subandoro, 2007).
After collecting the data, it was coded first before being loaded into EXCEL. Analysis of the data, the interpretation and the writing were carried out at the Department of Agricultural Economics of the Yezin Agricultural University. Descriptive analyses (group-level) were used to generate the sample characteristics. Several ethical issues were considered throughout the study such as the respondents’ voluntary participation, questions posed as non-personal in nature, confidentiality to be achieved by assigning a code to protect the respondents’ identity and the data to be accumulated to a group level.
RESULTS AND DISCUSSION
Demographic characteristics of respondents of selected households
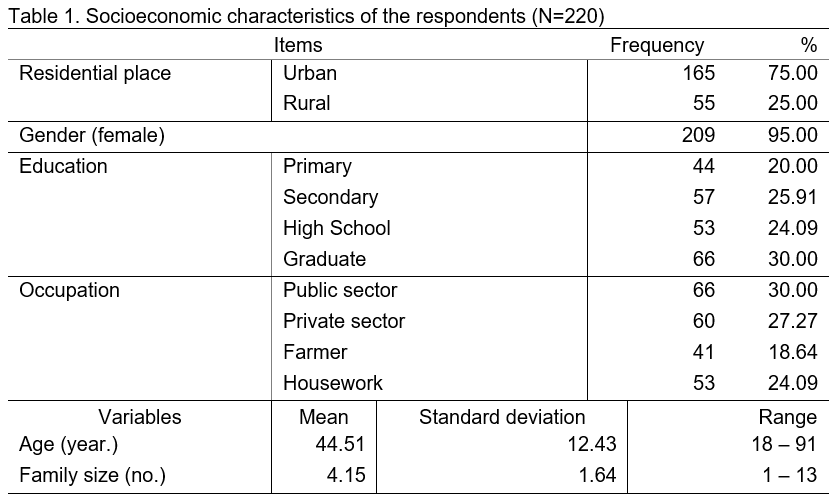
The survey was conducted from 220 sample respondents in Nay Pyi Taw Council. Table 1 shows that 95% of the respondents were females while 5% were males. This therefore reveals that majority of the respondents were females. It also shows that the mean age distribution of the respondents was 44.51 years with a standard deviation of 12.43. The family size ranged from 1 to 13 and the average was 4 persons among the respondent households. In terms of residence, 75% of the respondents reside in urban areas as their response (Table 1).
The respondents were also categorized according to their education levels and types of occupation. The graduate level respondents represent 30% of the total respondents while 20% of the respondents had primary level education, about 26% of the respondents had secondary level education and about 24% of the respondents had high school level education. Based on the categories of occupation, 19% of the respondents were farmers, 27% of the respondents worked in private sector, 30% were employed by the public sector while the rest (24%) were doing housework (Table 1).
Household’s monthly income, food cost and total expenditure of selected households
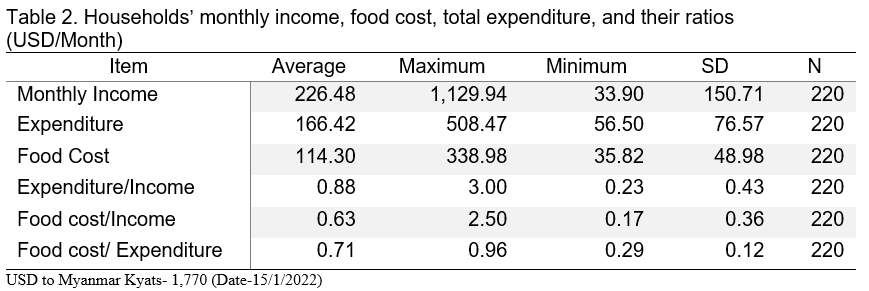
The monthly income, expenditure, and food cost of selected households in Nay Pyi Taw region are shown in Table 2. The household monthly income is the combination of all the incomes obtained from household members. The food cost is the monthly expense paid for food consumption of all the household members at the time of survey. The monthly expenditure is the combination of the household’s food cost and non-food cost within a month. As shown in Table 2, the household’s average monthly income was US$ 226.48 and ranging from US$33.90 to 1,129.94. The average household’s expenditure was US$166.42 while the highest expenditure was US$508.47 and the lowest expenditure was US$56.50 among the households. The average household’s food cost was US$114.30 while the highest household food cost was US$338.98 and the lowest household food cost was US$35.82.
The ratio of monthly income, food cost and total expenditure are also presented in Table 2. The average ratio of households’ monthly expenditure and income was 0.88 while the highest ratio was 3.00 and the lowest ratio was 0.23 among the households. Therefore, the average propensity to consume (APC) of the surveyed households was 0.88 which alarmed that about 88% of the income of the surveyed households was directed to the total expenditure while only 12% of their income was directed to their savings. The average ratio of households’ monthly food cost and their total expenditure was 0.71 while the highest ratio was 0.96 and the lowest ratio was 0.29 among the households. This indicated that the households’ food cost made up a large fraction of the households’ total expenditures.
The average ratio of households’ monthly food cost and their income was 0.63 while the highest ratio was 2.50 and the lowest ratio was 0.17 among the households. Therefore, the surveyed households in Nay Pyi Taw were spending at an average of 63% of their income on food. In Myanmar Living Conditions Survey (2017), the average share of food cost in the income was 52% in Nay Pyi Taw in 2017. Therefore, the share of food cost in income has increased in 2021 in Nay Pyi Taw. This may be due to the pressures related to COVID-19 pandemic and others.
Ratio of households’ monthly income, food cost and total expenditure (n=220)
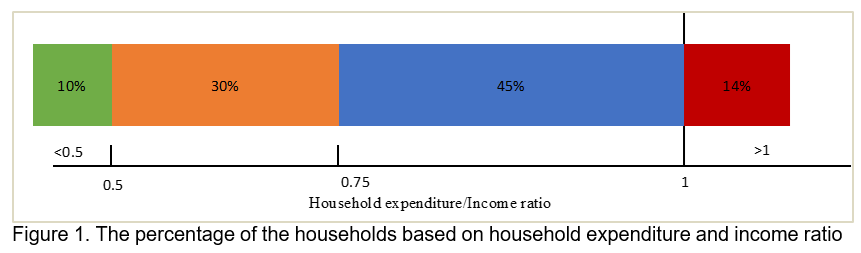
Figure 1 shows the percentage of the households based on their ratios of monthly expenditure and income. There were 10% of the surveyed households whose expenditure to income ratio was lower than 0.5. Among the surveyed households, the expenditure/income ratio of 30% of the households was between 0.5 and 0.75. The ratio between 0.75 and 1 were common with 45% of the households. It is important to note that the expenditure to income ratio higher than 1 was found in 14% of the surveyed households. Therefore, the monthly household expenditure of these 14% of the households were exceeding their income. This indicated that these households were presumably in debt.
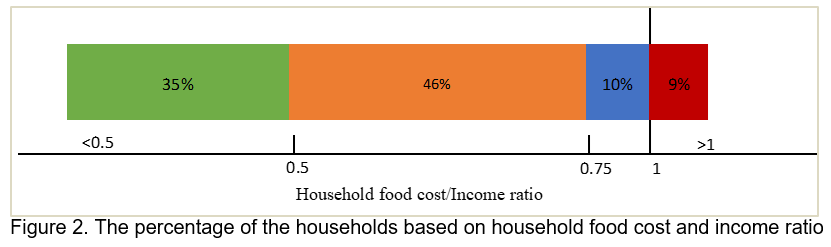
The percentage of the households based on their ratios of monthly food cost and income were explored in Figure 2. In the guidelines presented in Smith and Subandoro (2007), the households having the food cost/income ratio higher than 0.75 are usually considered as very vulnerable and shows higher level of food insecurity whereas the households with the ratio lower than 0.5 are considered to have lower levels of food insecurity. Therefore, the households with lower food cost/income ratio will be less vulnerable to food price increase. In this study, as shown in Figure 2, 35% of the households have the ratio lower than 0.5. However, the ratio higher than 0.75 and less than 1 was found in 10% of the households. In addition, 9% of the households were in the ratio of food cost and income higher than 1. This indicated that these total 19% of households are vulnerable, and food insecurity existed among them.
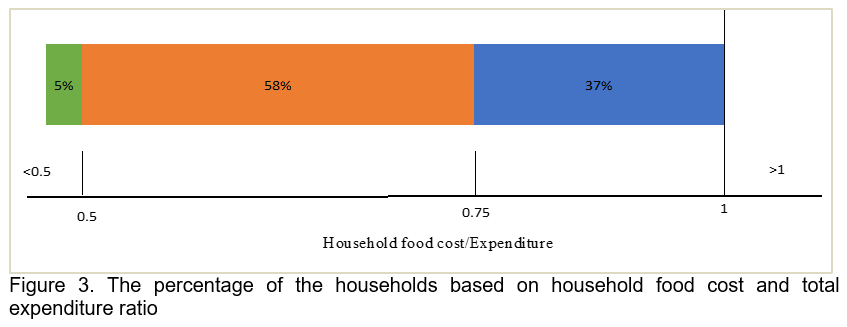
The percentage of the households based on their ratios of monthly food cost and total expenditure is shown in Figure 3. More than half of the respondents, or 58% spent the food cost and expenditure ratio between 0.5 and 0.75. Very small portion of the respondents, 5%, spent the ratio lower than 0.5. The ratio between 0.75 and 1 was found in 37% of the households. It means the food cost is the majority cost item among all items of household’s expenditure such as cost of housing, clothing, education, health, recreation and so on.
Food consumption patterns
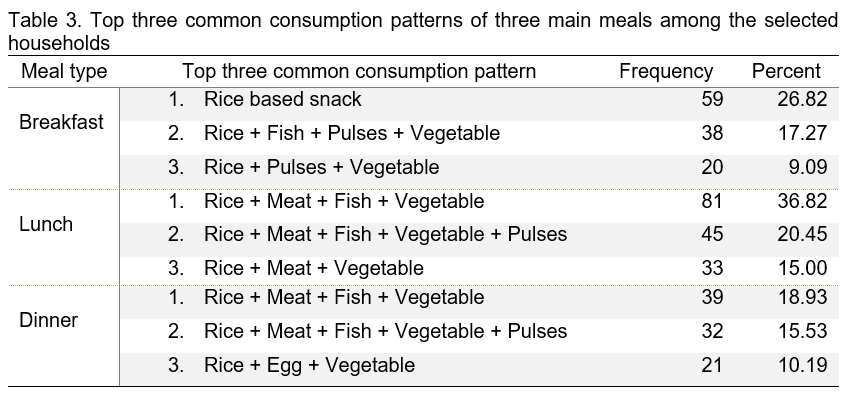
The most common combinations for the typical three main meals of a day of the households are summarized in Table 3. For breakfast, 27% of the households consumed rice-based snack while the other 17% of the households consumed the meal which contained rice, fish, pulses and vegetables and the 9% of the households consumed the meal which contained rice, pulses, and vegetables. Therefore, it can be concluded that rice, pulses, fish, and vegetables were the most frequently consumed food items for breakfast along with rice-based snacks among the surveyed households.
As shown in Table 3, the top two frequently consumed combinations for lunch and dinner were the same. The meal that contained the combination of rice, meat, fish, and vegetables was frequently consumed by the 37% of households for lunch and 19% of households for dinner. The second most consumed pattern was the meal that contained the combination of rice, meat, fish, vegetables, and pulses which were consumed by 20% of households for lunch and 16% of households for dinner. The third most consumed pattern was the meal that contained the combination of rice, meat, and vegetables consumed by the 15% of households for lunch and the combination of rice, egg and vegetable consumed by 10% of households for dinner. Therefore, it can be concluded that rice, meat, fish, and vegetables were the most frequently consumed food items for lunch and dinner, along with pulses and eggs among the surveyed households.
Ratio of main food items cost by total monthly food cost
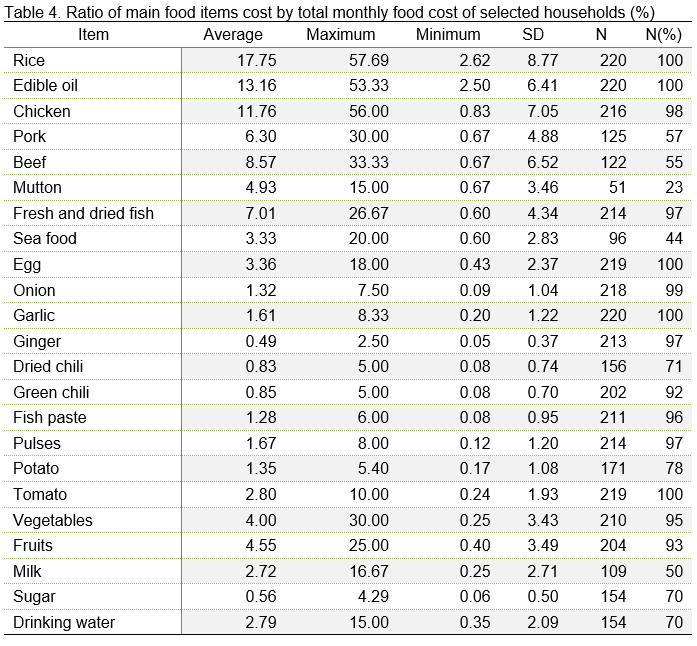
The shares of main food item costs in the total food cost are shown the Table 4. These data are obtained from calculating the monthly consumed quantity of these items and the price paid for per unit of measure. It included the common food items typically consumed in the Myanmar households. Rice, edible oil and chicken contributed the highest share of costs in the total food cost. On average, 17.75% of the total food cost were taken up by rice cost while 13.16% were taken up by edible oil cost and 11.76% of the total food cost were paid for chicken.
For 55% of the households who consume beef, 8.57% of the food cost were paid for the cost of beef on average. For 57% of the households who consume pork, 6.30% of the food cost were paid for the cost of pork on average. For 23% of the households who consume mutton, 4.93% of the food cost were paid for the cost of mutton on average. For 44% of the households who consume seafood, 3.33% of the food cost were paid for the cost of seafood on average. The cost of fish contributed 7.01% of the total cost while the cost of egg contributed 3.36% on average. The food items that are mostly required for food preparation are also added in Table 4. This includes onion, garlic, ginger, dried chili, and green chili which took the average share cost ratio of 1.32, 1.61, 0.49, 0.83 and 0.85 respectively. The share cost ratios of pulses, potato, and tomato were also recorded separately in addition to the costs of vegetables. These items contributed 1.67, 1.35, 2.8 and 4.00 respectively. Fish paste is known to be commonly consumed by Myanmar people as a main ingredient used as an additive in most dishes of Myanmar cuisines or directly consumed baked or roasted as a side dish. Therefore, the cost of fish paste is also recorded in this study. On average, it took up 1.26% of the total food cost among the surveyed households. The ratio of the monthly costs of fruits, milk, sugar and drinking water by the total monthly food cost is also shown in Table 4.
Perceptions of selected households on food consumption pattern
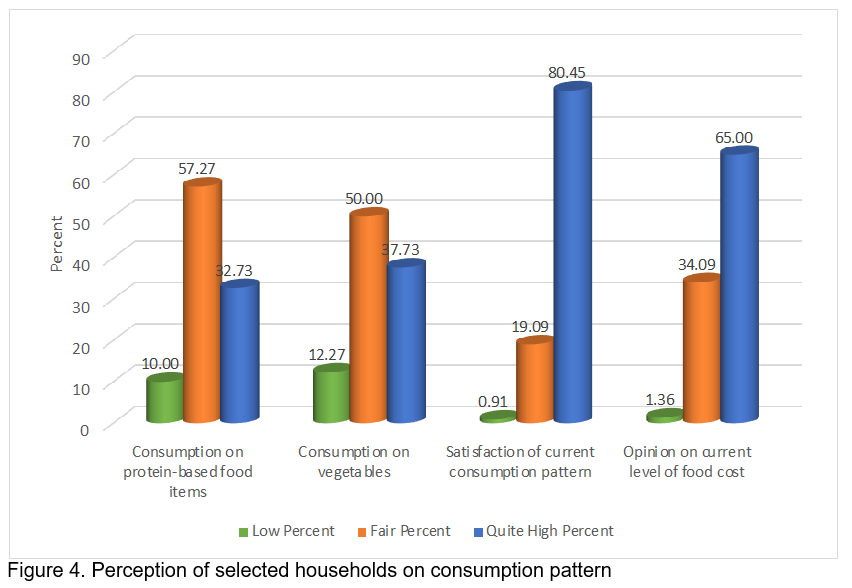
The following section presents the perceptions of respondents on their food consumption pattern. As shown in Figure 4, 57% of the respondents said that their protein intake amount in their meals were on average. In contrast, 10% of the respondents stated that their protein intake amount in their meals were on low while 33% of the respondents assumed that they consumed high amount of protein in their diets. For vegetable consumption in their diets, 50% of the respondents stated that they consume fair amount of vegetables while the other 38% of the respondents presumed that their vegetable intake in their diets were quite high. On the other hand, 12% of the respondents specified that their vegetable consumption was low. When asked about their satisfaction on current food consumption pattern, nearly all the surveyed respondents stated that they were satisfied with their consumption (Figure 4). Among them, 80% of the respondents were quite satisfied while 19% were fairly satisfied with their current food consumption pattern. Although a very high percentage of the respondents were satisfied with their consumption, 65% stated that the current levels of food expenses were quite high to them. Only 1% of the respondents said that their food costs were low while 34% of the respondents think that their food costs were on average (Figure 4).
CONCLUSION AND RECOMMENDATION
A number of food security research experts stated that having a large share of food cost in the households’ total expenditure and income indicated that the population may be vulnerable to economic shocks. In this study, although 99% of the respondents were satisfied with their current consumption pattern, 65% of the respondents felt that their food expenditure is quite high. On average, the surveyed households were found to have a high food cost to income ratio of 0.63 and high food cost to total expenditure ratio of 0.71. The share of food cost was 71% in the total expenditure and 63% in the income.
Among the 37% of the surveyed households, the ratio of food cost to total expenditure was between 0.75 and 1. This percentage of the households having large share of food cost in expenditure indicated that these households are vulnerable when food price increases and other shocks occur. In addition, in 14% of the households, the ratio of food expenditure to income was more than 1. These households are at risk to food deprivation because reduction in their income would likely result in reduction of food consumption or the quality of food eaten (INDDEX, 2018). This is because the households that are already consuming low-cost energy source food items will be unable to substitute cheaper food and therefore will be forced to reduce the quantity they consume. Therefore, the study population in Nay Pyi Taw region are in need of special attention and interventions from the government and development programs for the protection against the shocks and foundation of resilient food systems especially for some households that are at risks.
Among the total food cost, a large ratio was directed to the costs of rice, edible oil, chicken, fish, beef and pork. The commonly consumed pattern for breakfast among the households was rice-based snack. The combination of rice, meat, fish and vegetables is commonly consumed by the households for both lunch and dinner. In conclusion, rice, meat, fish, vegetables, eggs and pulses were the main food items commonly consumed among the surveyed households. The common food pattern in the study area was found toward a healthy food system as the combination of diverse nutritious items. Therefore, the improving nutrition sensitive food system should be more promoted through delivering the interventions in the production systems, value chains and distribution networks of these main food items. Moreover, healthy consumption pattern via affordable approach should be disseminated by public health education program with special attention to vulnerable consumer group.
Regarding the protein-based food items, in the majority of surveyed households, chicken acted as a main protein source and pulses and eggs acted as the protein substitutes. Actually, Myanmar is a leading country in pulses production and export among the ASEAN, pulses consumption of Myanmar people would be promoted as the cheap protein-based food item. Importantly, further researches need to be conducted to identify the per capita consumption of the important food items in Nay Pyi Taw regions and wider Myanmar by extension.
REFERENCES
Zimmerman, C. C. (1932). Ernst Engel's law of expenditures for food. The Quarterly Journal of Economics, 47(1), 78-101.
Lele, U., Masters, W. A., Kinabo, J., Meenakshi, J. V., Ramaswami, B., Tagwireyi, J., & Goswami, S. (2016). Measuring food and nutrition security: An independent technical assessment and user’s guide for existing indicators. Rome: Food Security Information Network, Measuring Food and Nutrition Security Technical Working Group, 177.
INDDEX Project (2018), Data4Diets: Building Blocks for Diet-related Food Security Analysis. Tufts University, Boston, MA. https://inddex.nutrition.tufts.edu/data4diets. Accessed on 2 January 2022.
Smith, L. C., & Subandoro, A. (2007). Measuring food security using household expenditure surveys (Vol. 3). Intl Food Policy Res Inst.
Murakami, K., Livingstone, M. B. E., & Sasaki, S. (2017). Establishment of a meal coding system for the characterization of meal-based dietary patterns in Japan. The Journal of nutrition, 147(11), 2093-2101.
Myint, O. M. (2020); Consumer Attitude and Purchase Intention towards Organic Foods in Myanmar; International Journal of Scientific and Research Publications (IJSRP) 10(05) (ISSN: 2250-3153), DOI: http://dx.doi.org/10.29322/IJSRP.10.05.2020.p101101
Consumer Attitude and Purchase Intention towards Organic Foods in Myanmar.
Ruben, R., Verhagen, J., & Plaisier, C. (2018). The challenge of food systems research: what difference does it make?. Towards Sustainable Global Food Systems, 11(1), 171.
Knoema (2018) Expenditure spent on food. Accessed on 10 January 2022. https://knoema.com/atlas/topics/Food-Security/Expenditures-Spent-on-Food/Expenditures-spent-on-food


Myanmar’s household food system: the common daily food patterns and their costs in Nay Pyi Taw
ABSTRACT
The ratio of food cost, total expenditure, and income is a useful indicator of food security at the household level. In this study, a total of 220 respondents from Nay Pyi Taw region were interviewed about their monthly food consumption, its costs, and income of their households. On average, the share of food cost was 71% of the households’ total expenditure and 63% of their income. Among the respondents, 80.45% were satisfied with their current consumption pattern, however, 65% of the respondents felt that their food cost is high. The ratio of household expenditure to income higher than 1 was found in 14% of the households while the ratio of food cost to income higher than 1 was found in 9% of the households. A large share of costs for rice, edible oil, chicken, fish, beef and pork in the total food cost was observed. Rice-based snack was commonly consumed for breakfast while, the combination of rice, meat, fish and vegetables is commonly consumed for both lunch and dinner. The common food pattern was found toward a healthy food system as the combination of diverse nutritious items. Therefore, the improving nutrition sensitive food system should be more promoted through the interventions in the production systems, value chains and distribution networks and healthy consumption pattern via affordable approach which should be disseminated by public health education program for vulnerable consumer groups. Chicken was the highly consumed meat type while pulses and eggs were also commonly consumed for protein. In this regard, pulses consumption of Myanmar people would be promoted as the cheap protein-based food item. Further research should be conducted to identify the per capita consumption and calories intakes of these important food items in these regions to further measure the food security in Nay Pyi Taw region and wider Myanmar by extension.
Keywords: Food system, Household expenditure, Consumption pattern, Food cost
INTRODUCTION
Over the past years, the increasing number of research has been conducted for food system analysis at the household level for the purpose of food security assessment. Food system studies at the household level usually provide important and valuable information for public policymakers since food is the main driver of health, nutrition, and well-being. In addition, by studying food system, the important food items will be identified which will act as important implications for policymakers such as for the aspects of supply chains, import, and export of a country.
Within the food system, INDDEX Project (2018) stated that the share of food cost in total household expenditure can be used to identify the population that may be vulnerable to economic shocks. Lele et al., (2016) also explored that the share of total household expenditure directed to household food cost acts as an important household level indicator of food security. This stems from Engel’s law which states that poorer populations generally have to allocate a larger share of their resources to access food (Zimmerman, 1932). According to the data from Knoema (2018), the average share of food cost in the income was 56.11% in Myanmar in 2018 and it was the top three highest in the world after Nigeria and Ethiopia.
Myanmar Living Conditions Survey, MLCS (2017) stated that there is a positive correlation between the ratio of food cost and income and poverty incidence in Myanmar. Therefore, in Myanmar, the higher the food cost/income ratio, the poorer the population becomes. MLCS (2017) described the food cost/income ratio of different states in Myanmar in 2017. However, the detailed ratio for each state should be further analysed especially during this COVID-19 pandemic period where there are several economic and social pressures. Therefore, this study aims to empirically identify the respondents’ household ratio of food cost, total expenditure and income of selected households in Nay Pyi Taw region. The study also observed the cost share of main food items vis a’ vis the total food cost. These findings will ultimately highlight the importance of building resilient food systems within Nay Pyi Taw region and possibly in the wider Myanmar by extension.
Ruban et al., (2018) pointed out the five food systems levels that are critically important for interventions such as (a) Production systems, (b) Value chains, (c) Distribution networks, (d) Household livelihoods, and (e) Food choices. For the development interventions to be delivered to these five systems, it is firstly important to identify the most common food items in the household food systems. There has been an increasing number of research that studies dietary intakes and consumption of eating occasions and meals (Murakami, 2017). However, little is known about the food combination pattern for meals in Myanmar. Understanding the common daily patterns of food combinations for meals at the household level can be useful for public health nutrition policymakers and development of recommendations. By studying the households’ common food consumption patterns, the commonly consumed food items are also expected to be identified.
Objectives of the study
METHODOLOGY
Study areas and sample selection of primary data collection
The study was implemented in Nay Pyi Taw Region in November, 2021. The respondents were from Zeyarthiri, Ottarathiri and Pobbathiri townships in Nay Pyi Taw, Myanmar. The potential respondents were the household members who were mostly managing food at the households to obtain accurate data on food consumption. The research was based on convenience sampling and the potential participants were self-selected on a voluntary way.
Method of data collection, data analysis and ethical considerations
For primary data collection, the research team visited the households, explained the purpose of the study, and solicited their voluntary participation. If the respondent agreed to be involved in the study, the interview was conducted using the structured questionnaire. In the first section, the questionnaire asked the sociodemographic information of the respondents. It was followed by the set of questions that asked the households’ monthly income, households’ monthly food cost, and households’ monthly total expenditure. A total of 36 types of combination patterns of food items were coded for the three meals: breakfast, lunch and dinner. During the interview, the income, food cost, total expenditure and the costs of main food items, food consumption pattern of the respondents’ households were subjected to the previous month to reduce the recall period bias (Smith & Subandoro, 2007).
After collecting the data, it was coded first before being loaded into EXCEL. Analysis of the data, the interpretation and the writing were carried out at the Department of Agricultural Economics of the Yezin Agricultural University. Descriptive analyses (group-level) were used to generate the sample characteristics. Several ethical issues were considered throughout the study such as the respondents’ voluntary participation, questions posed as non-personal in nature, confidentiality to be achieved by assigning a code to protect the respondents’ identity and the data to be accumulated to a group level.
RESULTS AND DISCUSSION
Demographic characteristics of respondents of selected households
The survey was conducted from 220 sample respondents in Nay Pyi Taw Council. Table 1 shows that 95% of the respondents were females while 5% were males. This therefore reveals that majority of the respondents were females. It also shows that the mean age distribution of the respondents was 44.51 years with a standard deviation of 12.43. The family size ranged from 1 to 13 and the average was 4 persons among the respondent households. In terms of residence, 75% of the respondents reside in urban areas as their response (Table 1).
The respondents were also categorized according to their education levels and types of occupation. The graduate level respondents represent 30% of the total respondents while 20% of the respondents had primary level education, about 26% of the respondents had secondary level education and about 24% of the respondents had high school level education. Based on the categories of occupation, 19% of the respondents were farmers, 27% of the respondents worked in private sector, 30% were employed by the public sector while the rest (24%) were doing housework (Table 1).
Household’s monthly income, food cost and total expenditure of selected households
The monthly income, expenditure, and food cost of selected households in Nay Pyi Taw region are shown in Table 2. The household monthly income is the combination of all the incomes obtained from household members. The food cost is the monthly expense paid for food consumption of all the household members at the time of survey. The monthly expenditure is the combination of the household’s food cost and non-food cost within a month. As shown in Table 2, the household’s average monthly income was US$ 226.48 and ranging from US$33.90 to 1,129.94. The average household’s expenditure was US$166.42 while the highest expenditure was US$508.47 and the lowest expenditure was US$56.50 among the households. The average household’s food cost was US$114.30 while the highest household food cost was US$338.98 and the lowest household food cost was US$35.82.
The ratio of monthly income, food cost and total expenditure are also presented in Table 2. The average ratio of households’ monthly expenditure and income was 0.88 while the highest ratio was 3.00 and the lowest ratio was 0.23 among the households. Therefore, the average propensity to consume (APC) of the surveyed households was 0.88 which alarmed that about 88% of the income of the surveyed households was directed to the total expenditure while only 12% of their income was directed to their savings. The average ratio of households’ monthly food cost and their total expenditure was 0.71 while the highest ratio was 0.96 and the lowest ratio was 0.29 among the households. This indicated that the households’ food cost made up a large fraction of the households’ total expenditures.
The average ratio of households’ monthly food cost and their income was 0.63 while the highest ratio was 2.50 and the lowest ratio was 0.17 among the households. Therefore, the surveyed households in Nay Pyi Taw were spending at an average of 63% of their income on food. In Myanmar Living Conditions Survey (2017), the average share of food cost in the income was 52% in Nay Pyi Taw in 2017. Therefore, the share of food cost in income has increased in 2021 in Nay Pyi Taw. This may be due to the pressures related to COVID-19 pandemic and others.
Ratio of households’ monthly income, food cost and total expenditure (n=220)
Figure 1 shows the percentage of the households based on their ratios of monthly expenditure and income. There were 10% of the surveyed households whose expenditure to income ratio was lower than 0.5. Among the surveyed households, the expenditure/income ratio of 30% of the households was between 0.5 and 0.75. The ratio between 0.75 and 1 were common with 45% of the households. It is important to note that the expenditure to income ratio higher than 1 was found in 14% of the surveyed households. Therefore, the monthly household expenditure of these 14% of the households were exceeding their income. This indicated that these households were presumably in debt.
The percentage of the households based on their ratios of monthly food cost and income were explored in Figure 2. In the guidelines presented in Smith and Subandoro (2007), the households having the food cost/income ratio higher than 0.75 are usually considered as very vulnerable and shows higher level of food insecurity whereas the households with the ratio lower than 0.5 are considered to have lower levels of food insecurity. Therefore, the households with lower food cost/income ratio will be less vulnerable to food price increase. In this study, as shown in Figure 2, 35% of the households have the ratio lower than 0.5. However, the ratio higher than 0.75 and less than 1 was found in 10% of the households. In addition, 9% of the households were in the ratio of food cost and income higher than 1. This indicated that these total 19% of households are vulnerable, and food insecurity existed among them.
The percentage of the households based on their ratios of monthly food cost and total expenditure is shown in Figure 3. More than half of the respondents, or 58% spent the food cost and expenditure ratio between 0.5 and 0.75. Very small portion of the respondents, 5%, spent the ratio lower than 0.5. The ratio between 0.75 and 1 was found in 37% of the households. It means the food cost is the majority cost item among all items of household’s expenditure such as cost of housing, clothing, education, health, recreation and so on.
Food consumption patterns
The most common combinations for the typical three main meals of a day of the households are summarized in Table 3. For breakfast, 27% of the households consumed rice-based snack while the other 17% of the households consumed the meal which contained rice, fish, pulses and vegetables and the 9% of the households consumed the meal which contained rice, pulses, and vegetables. Therefore, it can be concluded that rice, pulses, fish, and vegetables were the most frequently consumed food items for breakfast along with rice-based snacks among the surveyed households.
As shown in Table 3, the top two frequently consumed combinations for lunch and dinner were the same. The meal that contained the combination of rice, meat, fish, and vegetables was frequently consumed by the 37% of households for lunch and 19% of households for dinner. The second most consumed pattern was the meal that contained the combination of rice, meat, fish, vegetables, and pulses which were consumed by 20% of households for lunch and 16% of households for dinner. The third most consumed pattern was the meal that contained the combination of rice, meat, and vegetables consumed by the 15% of households for lunch and the combination of rice, egg and vegetable consumed by 10% of households for dinner. Therefore, it can be concluded that rice, meat, fish, and vegetables were the most frequently consumed food items for lunch and dinner, along with pulses and eggs among the surveyed households.
Ratio of main food items cost by total monthly food cost
The shares of main food item costs in the total food cost are shown the Table 4. These data are obtained from calculating the monthly consumed quantity of these items and the price paid for per unit of measure. It included the common food items typically consumed in the Myanmar households. Rice, edible oil and chicken contributed the highest share of costs in the total food cost. On average, 17.75% of the total food cost were taken up by rice cost while 13.16% were taken up by edible oil cost and 11.76% of the total food cost were paid for chicken.
For 55% of the households who consume beef, 8.57% of the food cost were paid for the cost of beef on average. For 57% of the households who consume pork, 6.30% of the food cost were paid for the cost of pork on average. For 23% of the households who consume mutton, 4.93% of the food cost were paid for the cost of mutton on average. For 44% of the households who consume seafood, 3.33% of the food cost were paid for the cost of seafood on average. The cost of fish contributed 7.01% of the total cost while the cost of egg contributed 3.36% on average. The food items that are mostly required for food preparation are also added in Table 4. This includes onion, garlic, ginger, dried chili, and green chili which took the average share cost ratio of 1.32, 1.61, 0.49, 0.83 and 0.85 respectively. The share cost ratios of pulses, potato, and tomato were also recorded separately in addition to the costs of vegetables. These items contributed 1.67, 1.35, 2.8 and 4.00 respectively. Fish paste is known to be commonly consumed by Myanmar people as a main ingredient used as an additive in most dishes of Myanmar cuisines or directly consumed baked or roasted as a side dish. Therefore, the cost of fish paste is also recorded in this study. On average, it took up 1.26% of the total food cost among the surveyed households. The ratio of the monthly costs of fruits, milk, sugar and drinking water by the total monthly food cost is also shown in Table 4.
Perceptions of selected households on food consumption pattern
The following section presents the perceptions of respondents on their food consumption pattern. As shown in Figure 4, 57% of the respondents said that their protein intake amount in their meals were on average. In contrast, 10% of the respondents stated that their protein intake amount in their meals were on low while 33% of the respondents assumed that they consumed high amount of protein in their diets. For vegetable consumption in their diets, 50% of the respondents stated that they consume fair amount of vegetables while the other 38% of the respondents presumed that their vegetable intake in their diets were quite high. On the other hand, 12% of the respondents specified that their vegetable consumption was low. When asked about their satisfaction on current food consumption pattern, nearly all the surveyed respondents stated that they were satisfied with their consumption (Figure 4). Among them, 80% of the respondents were quite satisfied while 19% were fairly satisfied with their current food consumption pattern. Although a very high percentage of the respondents were satisfied with their consumption, 65% stated that the current levels of food expenses were quite high to them. Only 1% of the respondents said that their food costs were low while 34% of the respondents think that their food costs were on average (Figure 4).
CONCLUSION AND RECOMMENDATION
A number of food security research experts stated that having a large share of food cost in the households’ total expenditure and income indicated that the population may be vulnerable to economic shocks. In this study, although 99% of the respondents were satisfied with their current consumption pattern, 65% of the respondents felt that their food expenditure is quite high. On average, the surveyed households were found to have a high food cost to income ratio of 0.63 and high food cost to total expenditure ratio of 0.71. The share of food cost was 71% in the total expenditure and 63% in the income.
Among the 37% of the surveyed households, the ratio of food cost to total expenditure was between 0.75 and 1. This percentage of the households having large share of food cost in expenditure indicated that these households are vulnerable when food price increases and other shocks occur. In addition, in 14% of the households, the ratio of food expenditure to income was more than 1. These households are at risk to food deprivation because reduction in their income would likely result in reduction of food consumption or the quality of food eaten (INDDEX, 2018). This is because the households that are already consuming low-cost energy source food items will be unable to substitute cheaper food and therefore will be forced to reduce the quantity they consume. Therefore, the study population in Nay Pyi Taw region are in need of special attention and interventions from the government and development programs for the protection against the shocks and foundation of resilient food systems especially for some households that are at risks.
Among the total food cost, a large ratio was directed to the costs of rice, edible oil, chicken, fish, beef and pork. The commonly consumed pattern for breakfast among the households was rice-based snack. The combination of rice, meat, fish and vegetables is commonly consumed by the households for both lunch and dinner. In conclusion, rice, meat, fish, vegetables, eggs and pulses were the main food items commonly consumed among the surveyed households. The common food pattern in the study area was found toward a healthy food system as the combination of diverse nutritious items. Therefore, the improving nutrition sensitive food system should be more promoted through delivering the interventions in the production systems, value chains and distribution networks of these main food items. Moreover, healthy consumption pattern via affordable approach should be disseminated by public health education program with special attention to vulnerable consumer group.
Regarding the protein-based food items, in the majority of surveyed households, chicken acted as a main protein source and pulses and eggs acted as the protein substitutes. Actually, Myanmar is a leading country in pulses production and export among the ASEAN, pulses consumption of Myanmar people would be promoted as the cheap protein-based food item. Importantly, further researches need to be conducted to identify the per capita consumption of the important food items in Nay Pyi Taw regions and wider Myanmar by extension.
REFERENCES
Zimmerman, C. C. (1932). Ernst Engel's law of expenditures for food. The Quarterly Journal of Economics, 47(1), 78-101.
Lele, U., Masters, W. A., Kinabo, J., Meenakshi, J. V., Ramaswami, B., Tagwireyi, J., & Goswami, S. (2016). Measuring food and nutrition security: An independent technical assessment and user’s guide for existing indicators. Rome: Food Security Information Network, Measuring Food and Nutrition Security Technical Working Group, 177.
INDDEX Project (2018), Data4Diets: Building Blocks for Diet-related Food Security Analysis. Tufts University, Boston, MA. https://inddex.nutrition.tufts.edu/data4diets. Accessed on 2 January 2022.
Smith, L. C., & Subandoro, A. (2007). Measuring food security using household expenditure surveys (Vol. 3). Intl Food Policy Res Inst.
Murakami, K., Livingstone, M. B. E., & Sasaki, S. (2017). Establishment of a meal coding system for the characterization of meal-based dietary patterns in Japan. The Journal of nutrition, 147(11), 2093-2101.
Myint, O. M. (2020); Consumer Attitude and Purchase Intention towards Organic Foods in Myanmar; International Journal of Scientific and Research Publications (IJSRP) 10(05) (ISSN: 2250-3153), DOI: http://dx.doi.org/10.29322/IJSRP.10.05.2020.p101101
Consumer Attitude and Purchase Intention towards Organic Foods in Myanmar.
Ruben, R., Verhagen, J., & Plaisier, C. (2018). The challenge of food systems research: what difference does it make?. Towards Sustainable Global Food Systems, 11(1), 171.
Knoema (2018) Expenditure spent on food. Accessed on 10 January 2022. https://knoema.com/atlas/topics/Food-Security/Expenditures-Spent-on-Food/Expenditures-spent-on-food