Statistics Korea (KOSTAT) had quarterly implemented the Household Income and Expenditure Survey (HIES) to analyze households’ current conditions and changes of living. This article analyzes the state and the prospects of Korean households’ expenditure on processed foods in 2018, based on the raw data analsis of the Household Income and Expenditure Survey conducted by Statistics Korea. In addition, we focused on the expenditure on processed foods of Korean Households by a set of demographic factors, including age of household head and household size.
HOUSEHOLD EXPENDITURE ON FOOD IN 2018
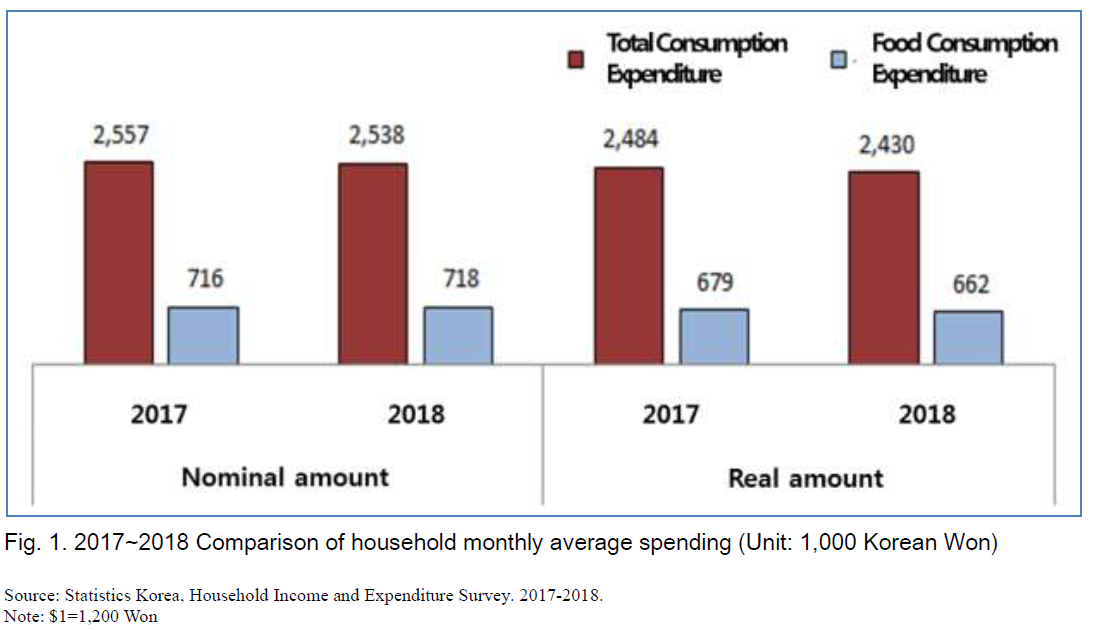
In 2018, the status of the average monthly expenditure on food expenses in Korea (including liquor and eating out) increased 0.2% from $597($1 = 1,200 Won, hearafter) in 2017 to $598, however, given inflation the actual food expense expenditure decreased by 2.6% to $552.
The percentage of total consumer spending that was taken up by food expenses (Engel Coefficient) increased slightly from 28.0% in 2017 to 28.3% in 2018. As income increases, the expected phenomenon is for the consumer expenses on foods which are basic necessities to decrease, however, the Engel Coefficient shows a small increasing trend due to the decrease in consumption in other industries, the increase in food prices, the varying and externalized dietary life, the increase in those focused on well-being/YOLO, and the rise in value-consciousness all seem to have played a role in this phenomenon.
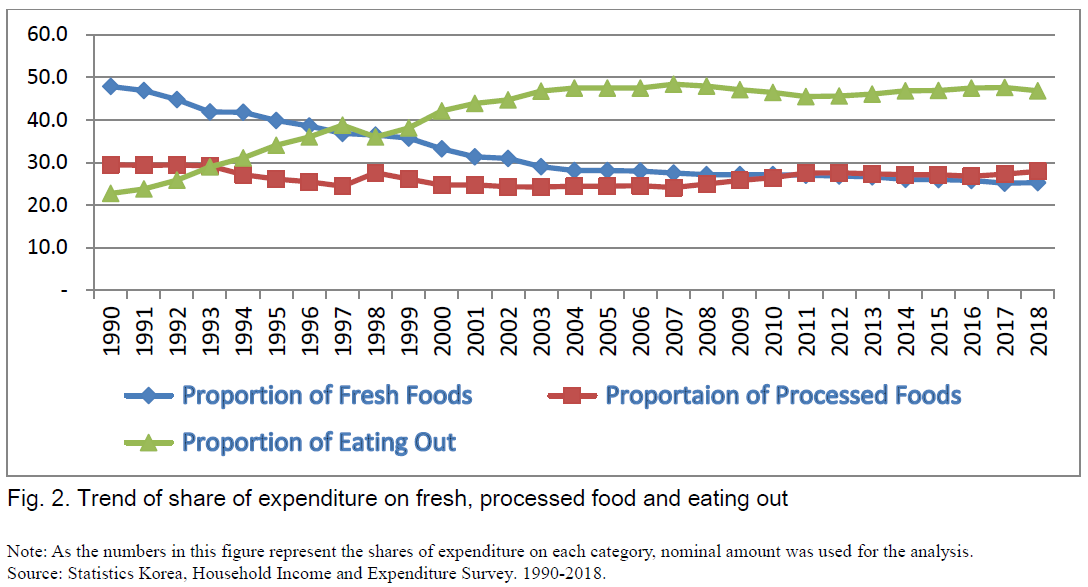
When looking at the ratio of food in households to fresh food expenditure, processed foods expenditure, and eating out, the proportion of eating out increased rapidly in the 1990s and came close to half, but it began to decline slightly since the early 2000s, while the proportion of processed foods remained constant until the 2000s, but began to increase in 2010.
The ratio for processed food expenditure showed an increasing trend in 2018. Processed food expenditure increased 0.6%p from 27.3% in 2017 to 27.9% in 2018 but eating out had a 46.8% decrease 0.8%p yearly. In 2018 the average expenses to eat out decreased 1.4% from $284 in 2017 to $280 in 2018, while processed food costs increased 2.6% from $163 in 2017 to $167 in 2018.
HOUSEHOLD FOOD EXPENDITURE BY EATEGORY OF PROCESSED FOODS IN 2018
When looking at the expenditures and trend of processed food expenses by category, grain processed products (flour/noodles/ramens/starch noodles/tofu, etc.) have the highest percentage at 20.1%, followed by sugars and snacks (13.0%), milk products (10.2%), other foods (10.0%), and processed fish products (9.6%).
The processed foods that showed the highest expenditure increase was other foods (porridges and soups/baby food/side dishes/kimchi/instant․frozen foods), showing the increase of 0.8% yearly by increasing the expenditure about 2,000 Won per household. For other foods, the consumption of porridges and soups, side dishes, Kimchi, instant frozen food have increased except baby foods. Especially, instant frozen food showed relatively sharp increase from $6.3 per household last year to $7.3 (15.7%)
Fruit products increased by $0.4 in 2018 compared to 2017, spending $3.3 per household, but the rate of increase was 12.1% which was the highest increase. Household monthly average expenditures compared to 2017 decreased sharply in 2018 to 19,306 Won decreasing by 5.5%, or $0.9.
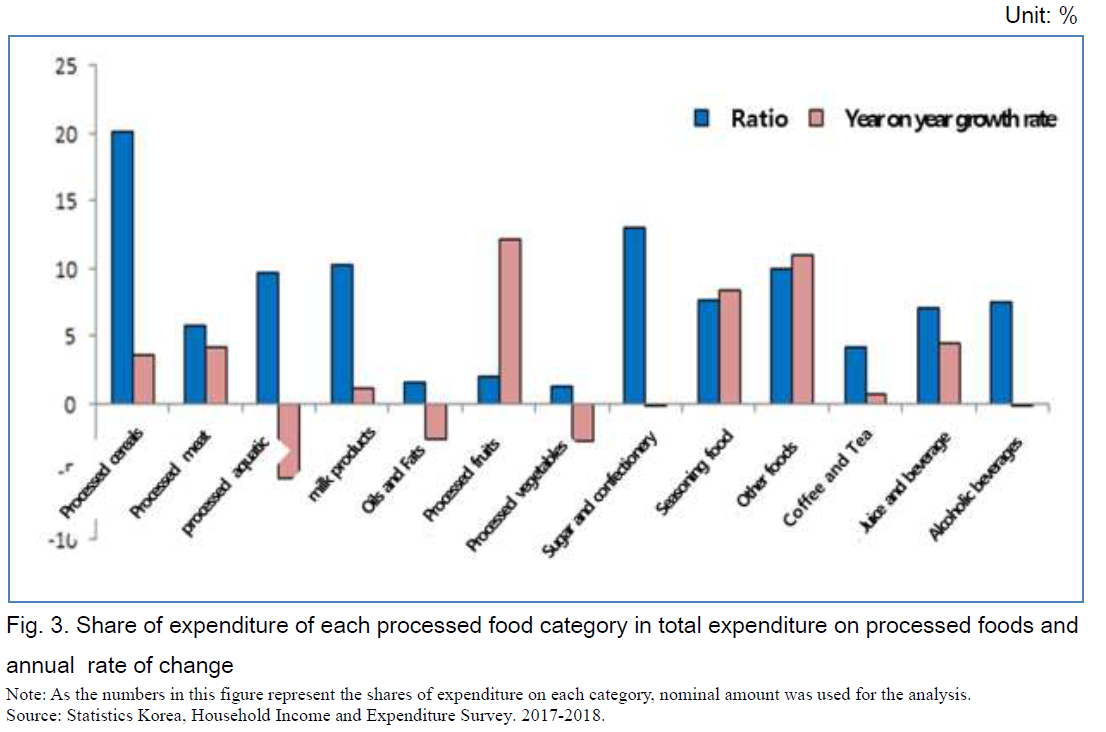
Table 1. Share of expenditure by category of processed foods, 2017-2018
|
Item category
|
2017 (Won)
|
2018 (Won)
|
Change (2018-2017)
|
|
Expenditure (Won)
|
Share (%)
|
Expenditure (Won)
|
Share (%)
|
Expenditure
(Won)
|
Share (%p)
|
Rate of change
(%)
|
|
Grain processed
|
38,822
|
19.9
|
40,220
|
20.1
|
1,398
|
0.2
|
3.6
|
|
Meat processed
|
11,138
|
5.7
|
11,606
|
5.8
|
468
|
0.1
|
4.2
|
|
Fishery processed
|
20,437
|
10.5
|
19,306
|
9.6
|
-1,131
|
-0.9
|
-5.5
|
|
Milk processed
|
20,304
|
10.4
|
20,533
|
10.2
|
229
|
-0.2
|
1.1
|
|
Fat and oils
|
3,012
|
1.5
|
2,931
|
1.5
|
-81
|
n/a
|
-2.7
|
|
Fruit processed products
|
3,576
|
1.8
|
4,010
|
2.0
|
434
|
0.2
|
12.1
|
|
Vegetable processed products
|
2,609
|
1.3
|
2,535
|
1.3
|
-74
|
n/a
|
-2.8
|
|
Sugars and snacks
|
26,141
|
13.4
|
26,122
|
13.0
|
-19
|
-0.4
|
-0.1
|
|
Seasoned foods
|
14,050
|
7.2
|
15,216
|
7.6
|
1,166
|
0.4
|
8.3
|
|
Other foods
|
17,968
|
9.2
|
19,950
|
10.0
|
1,982
|
0.8
|
11.0
|
|
Coffees and teas
|
8,437
|
4.3
|
8,499
|
4.2
|
62
|
-0.1
|
0.7
|
|
Juices and beverages
|
13,720
|
7.0
|
14,318
|
7.1
|
598
|
0.1
|
4.4
|
|
Liquor
|
15,115
|
7.7
|
15,092
|
7.5
|
-23
|
-0.2
|
-0.2
|
|
Total
|
195,328
|
100.0
|
200,338
|
100.0
|
5,009
|
n/a
|
2.6
|
Note: As some of the numbers in this table represent the shares of expenditure on each category, nominal amount was used for the analysis. Exchange rate: $1=1,200 Won
Source: Statistics Korea, Household Income and Expenditure Survey. 2017-2018.
MAJOR PROCESSED FOOD ITEMS PURCHASED BY KOREAN HOUSEHOLDS: YEAR 2018 COMPARED TO PREVIOUS YEARS
As a result of analyzing commonly consumed processed food based on the expenditures occupied by items of processed foods, the first place in 2018 were breads and snacks, the second place were Korean Traditional sweets and other Snacks, and the third place was milk, which was the same order in 2017.
In 2018, the expenditures on processed food item had a rapid increasing trend in the instant frozen foods section. The expenditure on instant frozen food was 3.9% in 2017, occupied in the 5th place, but in 2018, it became 4th place, increased by 0.5%p. Beers have not been changed but as for the importance of the instant frozen food increase, it landed on 5th place.
Table 2. Trend of top 30 items of household monthly average spending among processed food items
Unit: %
|
2010
|
2017
|
2018
|
|
1.
|
Milk
|
8.4
|
1.
|
Loaf breads and other breads
|
7.3
|
1.
|
Loaf breads and other breads
|
7.4
|
|
2.
|
Loaf breads and other breads
|
7.2
|
2.
|
Korean traditional sweets and snacks
|
7.1
|
2.
|
Korean Traditional Sweets and Snacks
|
6.8
|
|
3.
|
Korean traditional sweets and snacks
|
7.2
|
3.
|
Milk
|
5.2
|
3.
|
Milk
|
5.0
|
|
4.
|
Ramens
|
3.4
|
4.
|
Beer
|
4.0
|
4.
|
Instant frozen food
|
4.4
|
|
5.
|
Coffee
|
3.3
|
5.
|
Instant Frozen Food
|
3.9
|
5.
|
Beer
|
4.0
|
|
6.
|
Other meat processed foods
|
3.3
|
6.
|
Other meat processed Food
|
3.5
|
6.
|
Other meat processed foods
|
3.7
|
|
7.
|
Ice ceam
|
3.3
|
7.
|
Coffee
|
3.4
|
7.
|
Other beverages
|
3.3
|
|
8.
|
Yogurt
|
3.2
|
8.
|
Other beverages
|
3.3
|
8.
|
Coffee
|
3.2
|
|
9.
|
Other beverages
|
3.2
|
9.
|
Ramens
|
3.1
|
9.
|
Dried red pepper
|
3.1
|
|
10.
|
Rice cake
|
2.9
|
10.
|
Ice cream
|
3.0
|
10.
|
Ramens
|
3.1
|
|
11.
|
Fruit and vegetable juice
|
2.7
|
11.
|
Dried red pepper
|
2.7
|
11.
|
Ice cream
|
3.0
|
|
12.
|
Beer
|
2.6
|
12.
|
Side dishes
|
2.7
|
12.
|
Side dishes
|
2.9
|
|
13.
|
Other grain Processed Foods
|
2.5
|
13.
|
Yogurt
|
2.6
|
13.
|
Other grain processed foods
|
2.6
|
|
14.
|
Dried red pepper
|
2.4
|
14.
|
Other grain processed foods
|
2.5
|
14.
|
Yogurt
|
2.5
|
|
15.
|
Tofu
|
2.0
|
15.
|
Rice cake
|
2.3
|
15.
|
Rice cake
|
2.4
|
|
16.
|
Cake
|
1.9
|
16.
|
Fruit and vegetable juice
|
2.3
|
16.
|
Fruit and vegetable juice
|
2.2
|
|
17.
|
Side dishes
|
1.8
|
17.
|
Soju
|
2.1
|
17.
|
Fruit products
|
2.0
|
|
18.
|
Seaweed
|
1.7
|
18.
|
Cake
|
1.9
|
18.
|
Soju
|
1.9
|
|
19.
|
Ham and bacon
|
1.6
|
19.
|
Fruit products
|
1.8
|
19.
|
Cake
|
1.8
|
|
20.
|
Soju
|
1.6
|
20.
|
Tofu
|
1.6
|
20.
|
Mineral qaters
|
1.7
|
|
21.
|
Instant frozen foods
|
1.5
|
21.
|
Seaweeds
|
1.5
|
21.
|
Tofu
|
1.5
|
|
22.
|
Vegetable products
|
1.5
|
22.
|
Ham and bacon
|
1.5
|
22.
|
Kimchi
|
1.5
|
|
23.
|
Dried anchovies
|
1.4
|
23.
|
Mineral waters
|
1.4
|
23.
|
Seaweed
|
1.4
|
|
24.
|
Kimchi
|
1.3
|
24.
|
Kimchi
|
1.4
|
24.
|
Ham and bacon
|
1.4
|
|
25.
|
Powdered Formula
|
1.2
|
25.
|
Vegetable products
|
1.3
|
25.
|
Vegetable products
|
1.3
|
|
26.
|
Marine animal canned Food
|
1.2
|
26.
|
Marine animal canned food
|
1.0
|
26.
|
Tea
|
1.0
|
|
27.
|
Other unclassified food
|
1.2
|
27.
|
Salted seafood
|
1.0
|
27.
|
Soymilk
|
1.0
|
|
28.
|
Noodles
|
1.1
|
28.
|
Fish cake
|
1.0
|
28.
|
Salted seafood
|
1.0
|
|
29.
|
Soymilk
|
1.1
|
29.
|
Tea
|
1.0
|
29.
|
Dried anchovies
|
0.9
|
|
30.
|
Fish cake
|
1.1
|
30.
|
Jam, honey, grain syrup
|
0.9
|
30.
|
Powdered formula
|
0.9
|
Note: In order of items with high share of expenditure
Source: Statistics Korea, Household Income and Expenditure Survey. 2010-2018.
Mineral water were not within the top 30 items until 2010, however, it has increased rapidly, rising from 23rd place in 2017 to 20th place in 2018. The monthly average expenditures on mineral water per household in 2018 was $2.8, increased by 18.8% from $2.4 in 2017, and increased by 90.9% from $1.5 in 2015.
ANALYSIS OF EXPENDITURE OF PROCESSED FOODS BY AGE OF HOUSEHOLD HEAD AND HOUSEHOLD SIZE
When looking at the overall food expenditure by householder’s age, the expenditures on the processed foods showed the distribution of 22.8%-29.7% by age, displaying a feature of relatively small difference compared to the expenditures on fresh food and eating out. The expenditures on fresh food by age group was 7.5%-37.9% and eating out was 33.0%-69.6%.
Household monthly average food expenditure by the householder age of 40s has the most spent amount for $702, and in case of expenditures on processed food spent the most amount of $204.
In the household with householder age of 30s, the processed food occupied 29.7%, showing the highest in overall food expenses. The order of ages with high processed food spending were 30s, 40s, and 60s and over.
20s had high eating out for 69.6%, and 60s and over spent more on fresh agricultural products, occupying 37.9%, showing big difference in food components by age group.
Table 3. Shares of expenditure of food categories and their annual change by age of household head
Unit: %, %p
| |
20s
|
30s
|
40s
|
50s
|
60s and over
|
|
Share
|
Yearly Changes
|
Share
|
Yearly Changes
|
Share
|
Yearly Changes
|
Share
|
Yearly Changes
|
Share
|
Yealry Changes
|
|
Fresh produce
|
7.5
|
-0.9
|
15.9
|
-0.7
|
20.9
|
-0.2
|
26.3
|
0.4
|
37.9
|
-0.2
|
|
Processed foods
|
22.8
|
-1.1
|
29.7
|
0.4
|
29.1
|
0.7
|
25.7
|
0.8
|
28.9
|
0.9
|
|
Eating out
|
69.6
|
2.0
|
54.4
|
0.3
|
50.0
|
-0.6
|
47.9
|
-1.3
|
33.0
|
-0.8
|
Note: As the numbers in this table represent the shares of expenditure on each category, nominal amount was used for the analysis.
Source: Statistics Korea, Household Income and Expenditure Survey. 2017-2018.
For households whose ages are in their 20s, the expenditures on processed food increased to 0.4% year on year, the expenditures on grain processed products were 12.1% and juices and beverages increased to 6%. On the other hand, the expenditures on fats and oils were $0.4, decreased by 35.2%, and the expenditures on vegetables, fruits and fishery processed products decreased 26.1%, 19.2% and 19.6%, respectively.
For households whose nages are in their 30s, the year on year expenditure on the processed foods decreased 0.3%, and the expenditure on fruit processed food and fats and oils increased relatively sharply to 29.8% and 21.1%, respectively. Expenditure on other foods was increased 11.2% year on year, but the expenditure on vegetable processed food and meat processed products decreased 19.9% and 10%, respectively.
For households whose ages are in their of 40s, the expenditure on processed food year on year increased 3.1% overall, while expenditures on other foods (14.5%), fruit processed food (12.0%), and fats and oils (10.7%) showed relatively high increase year on year.
For households whom are in their 50s, the expenditure on processed foods yearly increased 3.5% overall, while expenditures on other foods (23.4%), fruit processed foods (20.6%), and fats and oils (13.9%) showed notable increase every year.
Table 4. Expenditure on processed foods and yearly rate of change by gge group
Unit: Won, %
| |
20s
|
30s
|
40s
|
50s
|
60s and over
|
|
Expenditure
|
Yearly rate of change
|
Expenditure
|
Yearly rate of change
|
Expenditure
|
Yearly rate of change
|
Expenditure
|
Yearly of change
|
Expenditure
|
Yearly rate of change
|
|
Grains processed
|
26,994
|
12.1.
|
43,807
|
-2.6
|
50,478
|
4.9
|
43,577
|
5.0
|
31,711
|
5.6
|
|
Meat processed
|
5,314
|
-7.7
|
13,237
|
-10.0
|
16,595
|
-3.6
|
13,658
|
23.4
|
7,169
|
19.4
|
|
Fishery processed
|
4,295
|
-19.6
|
13,787
|
-8.5
|
19,991
|
-3.5
|
20,911
|
-9.1
|
24,031
|
-3.6
|
|
Milk processed
|
9,703
|
-1.6
|
28,298
|
2.6
|
24,984
|
0.5
|
19,396
|
0.3
|
16,923
|
3.4
|
|
Fats and oils
|
529
|
-35.2
|
2,203
|
21.1
|
3,019
|
10.7
|
3,036
|
-18.9
|
3,739
|
-2.8
|
|
Fruit processed products
|
902
|
-19.2
|
3,507
|
29.8
|
4,480
|
12.0
|
4,634
|
4.7
|
4,205
|
14.7
|
|
Vegetable processed products
|
445
|
-26.1
|
1,303
|
-19.9
|
2,393
|
-3.8
|
3,419
|
20.6
|
3,091
|
-13.2
|
|
Sugars and snacks
|
18,005
|
-0.2
|
35,146
|
-0.5
|
37,167
|
2.3
|
24,182
|
-1.8
|
17,107
|
2.4
|
|
Seasoned Food
|
2,328
|
-6.7
|
6,706
|
-8.7
|
10,954
|
2.0
|
15,010
|
6.5
|
25,865
|
12.0
|
|
Other foods
|
14,103
|
-3.4
|
25,715
|
11.2
|
28,023
|
14.5
|
20,574
|
13.9
|
12,200
|
10.8
|
|
Coffees and teas
|
5,397
|
1.1
|
9,803
|
-5.4
|
10,085
|
0.2
|
9,734
|
8.0
|
6,515
|
0.4
|
|
Juices and beverages
|
12,986
|
6.0
|
18,383
|
-0.9
|
18,267
|
4.8
|
15,098
|
6.8
|
9,162
|
10.0
|
|
Liquor
|
11,164
|
-1.9
|
20,149
|
2.6
|
18,446
|
0.5
|
16,049
|
-2.3
|
10,358
|
2.5
|
|
Total
|
112,165
|
0.4
|
222,046
|
-0.3
|
244,883
|
3.1
|
209,279
|
3.5
|
172,077
|
4.8
|
Note: Nominal amount was used for the analysis. Exchange rate: $1=1,200 Won
Source: Statistics Korea, Household Income and Expenditure Survey. 2017-2018.
Expenditures on processed foods in households with the age of 60s occupied the most of 4.8% by age groups, and expenditures on meat processed products (19.4%), fruit processed products (14.7%), seasoned products (12.0%), other products (10.8%), juices and beverages (10.0%), etc.were relatively high increase. Except for vegetable processed foods (-13.2%), the degree of decline was not big in decreased items.
The household with householder age of 20s showed highest expenditure on breads (loaf breads and other breads), occupied the 1st place followed by snacks (Korean traditional sweets and other snacks) and instant frozen products. The expenditures on other beverages, ramens and cakes were high compared to other ages groups, and only the mineral water was included in the ranking, showing that the consumption of mineral waters is spreading focusing on the young consumers.
For households whose ages ages in their 30s, the expenditures on snacks (Korean traditional sweets and other snacks), breads (loaf breads and other breads), and beers were high in order, with characteristics of powered formula included in the ranking. For households whose ages are in their 40s, the expenditures on breads (loaf breads and other breads), snacks (Korean traditional sweets and other snacks), and milk were high in order and starting from the households with householder age of 50s, the rice cake and dried red peppers were included in the ranking.
For households whioseages are in their 60s and over, the expenditures on dried red pepper, breads (loaf breads and other breads), and milk were high in order and the rice cake was in 5th place. Fruit processed products and salted seafood were included in the ranking and the ramens were relatively low in the ranking.
Table 5. Comparison of top 15 items by age group in 2018
|
20s
|
30s
|
40s
|
50s
|
60s and over
|
|
1.
|
Loaf breads and other breads
|
1.
|
Korean traditional sweets and snacks
|
1.
|
Loaf breads and other breads
|
1.
|
Loaf breads and other breads
|
1.
|
Dried red pepper
|
|
2.
|
Korean traditional sweets and snacks
|
2.
|
Loaf breads and other breads
|
2.
|
Korean traditional sweets and snacks
|
2.
|
Korean traditional sweets and snacks
|
2.
|
Loaf breads and other breads
|
|
3.
|
Instant frozen foods
|
3
|
Beer
|
3
|
Milk
|
3
|
Milk
|
3
|
Milk
|
|
4
|
Beer
|
4
|
Instant frozen foods
|
4
|
Instant frozen foods
|
4
|
Other meat processed foods
|
4
|
Korean traditional sweets and snacks
|
|
5
|
Other beverages
|
5
|
Milk
|
5
|
Beer
|
5
|
Instant frozen foods
|
5
|
Rice cake
|
|
6
|
Ramens
|
6
|
Other beverages
|
6
|
Other meat processed foods
|
6
|
Beer
|
6
|
Coffee
|
|
7
|
Cake
|
7
|
Ice cream
|
7
|
Ice cream
|
7
|
Other beverages
|
7
|
Other meat processed foods
|
|
8
|
Ice Cream
|
8
|
Coffee
|
8
|
Ramens
|
8
|
Coffee
|
8
|
Other grains Processed foods
|
|
9
|
Milk
|
9
|
Other Meat Processed Food
|
9
|
Other beverages
|
9
|
Ramens
|
9
|
Yogurt
|
|
10
|
Coffee
|
10
|
Powdered formula
|
10
|
Side dishes
|
10
|
Side dishes
|
10
|
Side dishes
|
|
11
|
Other grains processed Foods
|
11
|
Ramens
|
11
|
Coffee
|
11
|
Rice cake
|
11
|
Instant frozen foodd
|
|
12
|
Mineral water
|
12
|
Side dishes
|
12
|
Fruit and vegetable juice
|
12
|
Ice cream
|
12
|
Fruit products
|
|
13
|
Other Meat Processed Food
|
13
|
Cakes
|
13
|
Other rrainsprocessed foods
|
13
|
Other grain pocessed foods
|
13
|
Salted seafood
|
|
14
|
Side dishes
|
14
|
Fruit and vegetable juice
|
14
|
Yogurt
|
14
|
Yogurt
|
14
|
Ramens
|
|
15
|
Fruit and vegetable juice
|
15
|
Yogurt
|
15
|
Cake
|
15
|
Dried red pepper
|
15
|
Other beverages
|
Note: Nominal amount was used for the analysis.
Source: Statistics Korea, Household Income and Expenditure Survey. 2018.
In 2018 the average monthly overall food expenditure of 1-person household was $345, which is lower than 2 or more-person household (per household member) of US$. The expenditures on processed food was $92 in 1-personhousehold which is lower than $114 in 2 or more-person household.
1-person household was 7.8%p higher than 2 or more-person households, but decreased 1.4%pover the last year, showing rapid decline. On the other hand, the processed food increased 1.2%p compared to the last year, showing rapid increase compared to 2or more-person household (0.6%p).
Table 6. Food expenditure by number of household members
Unit: %, %p
| |
One-person household
|
2 or more-person household
|
|
Share
|
Yearly changes
|
Share
|
Yearly changes
|
|
Fresh produce
|
20.3
|
0.2
|
26.7
|
0.1
|
|
Processed foods
|
26.7
|
1.2
|
28.1
|
0.6
|
|
Eating out
|
53.0
|
-1.4
|
45.2
|
-0.7
|
Note: Expenditures are adjusted based on the number of household members by applying the OECD equalization method (expenditure/square root of number of household members).
Source: Statistics Korea, Household Income and Expenditure Survey. 2017-2018.
The expenditures on processed food year on year of 1-person household increased 6.6%, showing relatively high increase, and among them, the item with highest increase includes fruit products (24.0%), seasoned food (23.4%), coffees and teas (13.8%), and other food (13.0%). When viewed from characteristics by item, this is seen as the process of replacing the consumption within the house as much as the eating out reduces. For detailed items, Kimchi and side dishes, seasoning, fermented soy products, ketchup and dressings increased largely.
Table 7. Expenditure on Processed Foods and Year-over-Year Rate of Change by Number of Household Members
Unit: Won, %
|
Classification
|
1-person household
|
2 or more-persons households
|
|
Expenditure
|
Yearly rate of change
|
Expenditure
|
Yearly rate of change
|
|
Grains processing
|
22,189
|
10.7
|
27,466
|
3.6
|
|
Meat Processing
|
4,638
|
15.4
|
8,165
|
4.5
|
|
Fishery processing
|
9,853
|
-1.8
|
13,753
|
-5.0
|
|
Milk processing
|
8,832
|
-4.0
|
14,401
|
2.8
|
|
Fat and oils
|
1,533
|
-0.7
|
2,092
|
-1.6
|
|
Fruit products
|
2,134
|
24.0
|
2,870
|
13.3
|
|
Vegetable products
|
1,098
|
10.3
|
1,858
|
-2.6
|
|
Sugars and snacks
|
12,290
|
1.7
|
17,954
|
0.8
|
|
Seasoned food
|
8,906
|
23.4
|
10,750
|
5.9
|
|
Other foods
|
12,438
|
13.0
|
13,230
|
12.5
|
|
Coffee and tea
|
5,887
|
13.8
|
5,593
|
-1.3
|
|
Juices and beverages
|
9,823
|
3.6
|
9,324
|
5.7
|
|
Liquor
|
10,796
|
-2.2
|
9,894
|
0.9
|
|
Total
|
110,417
|
6.6
|
137,350
|
3.0
|
Note: Expenditures are adjusted based on the number of household members by applying the OECD equalization method (expenditure/square root of number of household members). Exchange rate: $1=1,200 Won
Source: Statistics Korea, Household Income and Expenditure Survey. 2017-2018.
Looking at the detailed items with high expenditure, 1-person household is high in coffees and beverages, beers and ramens compared to 2 or more-person households and have characteristics of having mineral water and soju included in the ranking. On the other hand, compared to 2 or more-person households, ranking of milk and ice cream are low and yogurt and rice cake are not included in the ranking.
Table 8. Comparison of top 15 items by number of household members in 2018
|
1-person household
|
2 or more-person households
|
|
1.
|
Loaf breads and other breads
|
1.
|
Loaf breads and other breads
|
|
2.
|
Korean traditional sweets and other snacks
|
2.
|
Korean traditional sweets and other snacks
|
|
3.
|
Instant frozen foods
|
3.
|
Milk
|
|
4.
|
Beer
|
4.
|
Instant frozen foods
|
|
5.
|
Coffee
|
5.
|
Other meat processed foods
|
|
6.
|
Other beverages
|
6.
|
Beer
|
|
7.
|
Milk
|
7.
|
Dried red pepper
|
|
8.
|
Ramens
|
8.
|
Other beverages
|
|
9.
|
Dried red pepper
|
9.
|
Coffee
|
|
10.
|
Side Dishes
|
10.
|
Ice cream
|
|
11.
|
Other grains processed foods
|
11.
|
Ramens
|
|
12.
|
Mineral waters
|
12.
|
Side dishes
|
|
13.
|
Soju
|
13.
|
Yogurt
|
|
14.
|
Other meat processed foods
|
14.
|
Other grains processed foods
|
|
15.
|
Ice cream
|
15.
|
Rice cake
|
Note: Nominal amount was used for the analysis.
Source: Statistics Korea, Household Income and Expenditure Survey. 2018.
REFERENCES
Lee, K.Y., et al. 2019. Analysis of Household Consumption of Processed Foods, Korea Rural Economic Institute, Webzine of the Agency for Food Industry Information Analysis (AFIA) Project <http://www.krei.re.kr/foodInfo/selectBbsNttView.do?key=738&bbsNo=435&nttNo=129931&searchCtgry=&searchCnd=all&searchKrwd=&pageIndex=1&integrDeptCode=>
Statistics Korea. Household Income and Expenditure Survey. 1990-2018.

The State and the Prospects of Korean Households’ Expenditure on Processed Foods in 2018
Statistics Korea (KOSTAT) had quarterly implemented the Household Income and Expenditure Survey (HIES) to analyze households’ current conditions and changes of living. This article analyzes the state and the prospects of Korean households’ expenditure on processed foods in 2018, based on the raw data analsis of the Household Income and Expenditure Survey conducted by Statistics Korea. In addition, we focused on the expenditure on processed foods of Korean Households by a set of demographic factors, including age of household head and household size.
HOUSEHOLD EXPENDITURE ON FOOD IN 2018
In 2018, the status of the average monthly expenditure on food expenses in Korea (including liquor and eating out) increased 0.2% from $597($1 = 1,200 Won, hearafter) in 2017 to $598, however, given inflation the actual food expense expenditure decreased by 2.6% to $552.
The percentage of total consumer spending that was taken up by food expenses (Engel Coefficient) increased slightly from 28.0% in 2017 to 28.3% in 2018. As income increases, the expected phenomenon is for the consumer expenses on foods which are basic necessities to decrease, however, the Engel Coefficient shows a small increasing trend due to the decrease in consumption in other industries, the increase in food prices, the varying and externalized dietary life, the increase in those focused on well-being/YOLO, and the rise in value-consciousness all seem to have played a role in this phenomenon.
When looking at the ratio of food in households to fresh food expenditure, processed foods expenditure, and eating out, the proportion of eating out increased rapidly in the 1990s and came close to half, but it began to decline slightly since the early 2000s, while the proportion of processed foods remained constant until the 2000s, but began to increase in 2010.
The ratio for processed food expenditure showed an increasing trend in 2018. Processed food expenditure increased 0.6%p from 27.3% in 2017 to 27.9% in 2018 but eating out had a 46.8% decrease 0.8%p yearly. In 2018 the average expenses to eat out decreased 1.4% from $284 in 2017 to $280 in 2018, while processed food costs increased 2.6% from $163 in 2017 to $167 in 2018.
HOUSEHOLD FOOD EXPENDITURE BY EATEGORY OF PROCESSED FOODS IN 2018
When looking at the expenditures and trend of processed food expenses by category, grain processed products (flour/noodles/ramens/starch noodles/tofu, etc.) have the highest percentage at 20.1%, followed by sugars and snacks (13.0%), milk products (10.2%), other foods (10.0%), and processed fish products (9.6%).
The processed foods that showed the highest expenditure increase was other foods (porridges and soups/baby food/side dishes/kimchi/instant․frozen foods), showing the increase of 0.8% yearly by increasing the expenditure about 2,000 Won per household. For other foods, the consumption of porridges and soups, side dishes, Kimchi, instant frozen food have increased except baby foods. Especially, instant frozen food showed relatively sharp increase from $6.3 per household last year to $7.3 (15.7%)
Fruit products increased by $0.4 in 2018 compared to 2017, spending $3.3 per household, but the rate of increase was 12.1% which was the highest increase. Household monthly average expenditures compared to 2017 decreased sharply in 2018 to 19,306 Won decreasing by 5.5%, or $0.9.
Table 1. Share of expenditure by category of processed foods, 2017-2018
Item category
2017 (Won)
2018 (Won)
Change (2018-2017)
Expenditure (Won)
Share (%)
Expenditure (Won)
Share (%)
Expenditure
(Won)
Share (%p)
Rate of change
(%)
Grain processed
38,822
19.9
40,220
20.1
1,398
0.2
3.6
Meat processed
11,138
5.7
11,606
5.8
468
0.1
4.2
Fishery processed
20,437
10.5
19,306
9.6
-1,131
-0.9
-5.5
Milk processed
20,304
10.4
20,533
10.2
229
-0.2
1.1
Fat and oils
3,012
1.5
2,931
1.5
-81
n/a
-2.7
Fruit processed products
3,576
1.8
4,010
2.0
434
0.2
12.1
Vegetable processed products
2,609
1.3
2,535
1.3
-74
n/a
-2.8
Sugars and snacks
26,141
13.4
26,122
13.0
-19
-0.4
-0.1
Seasoned foods
14,050
7.2
15,216
7.6
1,166
0.4
8.3
Other foods
17,968
9.2
19,950
10.0
1,982
0.8
11.0
Coffees and teas
8,437
4.3
8,499
4.2
62
-0.1
0.7
Juices and beverages
13,720
7.0
14,318
7.1
598
0.1
4.4
Liquor
15,115
7.7
15,092
7.5
-23
-0.2
-0.2
Total
195,328
100.0
200,338
100.0
5,009
n/a
2.6
Note: As some of the numbers in this table represent the shares of expenditure on each category, nominal amount was used for the analysis. Exchange rate: $1=1,200 Won
Source: Statistics Korea, Household Income and Expenditure Survey. 2017-2018.
MAJOR PROCESSED FOOD ITEMS PURCHASED BY KOREAN HOUSEHOLDS: YEAR 2018 COMPARED TO PREVIOUS YEARS
As a result of analyzing commonly consumed processed food based on the expenditures occupied by items of processed foods, the first place in 2018 were breads and snacks, the second place were Korean Traditional sweets and other Snacks, and the third place was milk, which was the same order in 2017.
In 2018, the expenditures on processed food item had a rapid increasing trend in the instant frozen foods section. The expenditure on instant frozen food was 3.9% in 2017, occupied in the 5th place, but in 2018, it became 4th place, increased by 0.5%p. Beers have not been changed but as for the importance of the instant frozen food increase, it landed on 5th place.
Table 2. Trend of top 30 items of household monthly average spending among processed food items
Unit: %
2010
2017
2018
1.
Milk
8.4
1.
Loaf breads and other breads
7.3
1.
Loaf breads and other breads
7.4
2.
Loaf breads and other breads
7.2
2.
Korean traditional sweets and snacks
7.1
2.
Korean Traditional Sweets and Snacks
6.8
3.
Korean traditional sweets and snacks
7.2
3.
Milk
5.2
3.
Milk
5.0
4.
Ramens
3.4
4.
Beer
4.0
4.
Instant frozen food
4.4
5.
Coffee
3.3
5.
Instant Frozen Food
3.9
5.
Beer
4.0
6.
Other meat processed foods
3.3
6.
Other meat processed Food
3.5
6.
Other meat processed foods
3.7
7.
Ice ceam
3.3
7.
Coffee
3.4
7.
Other beverages
3.3
8.
Yogurt
3.2
8.
Other beverages
3.3
8.
Coffee
3.2
9.
Other beverages
3.2
9.
Ramens
3.1
9.
Dried red pepper
3.1
10.
Rice cake
2.9
10.
Ice cream
3.0
10.
Ramens
3.1
11.
Fruit and vegetable juice
2.7
11.
Dried red pepper
2.7
11.
Ice cream
3.0
12.
Beer
2.6
12.
Side dishes
2.7
12.
Side dishes
2.9
13.
Other grain Processed Foods
2.5
13.
Yogurt
2.6
13.
Other grain processed foods
2.6
14.
Dried red pepper
2.4
14.
Other grain processed foods
2.5
14.
Yogurt
2.5
15.
Tofu
2.0
15.
Rice cake
2.3
15.
Rice cake
2.4
16.
Cake
1.9
16.
Fruit and vegetable juice
2.3
16.
Fruit and vegetable juice
2.2
17.
Side dishes
1.8
17.
Soju
2.1
17.
Fruit products
2.0
18.
Seaweed
1.7
18.
Cake
1.9
18.
Soju
1.9
19.
Ham and bacon
1.6
19.
Fruit products
1.8
19.
Cake
1.8
20.
Soju
1.6
20.
Tofu
1.6
20.
Mineral qaters
1.7
21.
Instant frozen foods
1.5
21.
Seaweeds
1.5
21.
Tofu
1.5
22.
Vegetable products
1.5
22.
Ham and bacon
1.5
22.
Kimchi
1.5
23.
Dried anchovies
1.4
23.
Mineral waters
1.4
23.
Seaweed
1.4
24.
Kimchi
1.3
24.
Kimchi
1.4
24.
Ham and bacon
1.4
25.
Powdered Formula
1.2
25.
Vegetable products
1.3
25.
Vegetable products
1.3
26.
Marine animal canned Food
1.2
26.
Marine animal canned food
1.0
26.
Tea
1.0
27.
Other unclassified food
1.2
27.
Salted seafood
1.0
27.
Soymilk
1.0
28.
Noodles
1.1
28.
Fish cake
1.0
28.
Salted seafood
1.0
29.
Soymilk
1.1
29.
Tea
1.0
29.
Dried anchovies
0.9
30.
Fish cake
1.1
30.
Jam, honey, grain syrup
0.9
30.
Powdered formula
0.9
Note: In order of items with high share of expenditure
Source: Statistics Korea, Household Income and Expenditure Survey. 2010-2018.
Mineral water were not within the top 30 items until 2010, however, it has increased rapidly, rising from 23rd place in 2017 to 20th place in 2018. The monthly average expenditures on mineral water per household in 2018 was $2.8, increased by 18.8% from $2.4 in 2017, and increased by 90.9% from $1.5 in 2015.
ANALYSIS OF EXPENDITURE OF PROCESSED FOODS BY AGE OF HOUSEHOLD HEAD AND HOUSEHOLD SIZE
When looking at the overall food expenditure by householder’s age, the expenditures on the processed foods showed the distribution of 22.8%-29.7% by age, displaying a feature of relatively small difference compared to the expenditures on fresh food and eating out. The expenditures on fresh food by age group was 7.5%-37.9% and eating out was 33.0%-69.6%.
Household monthly average food expenditure by the householder age of 40s has the most spent amount for $702, and in case of expenditures on processed food spent the most amount of $204.
In the household with householder age of 30s, the processed food occupied 29.7%, showing the highest in overall food expenses. The order of ages with high processed food spending were 30s, 40s, and 60s and over.
20s had high eating out for 69.6%, and 60s and over spent more on fresh agricultural products, occupying 37.9%, showing big difference in food components by age group.
Table 3. Shares of expenditure of food categories and their annual change by age of household head
Unit: %, %p
20s
30s
40s
50s
60s and over
Share
Yearly Changes
Share
Yearly Changes
Share
Yearly Changes
Share
Yearly Changes
Share
Yealry Changes
Fresh produce
7.5
-0.9
15.9
-0.7
20.9
-0.2
26.3
0.4
37.9
-0.2
Processed foods
22.8
-1.1
29.7
0.4
29.1
0.7
25.7
0.8
28.9
0.9
Eating out
69.6
2.0
54.4
0.3
50.0
-0.6
47.9
-1.3
33.0
-0.8
Note: As the numbers in this table represent the shares of expenditure on each category, nominal amount was used for the analysis.
Source: Statistics Korea, Household Income and Expenditure Survey. 2017-2018.
For households whose ages are in their 20s, the expenditures on processed food increased to 0.4% year on year, the expenditures on grain processed products were 12.1% and juices and beverages increased to 6%. On the other hand, the expenditures on fats and oils were $0.4, decreased by 35.2%, and the expenditures on vegetables, fruits and fishery processed products decreased 26.1%, 19.2% and 19.6%, respectively.
For households whose nages are in their 30s, the year on year expenditure on the processed foods decreased 0.3%, and the expenditure on fruit processed food and fats and oils increased relatively sharply to 29.8% and 21.1%, respectively. Expenditure on other foods was increased 11.2% year on year, but the expenditure on vegetable processed food and meat processed products decreased 19.9% and 10%, respectively.
For households whose ages are in their of 40s, the expenditure on processed food year on year increased 3.1% overall, while expenditures on other foods (14.5%), fruit processed food (12.0%), and fats and oils (10.7%) showed relatively high increase year on year.
For households whom are in their 50s, the expenditure on processed foods yearly increased 3.5% overall, while expenditures on other foods (23.4%), fruit processed foods (20.6%), and fats and oils (13.9%) showed notable increase every year.
Table 4. Expenditure on processed foods and yearly rate of change by gge group
Unit: Won, %
20s
30s
40s
50s
60s and over
Expenditure
Yearly rate of change
Expenditure
Yearly rate of change
Expenditure
Yearly rate of change
Expenditure
Yearly of change
Expenditure
Yearly rate of change
Grains processed
26,994
12.1.
43,807
-2.6
50,478
4.9
43,577
5.0
31,711
5.6
Meat processed
5,314
-7.7
13,237
-10.0
16,595
-3.6
13,658
23.4
7,169
19.4
Fishery processed
4,295
-19.6
13,787
-8.5
19,991
-3.5
20,911
-9.1
24,031
-3.6
Milk processed
9,703
-1.6
28,298
2.6
24,984
0.5
19,396
0.3
16,923
3.4
Fats and oils
529
-35.2
2,203
21.1
3,019
10.7
3,036
-18.9
3,739
-2.8
Fruit processed products
902
-19.2
3,507
29.8
4,480
12.0
4,634
4.7
4,205
14.7
Vegetable processed products
445
-26.1
1,303
-19.9
2,393
-3.8
3,419
20.6
3,091
-13.2
Sugars and snacks
18,005
-0.2
35,146
-0.5
37,167
2.3
24,182
-1.8
17,107
2.4
Seasoned Food
2,328
-6.7
6,706
-8.7
10,954
2.0
15,010
6.5
25,865
12.0
Other foods
14,103
-3.4
25,715
11.2
28,023
14.5
20,574
13.9
12,200
10.8
Coffees and teas
5,397
1.1
9,803
-5.4
10,085
0.2
9,734
8.0
6,515
0.4
Juices and beverages
12,986
6.0
18,383
-0.9
18,267
4.8
15,098
6.8
9,162
10.0
Liquor
11,164
-1.9
20,149
2.6
18,446
0.5
16,049
-2.3
10,358
2.5
Total
112,165
0.4
222,046
-0.3
244,883
3.1
209,279
3.5
172,077
4.8
Note: Nominal amount was used for the analysis. Exchange rate: $1=1,200 Won
Source: Statistics Korea, Household Income and Expenditure Survey. 2017-2018.
Expenditures on processed foods in households with the age of 60s occupied the most of 4.8% by age groups, and expenditures on meat processed products (19.4%), fruit processed products (14.7%), seasoned products (12.0%), other products (10.8%), juices and beverages (10.0%), etc.were relatively high increase. Except for vegetable processed foods (-13.2%), the degree of decline was not big in decreased items.
The household with householder age of 20s showed highest expenditure on breads (loaf breads and other breads), occupied the 1st place followed by snacks (Korean traditional sweets and other snacks) and instant frozen products. The expenditures on other beverages, ramens and cakes were high compared to other ages groups, and only the mineral water was included in the ranking, showing that the consumption of mineral waters is spreading focusing on the young consumers.
For households whose ages ages in their 30s, the expenditures on snacks (Korean traditional sweets and other snacks), breads (loaf breads and other breads), and beers were high in order, with characteristics of powered formula included in the ranking. For households whose ages are in their 40s, the expenditures on breads (loaf breads and other breads), snacks (Korean traditional sweets and other snacks), and milk were high in order and starting from the households with householder age of 50s, the rice cake and dried red peppers were included in the ranking.
For households whioseages are in their 60s and over, the expenditures on dried red pepper, breads (loaf breads and other breads), and milk were high in order and the rice cake was in 5th place. Fruit processed products and salted seafood were included in the ranking and the ramens were relatively low in the ranking.
Table 5. Comparison of top 15 items by age group in 2018
20s
30s
40s
50s
60s and over
1.
Loaf breads and other breads
1.
Korean traditional sweets and snacks
1.
Loaf breads and other breads
1.
Loaf breads and other breads
1.
Dried red pepper
2.
Korean traditional sweets and snacks
2.
Loaf breads and other breads
2.
Korean traditional sweets and snacks
2.
Korean traditional sweets and snacks
2.
Loaf breads and other breads
3.
Instant frozen foods
3
Beer
3
Milk
3
Milk
3
Milk
4
Beer
4
Instant frozen foods
4
Instant frozen foods
4
Other meat processed foods
4
Korean traditional sweets and snacks
5
Other beverages
5
Milk
5
Beer
5
Instant frozen foods
5
Rice cake
6
Ramens
6
Other beverages
6
Other meat processed foods
6
Beer
6
Coffee
7
Cake
7
Ice cream
7
Ice cream
7
Other beverages
7
Other meat processed foods
8
Ice Cream
8
Coffee
8
Ramens
8
Coffee
8
Other grains Processed foods
9
Milk
9
Other Meat Processed Food
9
Other beverages
9
Ramens
9
Yogurt
10
Coffee
10
Powdered formula
10
Side dishes
10
Side dishes
10
Side dishes
11
Other grains processed Foods
11
Ramens
11
Coffee
11
Rice cake
11
Instant frozen foodd
12
Mineral water
12
Side dishes
12
Fruit and vegetable juice
12
Ice cream
12
Fruit products
13
Other Meat Processed Food
13
Cakes
13
Other rrainsprocessed foods
13
Other grain pocessed foods
13
Salted seafood
14
Side dishes
14
Fruit and vegetable juice
14
Yogurt
14
Yogurt
14
Ramens
15
Fruit and vegetable juice
15
Yogurt
15
Cake
15
Dried red pepper
15
Other beverages
Note: Nominal amount was used for the analysis.
Source: Statistics Korea, Household Income and Expenditure Survey. 2018.
In 2018 the average monthly overall food expenditure of 1-person household was $345, which is lower than 2 or more-person household (per household member) of US$. The expenditures on processed food was $92 in 1-personhousehold which is lower than $114 in 2 or more-person household.
1-person household was 7.8%p higher than 2 or more-person households, but decreased 1.4%pover the last year, showing rapid decline. On the other hand, the processed food increased 1.2%p compared to the last year, showing rapid increase compared to 2or more-person household (0.6%p).
Table 6. Food expenditure by number of household members
Unit: %, %p
One-person household
2 or more-person household
Share
Yearly changes
Share
Yearly changes
Fresh produce
20.3
0.2
26.7
0.1
Processed foods
26.7
1.2
28.1
0.6
Eating out
53.0
-1.4
45.2
-0.7
Note: Expenditures are adjusted based on the number of household members by applying the OECD equalization method (expenditure/square root of number of household members).
Source: Statistics Korea, Household Income and Expenditure Survey. 2017-2018.
The expenditures on processed food year on year of 1-person household increased 6.6%, showing relatively high increase, and among them, the item with highest increase includes fruit products (24.0%), seasoned food (23.4%), coffees and teas (13.8%), and other food (13.0%). When viewed from characteristics by item, this is seen as the process of replacing the consumption within the house as much as the eating out reduces. For detailed items, Kimchi and side dishes, seasoning, fermented soy products, ketchup and dressings increased largely.
Table 7. Expenditure on Processed Foods and Year-over-Year Rate of Change by Number of Household Members
Unit: Won, %
Classification
1-person household
2 or more-persons households
Expenditure
Yearly rate of change
Expenditure
Yearly rate of change
Grains processing
22,189
10.7
27,466
3.6
Meat Processing
4,638
15.4
8,165
4.5
Fishery processing
9,853
-1.8
13,753
-5.0
Milk processing
8,832
-4.0
14,401
2.8
Fat and oils
1,533
-0.7
2,092
-1.6
Fruit products
2,134
24.0
2,870
13.3
Vegetable products
1,098
10.3
1,858
-2.6
Sugars and snacks
12,290
1.7
17,954
0.8
Seasoned food
8,906
23.4
10,750
5.9
Other foods
12,438
13.0
13,230
12.5
Coffee and tea
5,887
13.8
5,593
-1.3
Juices and beverages
9,823
3.6
9,324
5.7
Liquor
10,796
-2.2
9,894
0.9
Total
110,417
6.6
137,350
3.0
Note: Expenditures are adjusted based on the number of household members by applying the OECD equalization method (expenditure/square root of number of household members). Exchange rate: $1=1,200 Won
Source: Statistics Korea, Household Income and Expenditure Survey. 2017-2018.
Looking at the detailed items with high expenditure, 1-person household is high in coffees and beverages, beers and ramens compared to 2 or more-person households and have characteristics of having mineral water and soju included in the ranking. On the other hand, compared to 2 or more-person households, ranking of milk and ice cream are low and yogurt and rice cake are not included in the ranking.
Table 8. Comparison of top 15 items by number of household members in 2018
1-person household
2 or more-person households
1.
Loaf breads and other breads
1.
Loaf breads and other breads
2.
Korean traditional sweets and other snacks
2.
Korean traditional sweets and other snacks
3.
Instant frozen foods
3.
Milk
4.
Beer
4.
Instant frozen foods
5.
Coffee
5.
Other meat processed foods
6.
Other beverages
6.
Beer
7.
Milk
7.
Dried red pepper
8.
Ramens
8.
Other beverages
9.
Dried red pepper
9.
Coffee
10.
Side Dishes
10.
Ice cream
11.
Other grains processed foods
11.
Ramens
12.
Mineral waters
12.
Side dishes
13.
Soju
13.
Yogurt
14.
Other meat processed foods
14.
Other grains processed foods
15.
Ice cream
15.
Rice cake
Note: Nominal amount was used for the analysis.
Source: Statistics Korea, Household Income and Expenditure Survey. 2018.
REFERENCES
Lee, K.Y., et al. 2019. Analysis of Household Consumption of Processed Foods, Korea Rural Economic Institute, Webzine of the Agency for Food Industry Information Analysis (AFIA) Project <http://www.krei.re.kr/foodInfo/selectBbsNttView.do?key=738&bbsNo=435&nttNo=129931&searchCtgry=&searchCnd=all&searchKrwd=&pageIndex=1&integrDeptCode=>
Statistics Korea. Household Income and Expenditure Survey. 1990-2018.