Introduction
POS (point of sale) system was developed in the U.S to prevent a merchant from calculated-mistake and cheating. It is being used as an important data for understanding the market situation as the value of the structured data is recognized.
By using POS data from Nielsen Korea in 2018, we analyzed rice, porridge, and retort pouch markets as well as the current food industry and trend of the processed foods market.
POS data analysis in 2019 used retail store sales data by items provided by the Food Industry Statistics (FIS), the period from the first quarter of 2015 to the second quarter of 2019.
- As of 2019, Nielsen Korea produced and provided POS data
- Data is available from the 2011 fourth quarter. However, the analysis was conducted from the 2015 first quarter to identify trends for the last five years.
Food Industry Statistics (FIS) POS data provides information on sales for a total of 40 items. Among them, 31 items were analyzed, except for ginseng beverages, alcoholic beverages, and health functional foods, whose performance has been discontinued. The 31 items were grouped into eight similar items and each group was analyzed within the same graph to see the differences and changes between similar items.
Changes and characteristics of consumption by Item
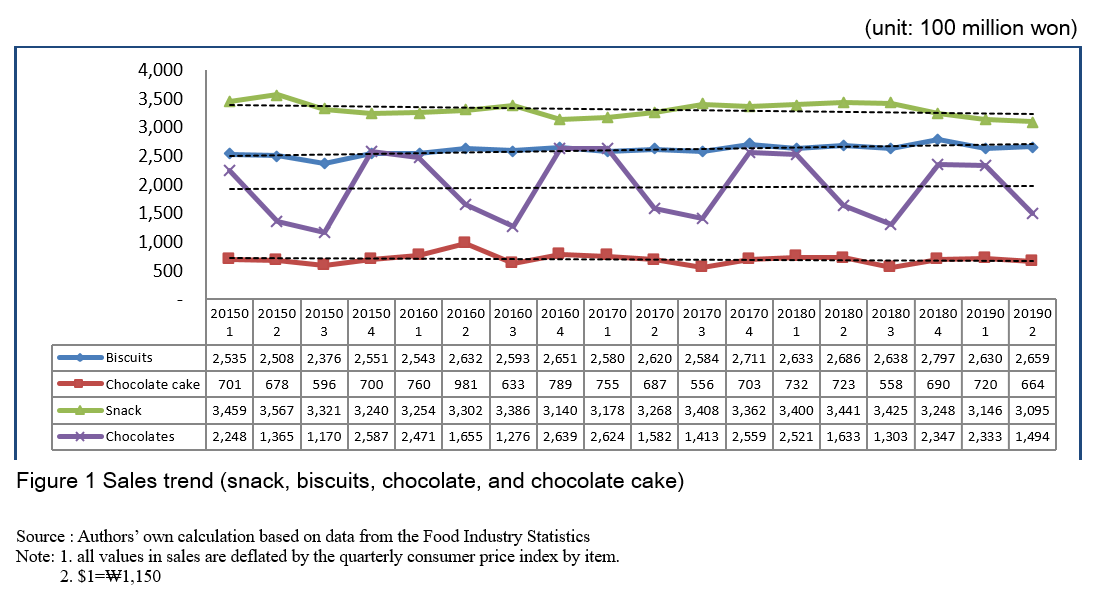
■ Confectionery (snacks, biscuits, chocolates, and chocolate cakes)
Sales of biscuits increased slightly from the first quarter of 2015 to the second quarter of 2019. Sales in the second quarter of 2019 fell 1.0% on-year (US$23.1 million). Sales of snacks are stagnant in the medium to long-term; in the second quarter of 2019, it was US$269 million, decreased by 10% compared to the same quarter of previous year (Figure 1).
Chocolate sales were affected by special events in the first and fourth quarters, which are Valentine's Day and White Day and the College Scholastic Ability Test and Christmas, respectively. Thus, sales increased in the first and fourth quarters. Sales in chocolate were on the rise in the medium to long-term, accounting for US$130 million in the second quarter of 2019, down 8.5% compared to the same quarter of previous year (Figure 1).
The sales of chocolate cake recorded US$85.3 million in the second quarter of 2016, but the situation was barely changed in the medium to long-term. Sales in the second quarter of 2019 decreased by 8.2% compared to the same quarter of previous year, with US$57.7 million (Figure 1).
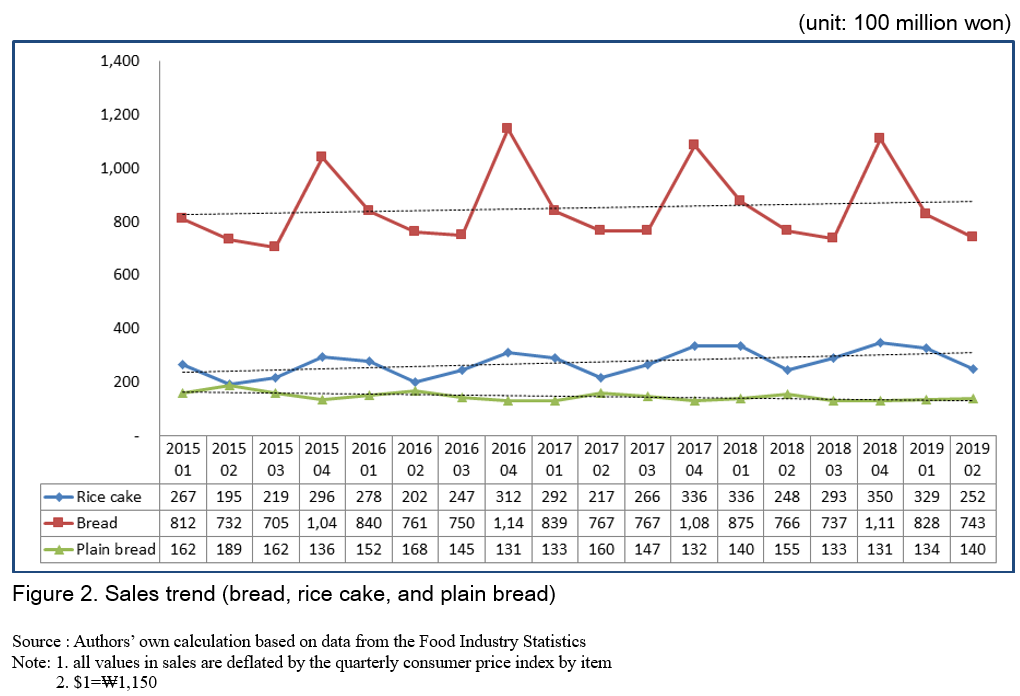
■ Bread and rice cake (bread, rice cake, and plain bread)
Sales of bread presented an increasing pattern in winter, which corresponded to the fourth quarter because of hot bread. In the medium to long-term, bread sales, in general, increased. Notwithstanding, sales decreased by 3.0% (US$64.6 million) in the second quarter of 2019 from the same quarter of previous year (Figure 2).
The rice cakes are characterized by an increase in sales between the first and fourth quarters and a decreasing tendency in the second and third quarters. In the perspectives of the medium to long-term, sales in the second quarter of 2019 increased 1.6% compared to the same quarter of previous year to US$21.9 million (Figure 2).
Sales of plain bread showed a slight increase every second quarter. However, overall sales decreased for five years, indicating that the sales in the second quarter of 2019 accounted for US$12.2 million, with 9.6% from the second quarter of 2018 (Figure 2).
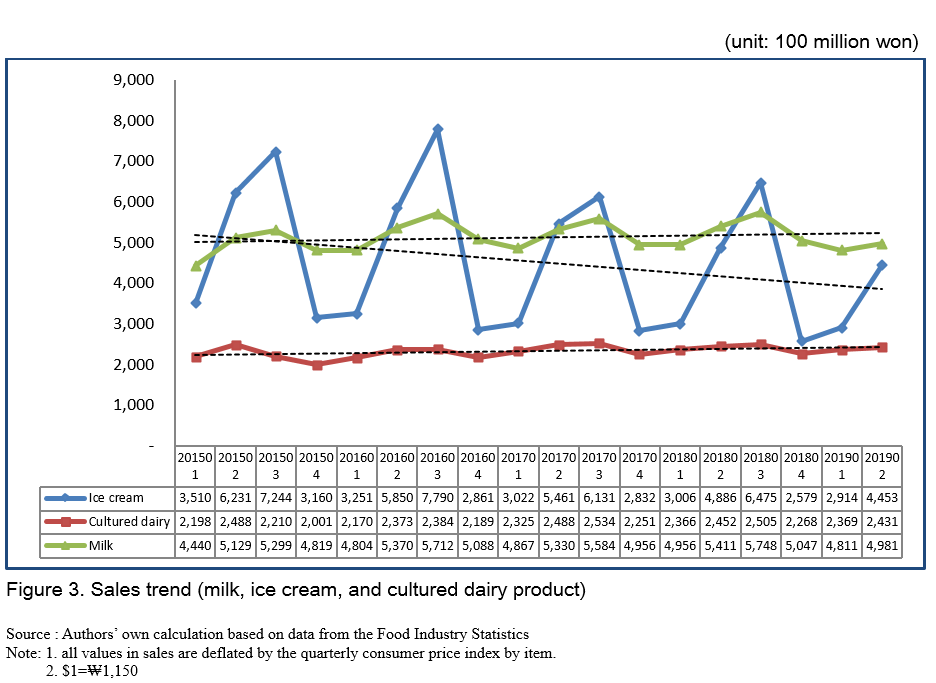
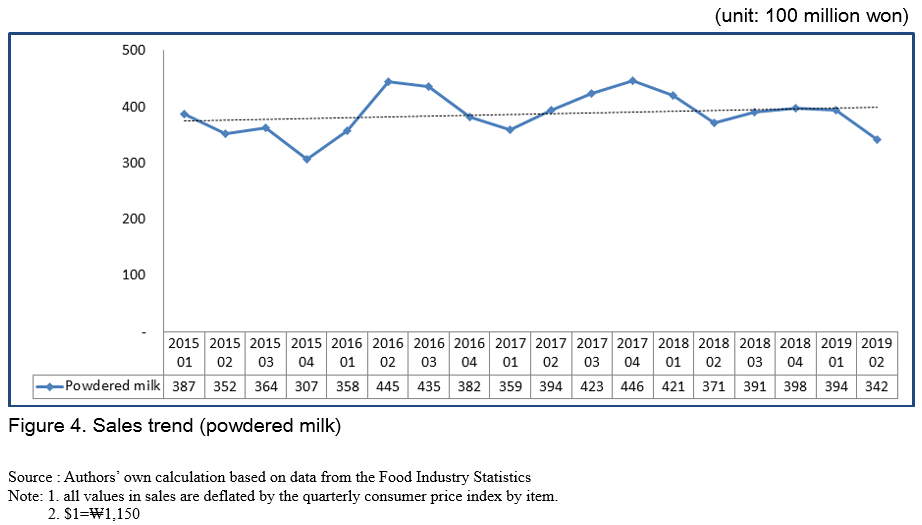
■ Dairy products (milk, ice creams, cultured dairy products, and powdered milk)
Milk sales tended to increase in the second and third quarters compared to the first and fourth quarters, which are winter where a fixed rate is applied. Sales for the second quarter of 2019 were US$433 million, declined by 7.9% compared to the same quarter of previous year(Figure 3).
Ice cream had a similar pattern to milk sales, with seasonality, presenting an explosive growth in sales in the third quarter in summer. In the mid to long term, however, sales fell 8.9% compared to the same quarter of previous year to US$387 million(Figure 3).
Sales in cultured dairy tended to remain stable except for alight decline in the fourth quarter. In the second quarter of 2019, sales amounted to US$211 million, which showed a 0.9% reduction from the same quarter of previous year(Figure 3).
In the ase of powdered milk, there is no particular seasonality, although quarterly fluctuation existed. The sales showed a slight increase in the mid- to long-term, its sales in the second quarter of 2019 recorded US$29.7 million, down 7.9% compared to the same quarter of previous year(Figure 4).
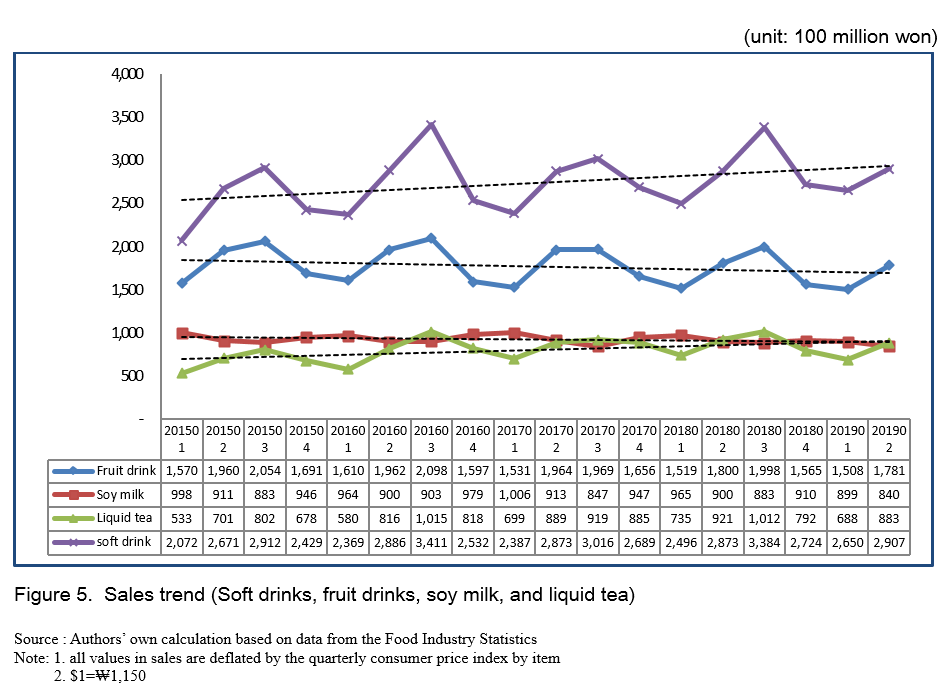
■ Beverage (Soft drinks, fruit drink, soymilk, and liquid tea)
Among beverages, soft drinks accounted for the largest portion of total sales in the third quarter during the summer. In the medium to long-term, sales increased steadily. Sales in the second quarter of 2019 were US$253 million, an increase of 1.2% compared to the same quarter of previous year (Figure 5).
Fruit and vegetable drinks also featured high sales in the third quarter of summer, but sales showed a decreasing pattern in the medium to long-term. Sales in the second quarter of 2019 accounted for US$155 million, down 1.1% compared to the same quarter of previous year (Figure 5).
Soymilk sales remained on a stable trend. In the case of liquid tea, however, a slight increase in the medium to long-term occurred with sales rising in the third quarter of the summer. Soymilk's sales for the second quarter of 2019 decreased by 6.7% compared to the same quarter of previous year to US$73 million, and ones of liquid tea decreased by 4.0% to US$76.8 million (Figure 5).
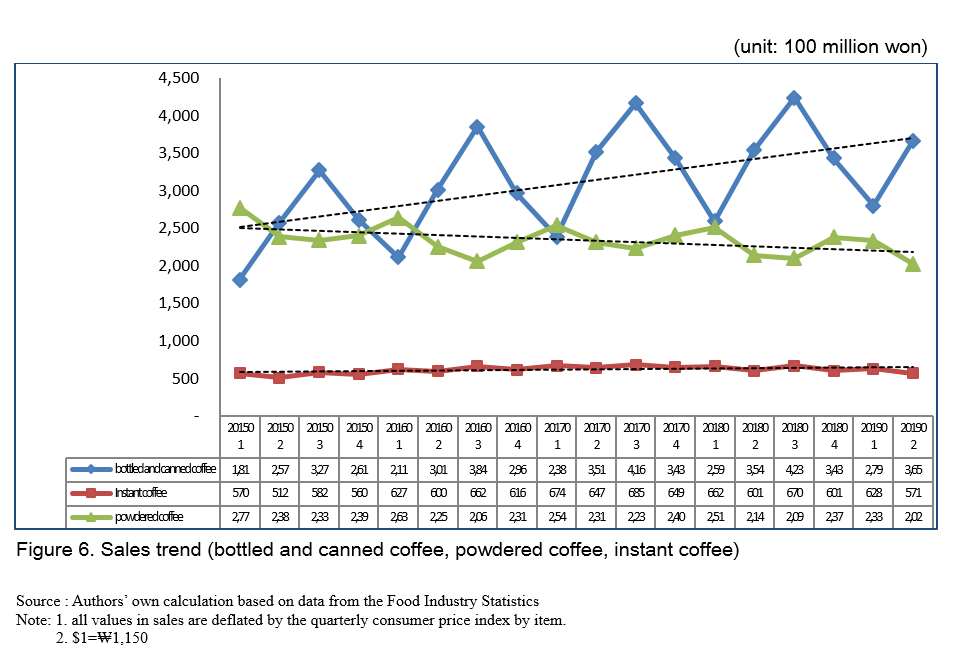
■ Coffee (bottled and canned coffee, prepared coffee, instant coffee)
Bottled and canned coffee spiked their sales in the third quarter in summer and sales presented a low level of performance in the first quarter. Recent sales are shown relatively steep growth. Sales in the second quarter of 2019 were US$318 million, increasing up to 3.2% compared to the same quarter of previous year.
In contrast to bottled and canned coffee, powdered coffee (three-in-one coffee, which consists of coffee, sugar, and crime) showed a high amount of sales in the first quarter, while their sales are low in the other quarter. In the mid- to long-term, sales declined. Sales for the second quarter of 2019 accounted for US$176 million, down 5.3% compared to the same quarter of previous year.
Instant coffee, called soluble coffee, tended to increase slightly in the first and third quarters. It also recorded sales of between US$43.5 million and US$52.2 million per quarter. Sales in the second quarter of 2019 were attained US$49.7 million, down 5.1% compared to the same quarter of previous year (Figure 6).
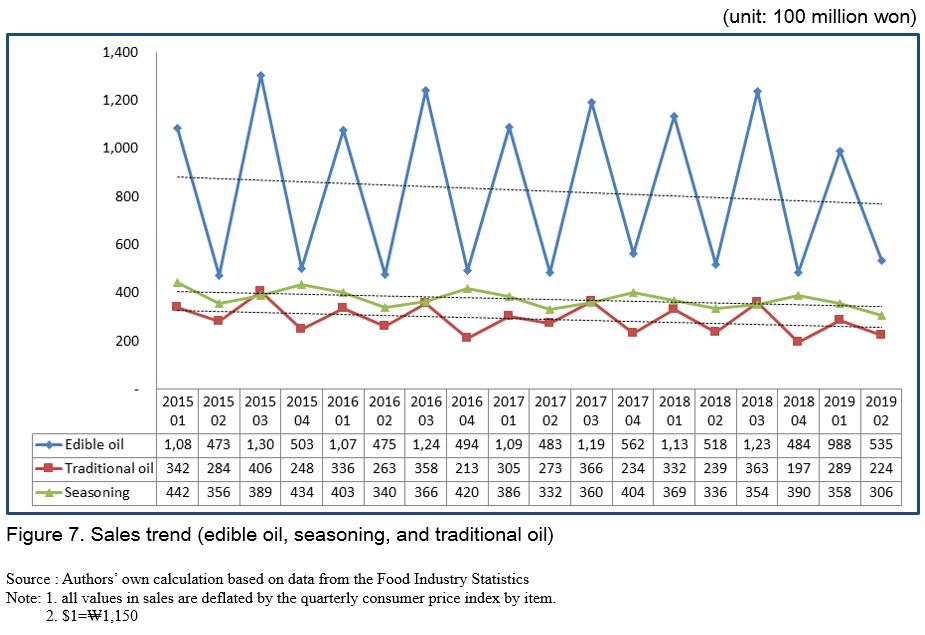
■ Oil and seasoning (edible oil, seasoning, and traditional oil)
Cooking oil spiked in the first and third quarters due to Lunar New Year and Chuseock holiday, respectively. Sales, in general, presented a slight decrease in the medium to long-term in the second quarter of 2019, which reached US$46.5 million, up 3.2% compared to the same quarter of previous year.
Sales in seasonings are shown a meager increase in the fourth quarter; nevertheless, it remained on a downward trend. In the second quarter of 2019, sales amounted to US$26.6 million, indicating a 9.0% compared to the same quarter of previous year.
Traditional oil (such as sesame oil, perilla oil, and so forth) had the same characteristics as cooking oil, with sales concentrated in the first and the third quarters. As seasoning sales, which tended to decline slightly over the medium to long-term, US$19.5 million of traditional oils were sold in the second quarter of 2019, down 6.5% compared to the same quarter of previous year (Figure 7).
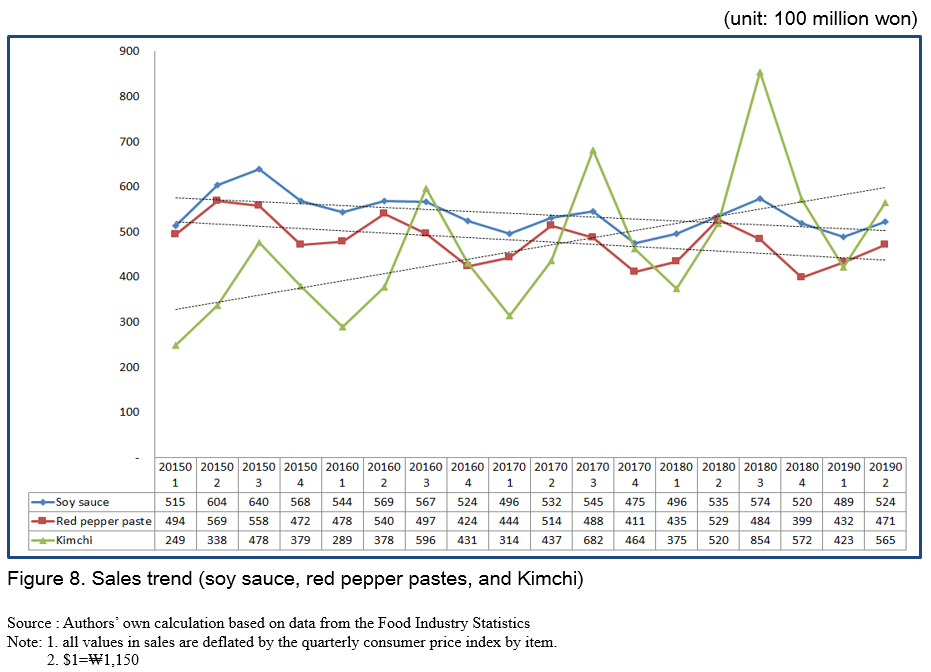
■ Korean paste and Kimchi (soy sauce, red pepper paste, soybean pastes, kimchi, and other seasonings)
Kimchi had the highest sales in the third quarter. There was no relation between Kimchi sales and vacation and comping demands. Sales of Kimchi continued to grow steadily with a significant increase, presenting US$49.1 million of sales in the second quarter, up 8.7% from the same quarter of previous year (Figure 8).
Soy sauce showed a slightly high amount of sales in the third quarter. Sales in the second quarter of 2019 reached US$45.6 million, down 2.1% compared to the same quarter of previous year.
Red pepper pastes peaked in sales every second and third quarters. Nevertheless, in the long run, sales had been on the decline, and sales in the second quarter of 2019, falling by 10.9% compared to the same quarter of previous year to US$41 million.
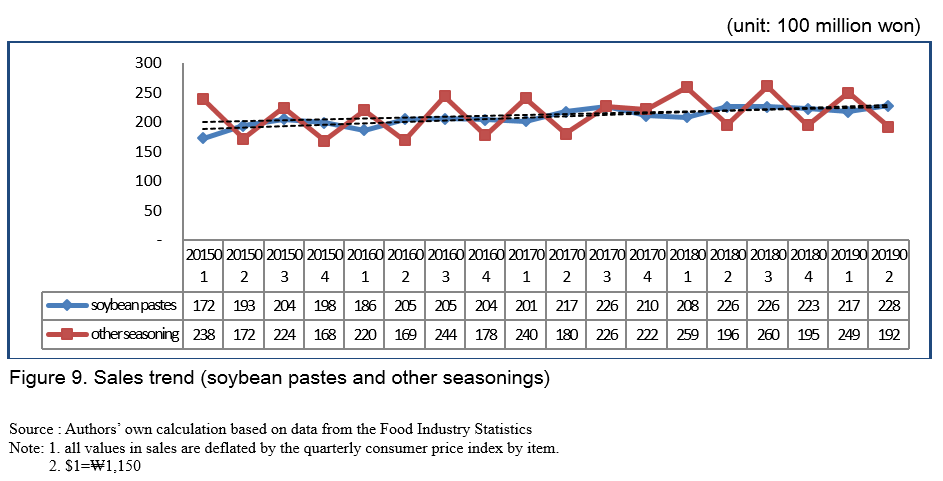
Sales of Soybean paste had a fluctuating pattern for quarters, with a slight increase and decrease figures around US$17.4 million. Sales in the second quarter of 2019 were US$19.8 million, up 0.9% compared to the same quarter of previous year (Figure 9).
■ Other foods (ramen, processed meat, instant and Home Meal Replacement (HMR) foods, dumpling, and bean curb)
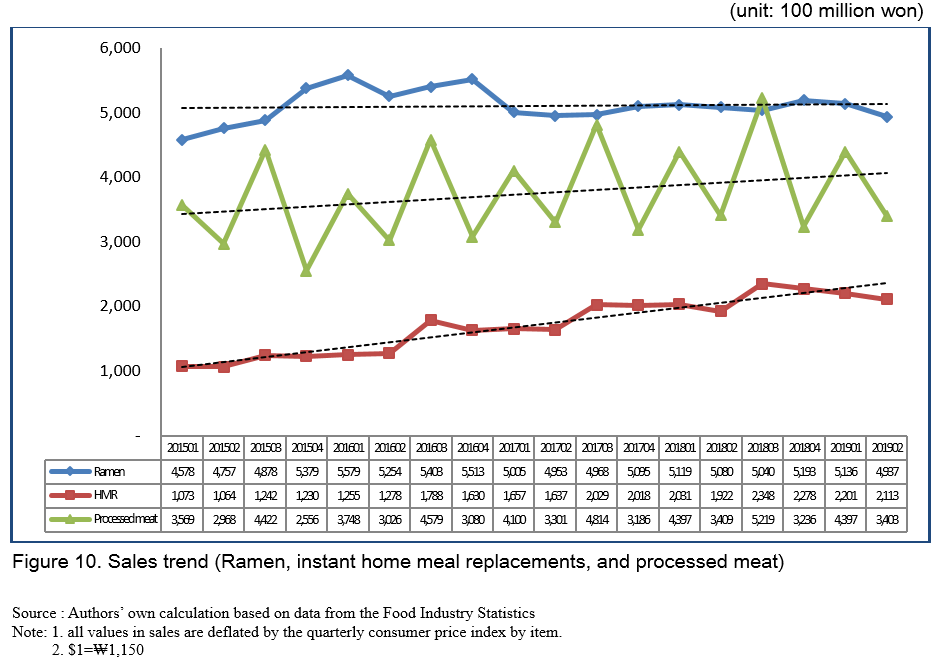
Ramen sales were relatively high from the fourth quarter to the first quarter of winter, but the recent increase in sales was not large. Sales of Ramen had been on a slight rise in the mid- to long-term, sales in the second quarter of 2019 increased by 2.8% compared to the same quarter of previous year to US$429 million (Figure 10).
Instant Home Meal Replacements (HMR) is characterized by relatively high sales in the third quarter due to vacation and camping demand. HMR sales had been growing rapidly in the mid- to long-term, indicating US$191 million in the second quarter of 2019 with an 8.3% increase compared to the same period last year (Figure 10).
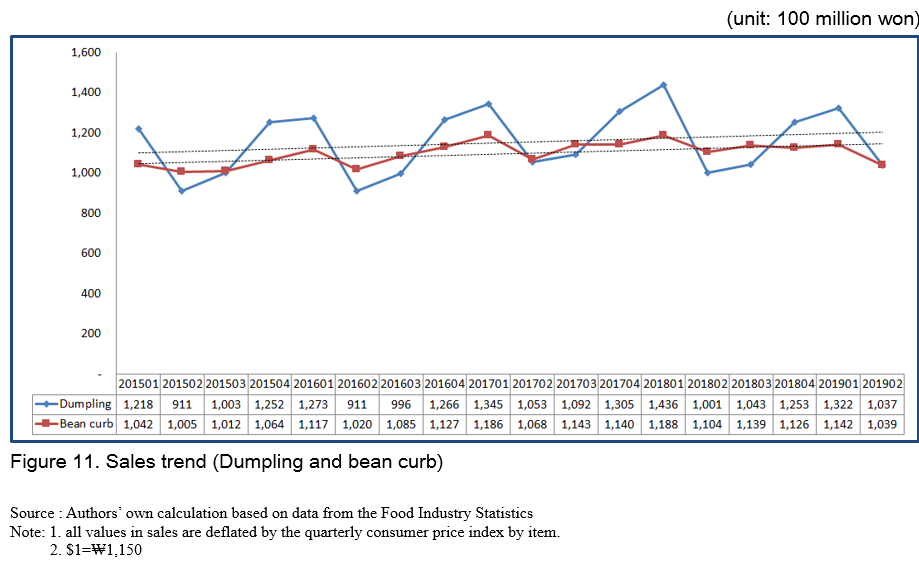
Dumpling sales are relatively high from the fourth to the first quarter, which were the winter season. Medium to long-term sales are small but on the rise. Meanwhile, in the second quarter of 2019, sales amounted to US$90.2 million, up 3.6% compared to the same period last year (Figure 11).
Sales of bean curb recorded around US$87 million per quarter, and sales in the second quarter of 2019 were US$90.3 million, down 5.9% compared to the same period last year (Figure 11).
Changes and characteristics of consumption by distribution type
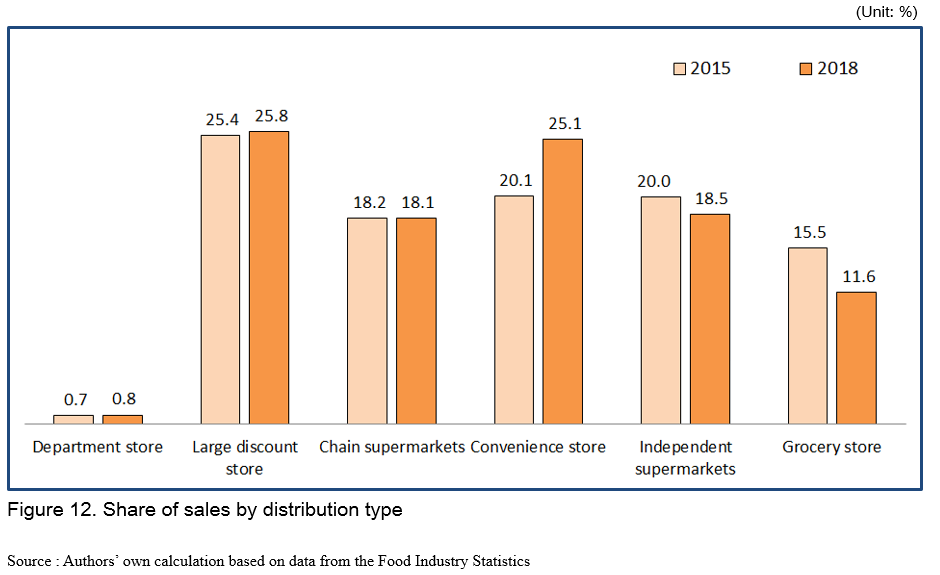
The proportion of by distribution type presented below. The sales share of large discount stores accounted for the highest portion (25.8%) of the total sales in 2018 and increased by 0.4% compared to the ones of 2015. On the other hand, sales of convenience stores increased sharply, indicating 25.1% in 2015, with a 5.0% increase in share from 2015 (Figure 12).
The change in convenience store’s share resulted from the steady promotion of new stores with numerous label products or private band (PB) products, and competition within stores while large discount stores struggled with restrictions on stores, mandatory shutdowns, and growth of online channels (Figure 12).
The proportion of chain supermarkets remained at 18%, while the ratio of independent supermarkets and grocery stores decreased by 1.5% point and 3.9% point, respectively. The percentage of sales in department stores rose slightly by 0.1% (Figure 12).
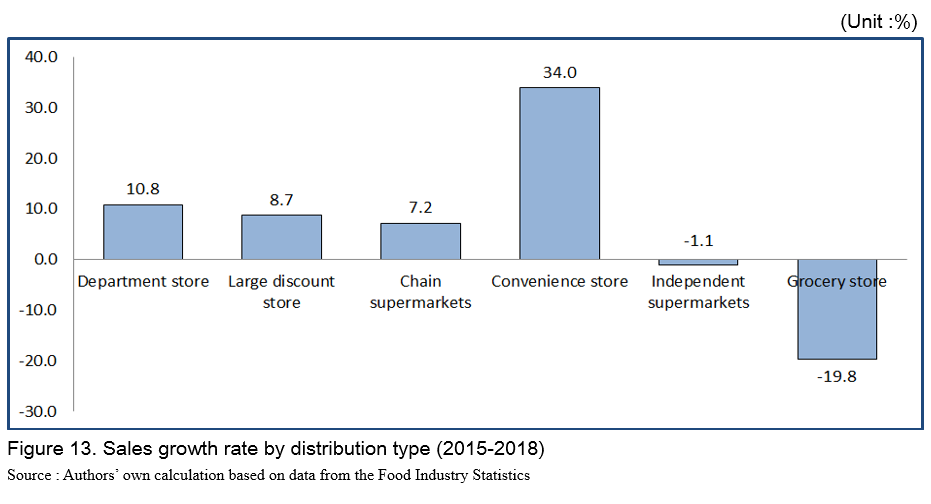
The following figure showed the reduction rate of 2018 sales compared to that of 2015 sales. Therefore, it is possible to look at changes in share by distribution type in detail (Figure 13).
Sales of processed foods examined a 34% increase at convenience stores in 2018 compared to that of 2015, while sales at large discount stores and chain supermarkets increased by only 8.7% and 7.2% during the same period, respectively. However, independent supermarkets’ sales decreased by 1.1%. Moreover, sales of general grocery stores declined 19.8%, which showed that it is the least accessible distribution channel regarding processed foods (Figure 13).
Analysis of sales share and rate of change
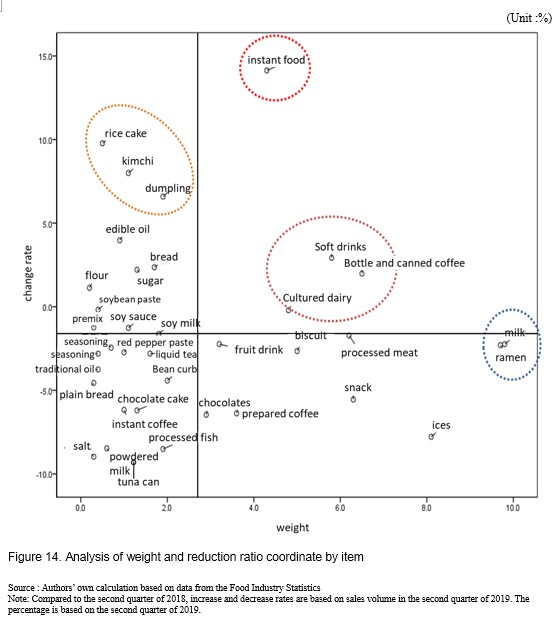
Y-axis is composed of the percentage of 37 processed foods’ sales in total sales of processed foods in the second quarter of 2019, conducted on the average value.
The first quadrant indicates items with a high growth rate and high specificity. The second one means a high growth rate but without a high specific weight. The third quadrant includes a low growth rate and low specific. The fourth quadrant shows a high proportion of items but slows growth (Figure 14).
Items located in the first quadrant, which have both a high growth rate and a high proportion, consist of instant foods, instant coffee, soft drinks, and cultured dairy products (Figure 14).
Fast-growing sales of instant foods, Home Meal Replacements (HMR), bottled and canned coffee, and soft drinks had an impact on the growth of the processed food market in the year 2019(Figure 14).
Beverage products such as bottled and canned coffee, soft drinks, and cultured dairy products are popular, and both the percentage of processed food market and sales growth rate are high (Figure 14).
Kimchi, rice cake, and dumpling, which are placed in the second quadrants, not taking a big part yet, but is expected to grow as a major processed food in the future as it had presented a rapid growth, taking into account a decreasing demand for Kimjang (the traditional process of preparation and preservation of kimchi) and an increasing demand for snacks (Figure 14).
Commonly consumed items such as ramen, milk and snacks, are located in the fourth quadrant as sales had decreased. It is difficult expanding its demand in such a saturated market (Figure 14).
Also, seasonal chocolate, prepared coffee, and ice creams are big factors to cause declines in sales year-on-year (Figure 14).
The five most-selling items in the quarter
■ For each quarter, select items with particularly high or low sales.
We examined the five most sold items as following steps. First, we identify the most sold processed foods in the first quarter by calculating the percentage of individual processed food sales out of the total sales of 37 processed food items. Secondly, we calculated the average of five shares in the first quarter from the first quarter of 2015 to the second quarter of 2019 (=a). Then, we also calculated the average weights for all quarters other than the first quarter of 2015 to the second quarter of 2019 (=b). Lastly, we sorted the differences between a and b values to select up to the five most-selling items.
The most-selling processed foods in the first quarter, where include events such as White Day, Valentine's Day, and New Year's Day, were chocolate (+1.34%), processed meat (+1.15%), crude coffee (+0.82%), edible oil (+0.76%), and canned tuna (+0.69%). On the other hand, the least-selling items in the first quarter were glaciers (-3.05%), bottled and canned coffee (-1.62%), soft drinks (-0.63%), sugar (-0.48%), and milk (-0.48%). We can interpret that processed foods as a gift had become common especially chocolate and processed meat. Meanwhile, cold weather led to low sales of sugar and milk, which are also used as ingredients for soft drinks, ice creams and ice water.
The five most sold processed foods in the second quarter were found to be ice creams (+ 2.41%), sugar (+0.79%), bottled and canned coffee (+0.45%), milk (+0.45%) and soft drinks (+0.40%). On the other hand, processed meat (-1.17%), chocolate (-1.07%), edible oil (-0.79%), canned tuna (-0.63%), and dumpling (-0.42%) showed lower sales in the second quarter than the other quarters. This is because cooking is relatively difficult due to the weather.
As the summer season is in full swing, the top processed foods in the third quarter, where the Chuseok holiday takes place, were still +4.14%, the gap between second-placed meat products (+ 1.40%) was the highest in four quarters. Sales of meat processed products and liquid coffee (+1.05%) appear to have increased in line with camping demand. Normally, bottled and canned coffee recorded a lot of sales in the second and third quarters, and prepared coffee, which is typical of drinking in warm, had high sales in the first quarter. On the other hand, chocolate, ramen, prepared coffee, biscuits, and snacks are classified as the lowest-selling items in the third quarter.
With the start of the winter season, chocolate (+ 1.59%) was the top-selling processed food in the fourth quarter, including the Chuseok holiday (some years) and the Christmas and school Scholastic Ability Test.
Because of cold weather, warm ramen (+ 1.01%) and bread (+ 0.73%), such as Hoppang, are the only top five items in the quarter. On the other hand, due to cold weather, ice cream (-3.40%) was the lowest sold item in the four quarters.
REFERENCES
Sang-Hyo Kim and Seong-Yoon Heo. 2019. “Analyzing consumption of processed foods using POS data in Korea”. 2019 August Webzine of Agency for Food Industry Information Analysis (AFIA) Project. Korea Rural Economic Institute.
Point-of-sale data. Nielson Korea. 2019.


Trend Analysis of Processed Food Consumption Based on POS Data
Introduction
POS (point of sale) system was developed in the U.S to prevent a merchant from calculated-mistake and cheating. It is being used as an important data for understanding the market situation as the value of the structured data is recognized.
By using POS data from Nielsen Korea in 2018, we analyzed rice, porridge, and retort pouch markets as well as the current food industry and trend of the processed foods market.
POS data analysis in 2019 used retail store sales data by items provided by the Food Industry Statistics (FIS), the period from the first quarter of 2015 to the second quarter of 2019.
- As of 2019, Nielsen Korea produced and provided POS data
- Data is available from the 2011 fourth quarter. However, the analysis was conducted from the 2015 first quarter to identify trends for the last five years.
Food Industry Statistics (FIS) POS data provides information on sales for a total of 40 items. Among them, 31 items were analyzed, except for ginseng beverages, alcoholic beverages, and health functional foods, whose performance has been discontinued. The 31 items were grouped into eight similar items and each group was analyzed within the same graph to see the differences and changes between similar items.
Changes and characteristics of consumption by Item
■ Confectionery (snacks, biscuits, chocolates, and chocolate cakes)
Sales of biscuits increased slightly from the first quarter of 2015 to the second quarter of 2019. Sales in the second quarter of 2019 fell 1.0% on-year (US$23.1 million). Sales of snacks are stagnant in the medium to long-term; in the second quarter of 2019, it was US$269 million, decreased by 10% compared to the same quarter of previous year (Figure 1).
Chocolate sales were affected by special events in the first and fourth quarters, which are Valentine's Day and White Day and the College Scholastic Ability Test and Christmas, respectively. Thus, sales increased in the first and fourth quarters. Sales in chocolate were on the rise in the medium to long-term, accounting for US$130 million in the second quarter of 2019, down 8.5% compared to the same quarter of previous year (Figure 1).
The sales of chocolate cake recorded US$85.3 million in the second quarter of 2016, but the situation was barely changed in the medium to long-term. Sales in the second quarter of 2019 decreased by 8.2% compared to the same quarter of previous year, with US$57.7 million (Figure 1).
■ Bread and rice cake (bread, rice cake, and plain bread)
Sales of bread presented an increasing pattern in winter, which corresponded to the fourth quarter because of hot bread. In the medium to long-term, bread sales, in general, increased. Notwithstanding, sales decreased by 3.0% (US$64.6 million) in the second quarter of 2019 from the same quarter of previous year (Figure 2).
The rice cakes are characterized by an increase in sales between the first and fourth quarters and a decreasing tendency in the second and third quarters. In the perspectives of the medium to long-term, sales in the second quarter of 2019 increased 1.6% compared to the same quarter of previous year to US$21.9 million (Figure 2).
Sales of plain bread showed a slight increase every second quarter. However, overall sales decreased for five years, indicating that the sales in the second quarter of 2019 accounted for US$12.2 million, with 9.6% from the second quarter of 2018 (Figure 2).
■ Dairy products (milk, ice creams, cultured dairy products, and powdered milk)
Milk sales tended to increase in the second and third quarters compared to the first and fourth quarters, which are winter where a fixed rate is applied. Sales for the second quarter of 2019 were US$433 million, declined by 7.9% compared to the same quarter of previous year(Figure 3).
Ice cream had a similar pattern to milk sales, with seasonality, presenting an explosive growth in sales in the third quarter in summer. In the mid to long term, however, sales fell 8.9% compared to the same quarter of previous year to US$387 million(Figure 3).
Sales in cultured dairy tended to remain stable except for alight decline in the fourth quarter. In the second quarter of 2019, sales amounted to US$211 million, which showed a 0.9% reduction from the same quarter of previous year(Figure 3).
In the ase of powdered milk, there is no particular seasonality, although quarterly fluctuation existed. The sales showed a slight increase in the mid- to long-term, its sales in the second quarter of 2019 recorded US$29.7 million, down 7.9% compared to the same quarter of previous year(Figure 4).
■ Beverage (Soft drinks, fruit drink, soymilk, and liquid tea)
Among beverages, soft drinks accounted for the largest portion of total sales in the third quarter during the summer. In the medium to long-term, sales increased steadily. Sales in the second quarter of 2019 were US$253 million, an increase of 1.2% compared to the same quarter of previous year (Figure 5).
Fruit and vegetable drinks also featured high sales in the third quarter of summer, but sales showed a decreasing pattern in the medium to long-term. Sales in the second quarter of 2019 accounted for US$155 million, down 1.1% compared to the same quarter of previous year (Figure 5).
Soymilk sales remained on a stable trend. In the case of liquid tea, however, a slight increase in the medium to long-term occurred with sales rising in the third quarter of the summer. Soymilk's sales for the second quarter of 2019 decreased by 6.7% compared to the same quarter of previous year to US$73 million, and ones of liquid tea decreased by 4.0% to US$76.8 million (Figure 5).
■ Coffee (bottled and canned coffee, prepared coffee, instant coffee)
Bottled and canned coffee spiked their sales in the third quarter in summer and sales presented a low level of performance in the first quarter. Recent sales are shown relatively steep growth. Sales in the second quarter of 2019 were US$318 million, increasing up to 3.2% compared to the same quarter of previous year.
In contrast to bottled and canned coffee, powdered coffee (three-in-one coffee, which consists of coffee, sugar, and crime) showed a high amount of sales in the first quarter, while their sales are low in the other quarter. In the mid- to long-term, sales declined. Sales for the second quarter of 2019 accounted for US$176 million, down 5.3% compared to the same quarter of previous year.
Instant coffee, called soluble coffee, tended to increase slightly in the first and third quarters. It also recorded sales of between US$43.5 million and US$52.2 million per quarter. Sales in the second quarter of 2019 were attained US$49.7 million, down 5.1% compared to the same quarter of previous year (Figure 6).
■ Oil and seasoning (edible oil, seasoning, and traditional oil)
Cooking oil spiked in the first and third quarters due to Lunar New Year and Chuseock holiday, respectively. Sales, in general, presented a slight decrease in the medium to long-term in the second quarter of 2019, which reached US$46.5 million, up 3.2% compared to the same quarter of previous year.
Sales in seasonings are shown a meager increase in the fourth quarter; nevertheless, it remained on a downward trend. In the second quarter of 2019, sales amounted to US$26.6 million, indicating a 9.0% compared to the same quarter of previous year.
Traditional oil (such as sesame oil, perilla oil, and so forth) had the same characteristics as cooking oil, with sales concentrated in the first and the third quarters. As seasoning sales, which tended to decline slightly over the medium to long-term, US$19.5 million of traditional oils were sold in the second quarter of 2019, down 6.5% compared to the same quarter of previous year (Figure 7).
■ Korean paste and Kimchi (soy sauce, red pepper paste, soybean pastes, kimchi, and other seasonings)
Kimchi had the highest sales in the third quarter. There was no relation between Kimchi sales and vacation and comping demands. Sales of Kimchi continued to grow steadily with a significant increase, presenting US$49.1 million of sales in the second quarter, up 8.7% from the same quarter of previous year (Figure 8).
Soy sauce showed a slightly high amount of sales in the third quarter. Sales in the second quarter of 2019 reached US$45.6 million, down 2.1% compared to the same quarter of previous year.
Red pepper pastes peaked in sales every second and third quarters. Nevertheless, in the long run, sales had been on the decline, and sales in the second quarter of 2019, falling by 10.9% compared to the same quarter of previous year to US$41 million.
Sales of Soybean paste had a fluctuating pattern for quarters, with a slight increase and decrease figures around US$17.4 million. Sales in the second quarter of 2019 were US$19.8 million, up 0.9% compared to the same quarter of previous year (Figure 9).
■ Other foods (ramen, processed meat, instant and Home Meal Replacement (HMR) foods, dumpling, and bean curb)
Ramen sales were relatively high from the fourth quarter to the first quarter of winter, but the recent increase in sales was not large. Sales of Ramen had been on a slight rise in the mid- to long-term, sales in the second quarter of 2019 increased by 2.8% compared to the same quarter of previous year to US$429 million (Figure 10).
Instant Home Meal Replacements (HMR) is characterized by relatively high sales in the third quarter due to vacation and camping demand. HMR sales had been growing rapidly in the mid- to long-term, indicating US$191 million in the second quarter of 2019 with an 8.3% increase compared to the same period last year (Figure 10).
Dumpling sales are relatively high from the fourth to the first quarter, which were the winter season. Medium to long-term sales are small but on the rise. Meanwhile, in the second quarter of 2019, sales amounted to US$90.2 million, up 3.6% compared to the same period last year (Figure 11).
Sales of bean curb recorded around US$87 million per quarter, and sales in the second quarter of 2019 were US$90.3 million, down 5.9% compared to the same period last year (Figure 11).
Changes and characteristics of consumption by distribution type
The proportion of by distribution type presented below. The sales share of large discount stores accounted for the highest portion (25.8%) of the total sales in 2018 and increased by 0.4% compared to the ones of 2015. On the other hand, sales of convenience stores increased sharply, indicating 25.1% in 2015, with a 5.0% increase in share from 2015 (Figure 12).
The change in convenience store’s share resulted from the steady promotion of new stores with numerous label products or private band (PB) products, and competition within stores while large discount stores struggled with restrictions on stores, mandatory shutdowns, and growth of online channels (Figure 12).
The proportion of chain supermarkets remained at 18%, while the ratio of independent supermarkets and grocery stores decreased by 1.5% point and 3.9% point, respectively. The percentage of sales in department stores rose slightly by 0.1% (Figure 12).
The following figure showed the reduction rate of 2018 sales compared to that of 2015 sales. Therefore, it is possible to look at changes in share by distribution type in detail (Figure 13).
Sales of processed foods examined a 34% increase at convenience stores in 2018 compared to that of 2015, while sales at large discount stores and chain supermarkets increased by only 8.7% and 7.2% during the same period, respectively. However, independent supermarkets’ sales decreased by 1.1%. Moreover, sales of general grocery stores declined 19.8%, which showed that it is the least accessible distribution channel regarding processed foods (Figure 13).
Analysis of sales share and rate of change
Y-axis is composed of the percentage of 37 processed foods’ sales in total sales of processed foods in the second quarter of 2019, conducted on the average value.
The first quadrant indicates items with a high growth rate and high specificity. The second one means a high growth rate but without a high specific weight. The third quadrant includes a low growth rate and low specific. The fourth quadrant shows a high proportion of items but slows growth (Figure 14).
Items located in the first quadrant, which have both a high growth rate and a high proportion, consist of instant foods, instant coffee, soft drinks, and cultured dairy products (Figure 14).
Fast-growing sales of instant foods, Home Meal Replacements (HMR), bottled and canned coffee, and soft drinks had an impact on the growth of the processed food market in the year 2019(Figure 14).
Beverage products such as bottled and canned coffee, soft drinks, and cultured dairy products are popular, and both the percentage of processed food market and sales growth rate are high (Figure 14).
Kimchi, rice cake, and dumpling, which are placed in the second quadrants, not taking a big part yet, but is expected to grow as a major processed food in the future as it had presented a rapid growth, taking into account a decreasing demand for Kimjang (the traditional process of preparation and preservation of kimchi) and an increasing demand for snacks (Figure 14).
Commonly consumed items such as ramen, milk and snacks, are located in the fourth quadrant as sales had decreased. It is difficult expanding its demand in such a saturated market (Figure 14).
Also, seasonal chocolate, prepared coffee, and ice creams are big factors to cause declines in sales year-on-year (Figure 14).
The five most-selling items in the quarter
■ For each quarter, select items with particularly high or low sales.
We examined the five most sold items as following steps. First, we identify the most sold processed foods in the first quarter by calculating the percentage of individual processed food sales out of the total sales of 37 processed food items. Secondly, we calculated the average of five shares in the first quarter from the first quarter of 2015 to the second quarter of 2019 (=a). Then, we also calculated the average weights for all quarters other than the first quarter of 2015 to the second quarter of 2019 (=b). Lastly, we sorted the differences between a and b values to select up to the five most-selling items.
The most-selling processed foods in the first quarter, where include events such as White Day, Valentine's Day, and New Year's Day, were chocolate (+1.34%), processed meat (+1.15%), crude coffee (+0.82%), edible oil (+0.76%), and canned tuna (+0.69%). On the other hand, the least-selling items in the first quarter were glaciers (-3.05%), bottled and canned coffee (-1.62%), soft drinks (-0.63%), sugar (-0.48%), and milk (-0.48%). We can interpret that processed foods as a gift had become common especially chocolate and processed meat. Meanwhile, cold weather led to low sales of sugar and milk, which are also used as ingredients for soft drinks, ice creams and ice water.
The five most sold processed foods in the second quarter were found to be ice creams (+ 2.41%), sugar (+0.79%), bottled and canned coffee (+0.45%), milk (+0.45%) and soft drinks (+0.40%). On the other hand, processed meat (-1.17%), chocolate (-1.07%), edible oil (-0.79%), canned tuna (-0.63%), and dumpling (-0.42%) showed lower sales in the second quarter than the other quarters. This is because cooking is relatively difficult due to the weather.
As the summer season is in full swing, the top processed foods in the third quarter, where the Chuseok holiday takes place, were still +4.14%, the gap between second-placed meat products (+ 1.40%) was the highest in four quarters. Sales of meat processed products and liquid coffee (+1.05%) appear to have increased in line with camping demand. Normally, bottled and canned coffee recorded a lot of sales in the second and third quarters, and prepared coffee, which is typical of drinking in warm, had high sales in the first quarter. On the other hand, chocolate, ramen, prepared coffee, biscuits, and snacks are classified as the lowest-selling items in the third quarter.
With the start of the winter season, chocolate (+ 1.59%) was the top-selling processed food in the fourth quarter, including the Chuseok holiday (some years) and the Christmas and school Scholastic Ability Test.
Because of cold weather, warm ramen (+ 1.01%) and bread (+ 0.73%), such as Hoppang, are the only top five items in the quarter. On the other hand, due to cold weather, ice cream (-3.40%) was the lowest sold item in the four quarters.
REFERENCES
Sang-Hyo Kim and Seong-Yoon Heo. 2019. “Analyzing consumption of processed foods using POS data in Korea”. 2019 August Webzine of Agency for Food Industry Information Analysis (AFIA) Project. Korea Rural Economic Institute.
Point-of-sale data. Nielson Korea. 2019.