ABSTRACT
Statistics Korea (KOSTAT) had quarterly conducted the Household Income and Expenditure Survey (HIES) to analyze households’ current conditions and changes of living until 2016. In 2017, the Household Income and Expenditure Survey was divided into two sections: a quarterly survey on household income and an annual survey on household expenditure. In the expenditure survey in 2017, the data consisted of account books written by 1,000 households every month. This article analyzes the state and the prospects of Korean households’ expenditure on processed foods, based on the raw data analysis of the Household Income and Expenditure Survey conducted by Statistics Korea. In addition, we analyzed the expenditure on processed foods of Korean Households by a set of demographic factor, including age of household head, household size, and household income.
HOUSEHOLD EXPENDITURE ON FOOD BY CATEGORY IN 2017
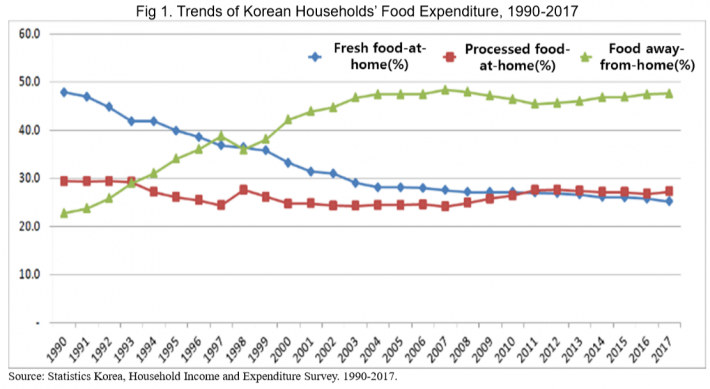
Food expenditure was divided into three categories: 1) fresh food-at-home, 2) processed food-at-home, and 3) food away-from-home. The share of expenditure on food away from home in total food expenditure had rapidly increased in the 1990s and accounted for almost 50%. On the other hand, the share of expenditure on fresh food at home in total food expenditure had continuously decreased in the same period. Since 2010, it has been smaller than the share of expenditure on processed food at home.
The share for expenditure on food away from home had exceeded the share for processed food at home since 1993 and the share for fresh food at home since 1999. The share for processed food at home outpaced the share for fresh food at home in 2011. Although it had flattened until the 2000s, it has slightly increased in the 2010s.
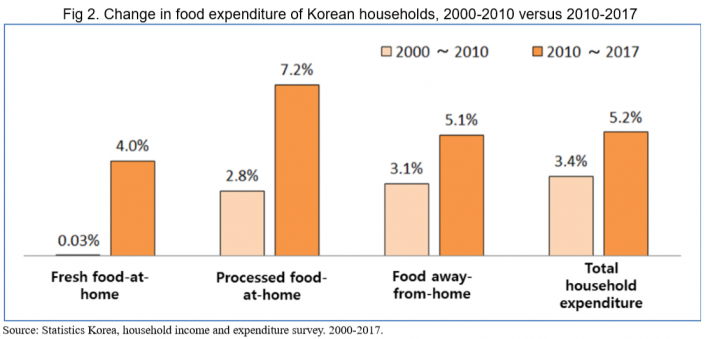
The average annual growth rates in food expenditure were examined by category (i.e. household expenditure on fresh food at home, processed food at home, and food away from home). The average annual rate of increase in processed food expenditure increased from 2.8% in 2000-2010 to 7.2% in 2010-2017, which showed acceleration in processed food spending growth.
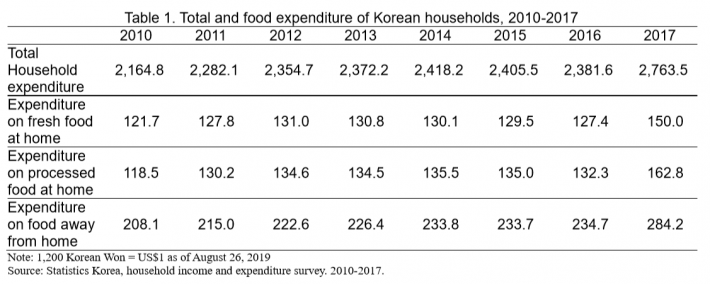
The monthly average expenditure (nominal) on processed food at home per household in 2017 was US$162.8 with the highest annual growth of 23.0% compared to 2016. The monthly average expenditure on fresh food at home and food away from home were US$150.0 with an annual growth of 17.8% and US$284.2 with an annual growth of 21.1%, respectively.
COMPOSITION OF SPENDING ON PROCESSED FOODS AT HOME IN 2017
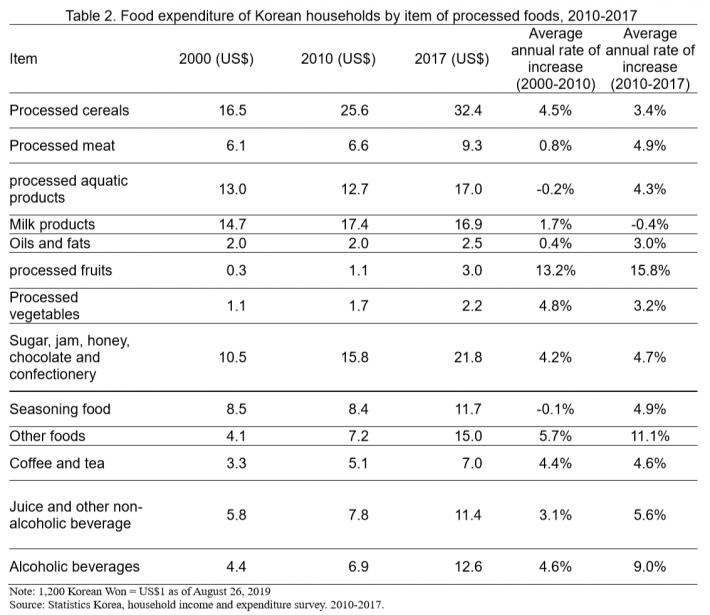
In 2017, households allotted the highest proportion of their expenditure on processed food (19.9 percent) for processed cereals (flour/noodles/ramen/cellophane noodles/tofu, etc.); 13.4% for sugar and confectionery (sugar/chocolate/candy/confectionery/ice cream, etc.). The share for processed cereals had continuously increased to around 20 percent since the late 2000s. Also, the share for sugar and confectionary had increased to around 15 percent.
On the other hand, milk products (milk/milk powder/cheese/yogurt/soybean milk, etc.), and processed aquatic products (salt-dried fish/fish cake/crab meat/canned fish/salted fish) gradually decreased to 10.4 percent and 10.5 percent respectively in 2018.
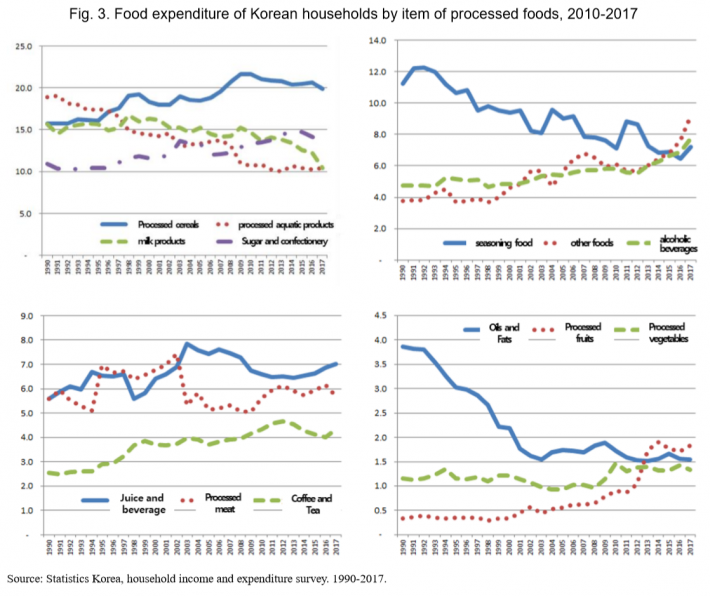
The shares for “Juice and other non-alcoholic beverage”, “coffee and tea”, “processed fruits”, “processed vegetables”, “other foods” (porridge and soup/baby foods/side dishes/kimchi/instant and freeze foods), and “alcoholic beverages” had continued to grow. However, the shares for “seasoning food” (dried pepper/spice/paste, etc.) and “Oils and fats” (sesame oil/perilla oil/butter, etc.) had a downward trend, affected by a decreasing trend in food-at-home.
In the 2010s, most of the items showed acceleration in the growth of expenditure compared to the 2000s, while the growth of expenditures on “processed cereals”, “milk products”, and “processed vegetables” slowed down or decreased.
The most rapidly increasing items were “processed fruits”, “other foods”, and “alcoholic beverages” among all the items in the 2010s. Expenditure on “processed fruits” had a relatively low share of total processed food expenditure but greatly increased from 1.1 US$ in 2010 to 3.0 US$ in 2017. Also, expenditures on “other foods” and “alcoholic beverages” rapidly increased, driven by the growth of Home Meal Replacement (HMR) and home drinking.
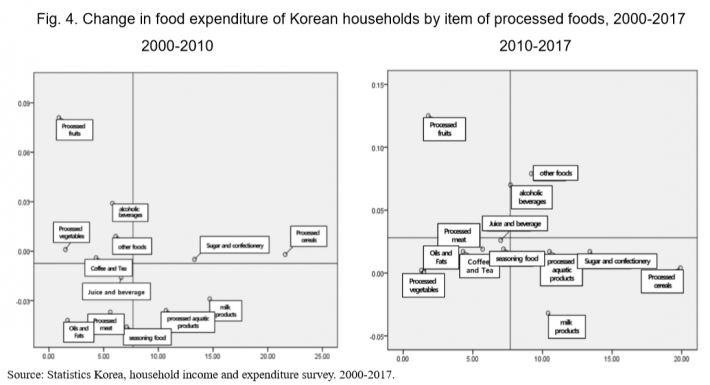
There are two axes of measure. First, the vertical axis represents average annual increase rate over the period 2000-2010 and 2010-2017. Second, the horizontal axis measures each item's share of total expenditure on processed food at the end of the period. In the first quadrant, the items that have both high rates of increase and shares are placed. The second quadrant implies that the items have high rates of increase but low shares. The items that have both low rates of increase and shares are in the third quadrant. In the fourth quadrant, the items have high shares but slowed down in spending growth.
“Processed cereals” and “sugar, jam, honey, chocolate and confectionery”, which accounted for large shares with high rates of increase over the period 2000-2010, continuously comprised large shares until 2017. However, the increase rates slowed down. Between 2000 and 2010, the shares for “other foods” and “alcoholic beverages” were not high, while the rates of increase were high. They continued to grow to its large shares in 2017.
With a high growth rate, “processed fruits” was placed in the second quadrant over the period 2000 to 2010. However, it was still in the second quadrant in 2017 because the amount of expenditure was too small despite a high growth rate. As “processed vegetables” and “coffee and tea” did not show relatively high increase rates, they moved from second quadrant to third quadrant.
There are two axes of measure. First, the vertical axis represents average annual increase rate over the period 2000-2010 and 2010-2017. Second, the horizontal axis measures each item's share of expenditure on processed food at the end of the period. In the first quadrant, the items that have both high rates of increase and shares are placed. The second quadrant implies that the items have high rates of increase but low shares. The items that have both low rates of increase and shares are in the third quadrant. In the fourth quadrant, the items have large shares but slowed down in spending growth.
The items in the first quadrant, which had both high growth rates and shares from 2000 to 2010, were “breads”, “Korean sweets and other confectionery”, “instant and freeze foods”, “side dishes”, “beer”, “soju”, “ice cream”, “coffee”, and “processed vegetables”. Among these items, instant and freeze foods, beer, side dishes, and soju remained in the first quadrant over the period 2010-2017. On the other hand, breads, Korean sweets and other confectionery, coffee, and ice cream still accounted for large shares but grew slower, and lied in the fourth quadrant.
“Milk”, “yogurt”, “ice cream”, “laver”, and “rice cake” were placed in the fourth quadrant in 2000-2010 as well as in 2010-2017. “Soy sauce”, “Kochujang”, and “milk powder” in the third quadrant had both low shares and growth rates over the period 2000-2010 to 2010-2017.
”Processed Fruits”, “Kimchi”, and “bottled water” were located in the second quadrant with low shares but high growth rates. Since then, the shares for these items exceeded the average with a steady increase in spending growth and moved to the first quadrant.
“Salted fish” and “baby foods” showed high growth rates and moved from the third quadrant to the second quadrant. The high growth rates of “chocolate”, “sausage”, “cheese”, “porridge and soup”, “fruit liquor”, and “candy and jelly” had remained constant, but the amount of expenditures on them was not large, leading to be in the second quadrant where the shares were below the average.
EXPENDITURE ON PROCESSED FOOD BY ITEMS IN 2017
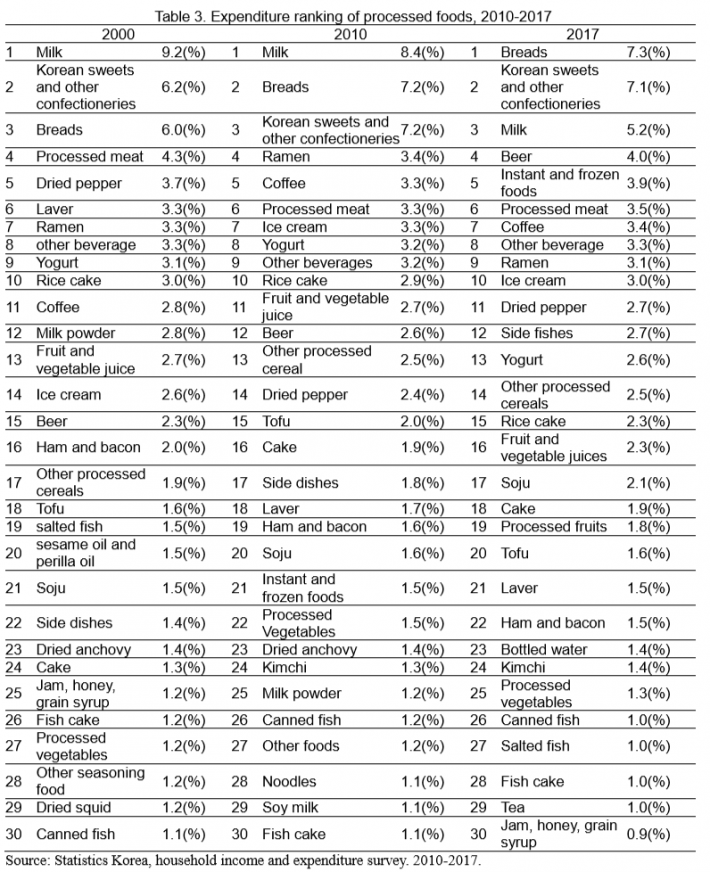
The table below shows the 30 major items of expenditure on processed food in 2000, 2010 and 2017 respectively. In 2000, 2010, and 2017 “milk”, “Korean sweets and other confectionery”, “breads” ranked first to third. Milk ranked first with 9.2% in 2000 and 8.4% in 2010, but ranked third with 5.2% in 2017. Breads ranked third with 6.0% in 2000, second with 7.2% in 2010 and first with 7.3% in 2017.
“Beer” ranked 15th with 2.3% in 2000, 12th with 2.6% in 2010, and 4th with 4.0% in 2017. “Instant and freeze foods” were out of the ranking in 2000 but ranked up to 21st in 2010 with 1.5% and 5th in 2017 with 3.9%. “Side dishes” also rose from 22nd in 2000 with 1.4% to 12th in 2010 with 2.7%.
The items that were not included in the top 30 items until 2010 but newly ranked in 2017 were “processed fruits”(1.8%, 19th) and “bottled water”(1.4%, 23rd).
EXPENDITURE ON PROCESSED FOODS BY DEMOGRAPHIC FACTORS
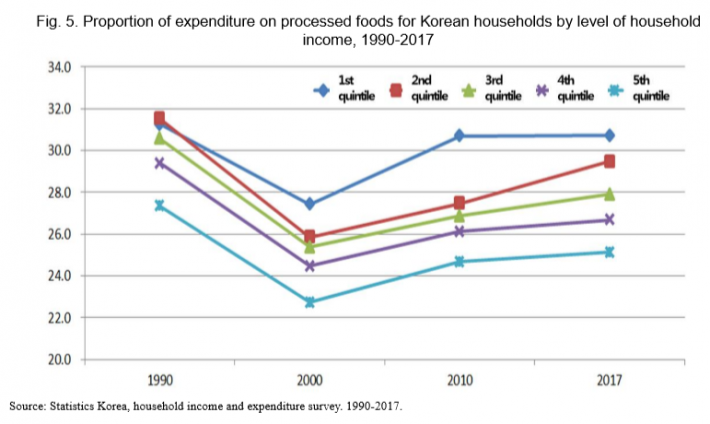
The graph below shows the percent change in spending for processed food by income quintile. Spending on processed food declined in all five quintiles in 2000, but since then it turned to an upward trend.
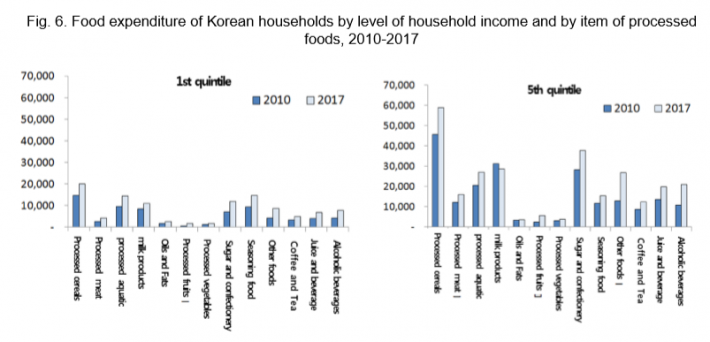
In 2017, households in the fifth income quintile spent an average of US$916.7 per month on food. Of total spending on food, 25.1% t (US$233.3) was allocated for processed food. For households in the first income quintile, the average monthly expenditure on food was US$300.0, and processed food accounted for 30.7% (US$92.5) of total food expenditure.
Households in the first income quintile spent more money on processed cereals, seasoning food, processed fish, sugar and confectionery, while spending on processed cereals, sugar, confectionery, milk products, and other foods were high in households in the fifth income quintile.
Items with the highest rate of spending growth from 2010 to 2017 were seasoning food for the first income households and other foods for the fifth income households.
Note: 1,200 Korean Won = US$1 as of August 26, 2019
Source: Statistics Korea, household income and expenditure survey. 2010-2017.
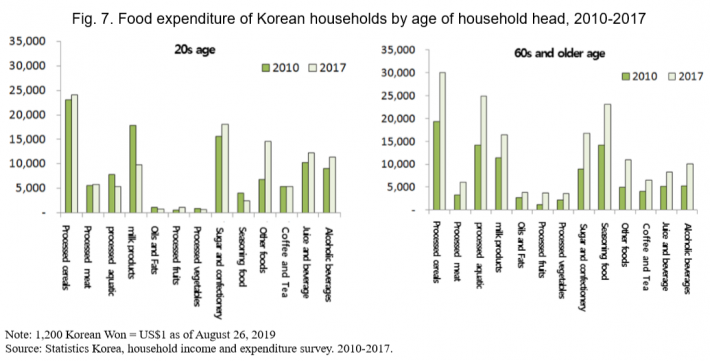
For the householders in the 20s age range, spending on milk products, processed fish, and seasoning food decreased in 2017, compared to 2010. On the other hand, spending on other foods, sugars and confectionery, alcoholic beverages, juice, and other non-alcoholic beverage increased, which was a remarkable characteristic of them. In 2017, the highest item of their spending on processed food was processed cereals, followed by sugars and confectionery, and other foods.
In the case of householders in the 60s and older age range, spending on all the items increased in 2017, compared to 2010. Among the items, spending on processed cereals, processed fish, seasoning food, sugars and confectionery, and other foods significantly increased.
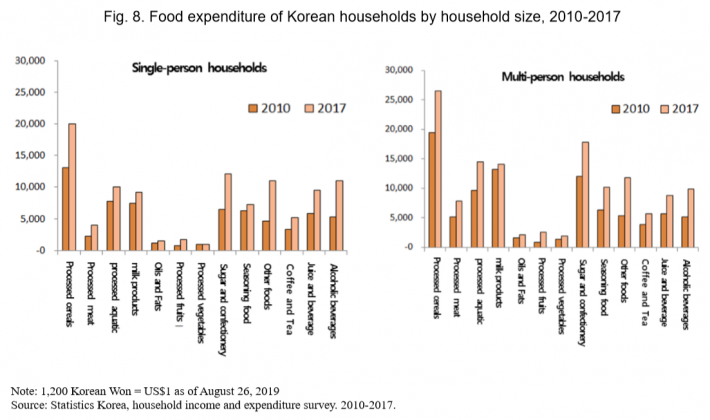
In the case of single-person households, spending on processed cereals was the largest part of spending on processed food, amounting to US$16.7 per month, followed by sugars and confectionery (US$10.1), alcoholic beverages (US$9.2), and other foods (US$9.2). The highest ranked category of multi-person households was processed cereals (US$22.1), followed by sugars and confectionery (US$14.8), processed fish (US$12.1), and milk products (US$11.7).
Both single- and multi-person households showed the largest increase in spending on processed cereals and other foods in 2017, compared to 2010. Single-person households tended to spend more on milk products, juice and other non-alcoholic beverage, and alcoholic beverage compared with multi-person households. On the other hand, multi-person households tended to spend more on processed meat, processed fish, processed fruits, processed vegetables, and seasoning food compared with single-person households.
Proportion of total spending on processed food was examined by several demographic factors, including income, age, and the number of household members. In comparison by each factor, two groups were compared (households in the first quintile of income and households in the fifth quintile of income; householders in the 20s age range and householders in the 60s and older age range; single-person households and multi-person households).
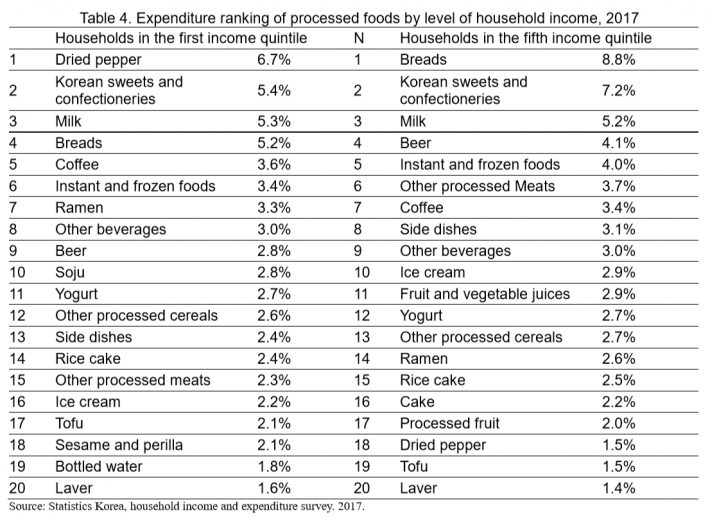
In the fifth income households, the item with the largest share of spending on processed food was “breads”(8.8%), followed by “Korean sweets and confectionery”(7.2%), “milk” (5.2%), “beer” (4.1%) and “instant and freeze food” (4.0%). The rates of increase of instant and freeze foods (19.9%), baby foods (17.4%), and candy and jelly (14.7%) were high for this group.
In the case of the first income households, dried red pepper, sesame and perilla, soju, and bottled water accounted for high shares. For the fifth income households, fruit and vegetable juices, cakes, and processed fruits were included in the top 20 items of household spending on processed food by income quintile, which was a relative difference from the first income households.
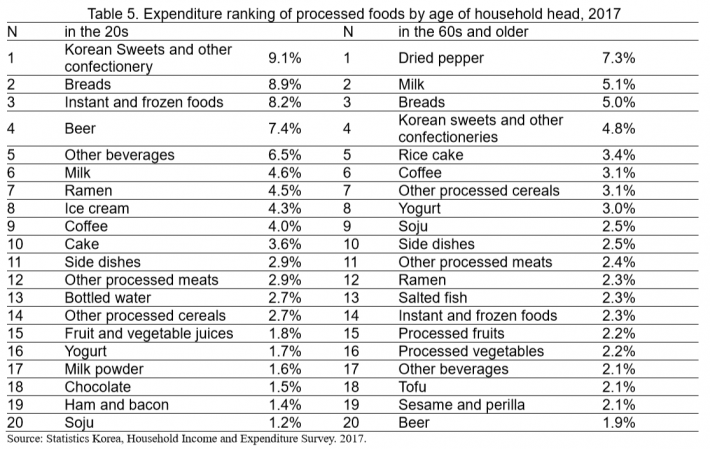
For householders in the 20s age range, the item with the largest share of spending on processed food was “Korean sweets and other confectionery”(9.1%), followed by “breads”(8,9%), “instant and freeze food”(8.2%), “beer”(7.4%), “other beverages”(6.5%), and the items with the high rates of increase were “instant and freeze foods”(28.6%), “bottled water”(13.7%), “butter, other oils and fats”(11.2%). Householders in the 60s and older age range showed large shares of “dried pepper”(7.8%), “milk”(5,1%), “breads”(5.0%), “Korean sweets and other confectionery”(4.8%), and “rice cake”(3.4%). Also, the items with high rates of increase were “other processed milk”(24.5%), “baby foods”(23.9%), and “instant and frozen food”(23.3%).
For householders in the 20s age range, instant and freeze foods, beer, other beverages, ice cream, cakes, bottled water, fruits and vegetable juices, ham and bacon, milk powder, and chocolate were ranked relatively high. For householders in the 60s and older age range, dried red peppers, rice cakes, salted fish, tofu, sesame and perilla were ranked high.
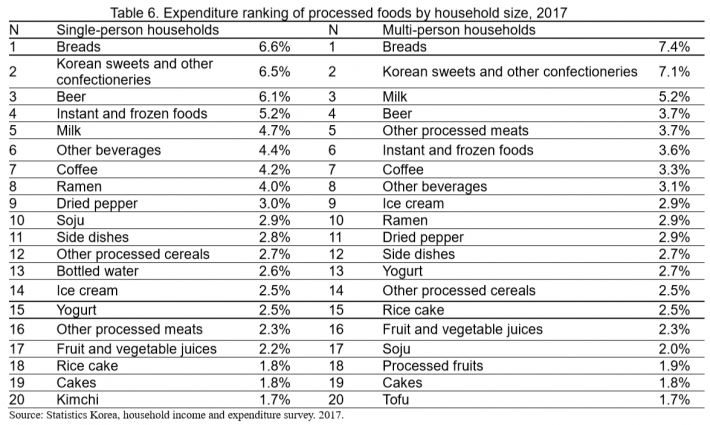
For single-person households, breads made up the largest proportion of spending on processed foods, accounting for 6.6%, followed closely by Korean sweets and other confectionery (6.5%), beer (6.1%), instant and freeze foods (5.2%), and milk (4.7%), The fastest growth was in instant and freeze foods, growing by 34.6%, followed by butter and other oils and fats (27.3%) and other milk products(26.6%). For multi-person households, breads had the largest proportion of spending on processed food, accounting for 7.4%, followed by Korean and other confectioneries (7.1%) and milk (5.2%). The fastest growing item was baby foods (20.5%), followed by instant and freeze foods (19.7%) and processed fruits (17.8%).
In the case of single-person households, bottled water and kimchi were included in the ranking, while processed fruits and tofu were included in the ranking for multi-person households. Sausages, breads, crab meat, and ice cream were included in the fast growing items of single-person households, while baby foods, side dishes, salted fish, fruit liquor, sesame and perilla, and dried corvinas were included in the fast growing items of multi-person households.
PROJECTED PROPORTION OF FOOD EXPENDITURE OF HOUSEHOLDS
We used household food expenditure raw data that were collected from the first quarter of 1990 to 2017 to estimate proportions of food expenditure in 2018-2020; Quarterly data were collected until 2016 and annual data collected in 2017 were quartered using interpolation method with an average of increase rate. In the time-series econometric model used for this prospect, variables about the change in food expenditure of households are time trend, seasonality (i.e. quarterly dummy variable), dummy variable regarding the point of change in the structure of food expenditure demonstrated by previous studies, the average age of householders, the average number of household members, and the average household income (or the total amount of consumer spending as a proxy variable).
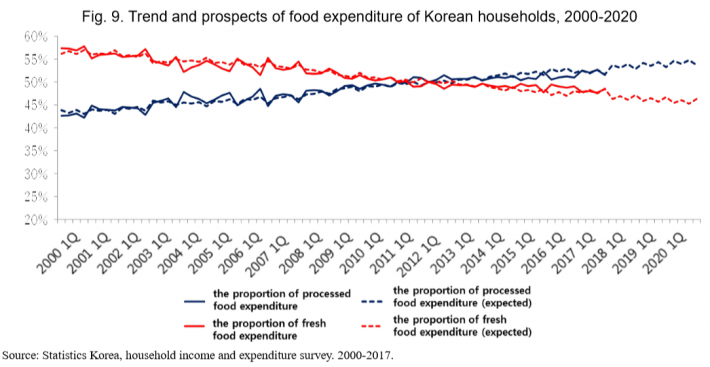
We categorized food expenditure of households into fresh foods and processed foods and investigated each of them for future prospects. As a result, the proportion of fresh foods expenditure is expected to decrease slightly, while the proportion of processed foods expenditure is expected to increase gradually. The proportion of processed foods expenditure, which was 51.5% in 2017, is expected to increase to 53.4% in 2018, 53.8% in 2019, and 54.2% in 2020. On the other hand, the proportion of fresh foods expenditure, which was 48.5% in 2017, is expected to decrease to 45.8% in 2020. However, it is worth noting that increasing consumption of Home Meal Replacement (HMR) might affect not only the proportion of processed food and fresh food expenditure of households, but also expenditure in home meals and eat-outs.
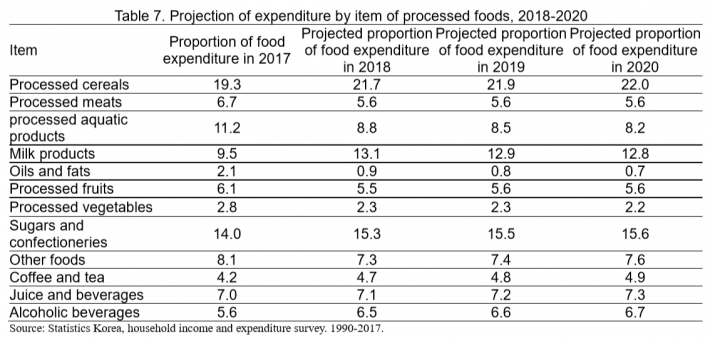
Next, the processed foods expenditure of households was categorized into 12 items to project proportions of expenditure in each item. For processed grains, the proportion of expenditure, which was initially 19.3%, is likely to increase to 22.0% in 2020. On the other hand, that of processed meat is projected to decline from 6.7% to 5.6% in 2020. The items that are expected to decrease are processed meat, processed seafood, processed fats and oils, processed fruits, processed vegetables, and other foods. The items expected to increase are processed grains, processed dairy foods, sweets and snacks, coffee and tea, juice and beverages, and alcohol. Our findings have the following limitations: 1) Our findings are only applicable to households; 2) Our findings might have been affected by the quality of raw statistical data; and 3) It is possible that statistical results may slightly vary based upon types of projection models. Therefore, such limitations should be considered to interpret the results.
DISCUSSION AND POLICY IMPLICATIONS
In Korea, processed food expenditure has increased rapidly since 1990. As a result, household spending on processed food now accounts for a higher proportion than spending on fresh food. Various demographic factors, such as an increase in single-person households, an increase in income levels, and an aging population, are driving the expansion of consumption of processed foods, which is expected to intensify in the future. Accordingly, processed food consumption is also expected to increase at least in the near future. In addition to the information on the share of processed foods in the overall diet, the information on which processed food items are being consumed at the fastest rate, and the characteristics of processed food consumption by sociodemographic groups provide useful information about the food industry’s product development and market prospects. Furthermore, it is expected that the information presented in this article will provide food and health policy makers with valuable insights on the dietary life and nutritional status of the Korean population.
REFERENCES
Lee, K.Y., et al. 2017. Report of the Agency for Food Industry Information Analysis. Korea Rural Economic Institute. http://www.krei.re.kr/foodInfo/selectBbsNttList.do?bbsNo=434&key=749
Statistics Korea. Household Income and Expenditure Survey. 1990-2017.
|
Date submitted: July 30, 2019
Reviewed, edited and uploaded: September 2, 2019
|

The State and the Prospects of Korean Households’ Expenditure on Processed Food in 2017
ABSTRACT
Statistics Korea (KOSTAT) had quarterly conducted the Household Income and Expenditure Survey (HIES) to analyze households’ current conditions and changes of living until 2016. In 2017, the Household Income and Expenditure Survey was divided into two sections: a quarterly survey on household income and an annual survey on household expenditure. In the expenditure survey in 2017, the data consisted of account books written by 1,000 households every month. This article analyzes the state and the prospects of Korean households’ expenditure on processed foods, based on the raw data analysis of the Household Income and Expenditure Survey conducted by Statistics Korea. In addition, we analyzed the expenditure on processed foods of Korean Households by a set of demographic factor, including age of household head, household size, and household income.
HOUSEHOLD EXPENDITURE ON FOOD BY CATEGORY IN 2017
Food expenditure was divided into three categories: 1) fresh food-at-home, 2) processed food-at-home, and 3) food away-from-home. The share of expenditure on food away from home in total food expenditure had rapidly increased in the 1990s and accounted for almost 50%. On the other hand, the share of expenditure on fresh food at home in total food expenditure had continuously decreased in the same period. Since 2010, it has been smaller than the share of expenditure on processed food at home.
The share for expenditure on food away from home had exceeded the share for processed food at home since 1993 and the share for fresh food at home since 1999. The share for processed food at home outpaced the share for fresh food at home in 2011. Although it had flattened until the 2000s, it has slightly increased in the 2010s.
The average annual growth rates in food expenditure were examined by category (i.e. household expenditure on fresh food at home, processed food at home, and food away from home). The average annual rate of increase in processed food expenditure increased from 2.8% in 2000-2010 to 7.2% in 2010-2017, which showed acceleration in processed food spending growth.
The monthly average expenditure (nominal) on processed food at home per household in 2017 was US$162.8 with the highest annual growth of 23.0% compared to 2016. The monthly average expenditure on fresh food at home and food away from home were US$150.0 with an annual growth of 17.8% and US$284.2 with an annual growth of 21.1%, respectively.
COMPOSITION OF SPENDING ON PROCESSED FOODS AT HOME IN 2017
In 2017, households allotted the highest proportion of their expenditure on processed food (19.9 percent) for processed cereals (flour/noodles/ramen/cellophane noodles/tofu, etc.); 13.4% for sugar and confectionery (sugar/chocolate/candy/confectionery/ice cream, etc.). The share for processed cereals had continuously increased to around 20 percent since the late 2000s. Also, the share for sugar and confectionary had increased to around 15 percent.
On the other hand, milk products (milk/milk powder/cheese/yogurt/soybean milk, etc.), and processed aquatic products (salt-dried fish/fish cake/crab meat/canned fish/salted fish) gradually decreased to 10.4 percent and 10.5 percent respectively in 2018.
The shares for “Juice and other non-alcoholic beverage”, “coffee and tea”, “processed fruits”, “processed vegetables”, “other foods” (porridge and soup/baby foods/side dishes/kimchi/instant and freeze foods), and “alcoholic beverages” had continued to grow. However, the shares for “seasoning food” (dried pepper/spice/paste, etc.) and “Oils and fats” (sesame oil/perilla oil/butter, etc.) had a downward trend, affected by a decreasing trend in food-at-home.
In the 2010s, most of the items showed acceleration in the growth of expenditure compared to the 2000s, while the growth of expenditures on “processed cereals”, “milk products”, and “processed vegetables” slowed down or decreased.
The most rapidly increasing items were “processed fruits”, “other foods”, and “alcoholic beverages” among all the items in the 2010s. Expenditure on “processed fruits” had a relatively low share of total processed food expenditure but greatly increased from 1.1 US$ in 2010 to 3.0 US$ in 2017. Also, expenditures on “other foods” and “alcoholic beverages” rapidly increased, driven by the growth of Home Meal Replacement (HMR) and home drinking.
There are two axes of measure. First, the vertical axis represents average annual increase rate over the period 2000-2010 and 2010-2017. Second, the horizontal axis measures each item's share of total expenditure on processed food at the end of the period. In the first quadrant, the items that have both high rates of increase and shares are placed. The second quadrant implies that the items have high rates of increase but low shares. The items that have both low rates of increase and shares are in the third quadrant. In the fourth quadrant, the items have high shares but slowed down in spending growth.
“Processed cereals” and “sugar, jam, honey, chocolate and confectionery”, which accounted for large shares with high rates of increase over the period 2000-2010, continuously comprised large shares until 2017. However, the increase rates slowed down. Between 2000 and 2010, the shares for “other foods” and “alcoholic beverages” were not high, while the rates of increase were high. They continued to grow to its large shares in 2017.
With a high growth rate, “processed fruits” was placed in the second quadrant over the period 2000 to 2010. However, it was still in the second quadrant in 2017 because the amount of expenditure was too small despite a high growth rate. As “processed vegetables” and “coffee and tea” did not show relatively high increase rates, they moved from second quadrant to third quadrant.
There are two axes of measure. First, the vertical axis represents average annual increase rate over the period 2000-2010 and 2010-2017. Second, the horizontal axis measures each item's share of expenditure on processed food at the end of the period. In the first quadrant, the items that have both high rates of increase and shares are placed. The second quadrant implies that the items have high rates of increase but low shares. The items that have both low rates of increase and shares are in the third quadrant. In the fourth quadrant, the items have large shares but slowed down in spending growth.
The items in the first quadrant, which had both high growth rates and shares from 2000 to 2010, were “breads”, “Korean sweets and other confectionery”, “instant and freeze foods”, “side dishes”, “beer”, “soju”, “ice cream”, “coffee”, and “processed vegetables”. Among these items, instant and freeze foods, beer, side dishes, and soju remained in the first quadrant over the period 2010-2017. On the other hand, breads, Korean sweets and other confectionery, coffee, and ice cream still accounted for large shares but grew slower, and lied in the fourth quadrant.
“Milk”, “yogurt”, “ice cream”, “laver”, and “rice cake” were placed in the fourth quadrant in 2000-2010 as well as in 2010-2017. “Soy sauce”, “Kochujang”, and “milk powder” in the third quadrant had both low shares and growth rates over the period 2000-2010 to 2010-2017.
”Processed Fruits”, “Kimchi”, and “bottled water” were located in the second quadrant with low shares but high growth rates. Since then, the shares for these items exceeded the average with a steady increase in spending growth and moved to the first quadrant.
“Salted fish” and “baby foods” showed high growth rates and moved from the third quadrant to the second quadrant. The high growth rates of “chocolate”, “sausage”, “cheese”, “porridge and soup”, “fruit liquor”, and “candy and jelly” had remained constant, but the amount of expenditures on them was not large, leading to be in the second quadrant where the shares were below the average.
EXPENDITURE ON PROCESSED FOOD BY ITEMS IN 2017
The table below shows the 30 major items of expenditure on processed food in 2000, 2010 and 2017 respectively. In 2000, 2010, and 2017 “milk”, “Korean sweets and other confectionery”, “breads” ranked first to third. Milk ranked first with 9.2% in 2000 and 8.4% in 2010, but ranked third with 5.2% in 2017. Breads ranked third with 6.0% in 2000, second with 7.2% in 2010 and first with 7.3% in 2017.
“Beer” ranked 15th with 2.3% in 2000, 12th with 2.6% in 2010, and 4th with 4.0% in 2017. “Instant and freeze foods” were out of the ranking in 2000 but ranked up to 21st in 2010 with 1.5% and 5th in 2017 with 3.9%. “Side dishes” also rose from 22nd in 2000 with 1.4% to 12th in 2010 with 2.7%.
The items that were not included in the top 30 items until 2010 but newly ranked in 2017 were “processed fruits”(1.8%, 19th) and “bottled water”(1.4%, 23rd).
EXPENDITURE ON PROCESSED FOODS BY DEMOGRAPHIC FACTORS
The graph below shows the percent change in spending for processed food by income quintile. Spending on processed food declined in all five quintiles in 2000, but since then it turned to an upward trend.
In 2017, households in the fifth income quintile spent an average of US$916.7 per month on food. Of total spending on food, 25.1% t (US$233.3) was allocated for processed food. For households in the first income quintile, the average monthly expenditure on food was US$300.0, and processed food accounted for 30.7% (US$92.5) of total food expenditure.
Households in the first income quintile spent more money on processed cereals, seasoning food, processed fish, sugar and confectionery, while spending on processed cereals, sugar, confectionery, milk products, and other foods were high in households in the fifth income quintile.
Items with the highest rate of spending growth from 2010 to 2017 were seasoning food for the first income households and other foods for the fifth income households.
Note: 1,200 Korean Won = US$1 as of August 26, 2019
Source: Statistics Korea, household income and expenditure survey. 2010-2017.
For the householders in the 20s age range, spending on milk products, processed fish, and seasoning food decreased in 2017, compared to 2010. On the other hand, spending on other foods, sugars and confectionery, alcoholic beverages, juice, and other non-alcoholic beverage increased, which was a remarkable characteristic of them. In 2017, the highest item of their spending on processed food was processed cereals, followed by sugars and confectionery, and other foods.
In the case of householders in the 60s and older age range, spending on all the items increased in 2017, compared to 2010. Among the items, spending on processed cereals, processed fish, seasoning food, sugars and confectionery, and other foods significantly increased.
In the case of single-person households, spending on processed cereals was the largest part of spending on processed food, amounting to US$16.7 per month, followed by sugars and confectionery (US$10.1), alcoholic beverages (US$9.2), and other foods (US$9.2). The highest ranked category of multi-person households was processed cereals (US$22.1), followed by sugars and confectionery (US$14.8), processed fish (US$12.1), and milk products (US$11.7).
Both single- and multi-person households showed the largest increase in spending on processed cereals and other foods in 2017, compared to 2010. Single-person households tended to spend more on milk products, juice and other non-alcoholic beverage, and alcoholic beverage compared with multi-person households. On the other hand, multi-person households tended to spend more on processed meat, processed fish, processed fruits, processed vegetables, and seasoning food compared with single-person households.
Proportion of total spending on processed food was examined by several demographic factors, including income, age, and the number of household members. In comparison by each factor, two groups were compared (households in the first quintile of income and households in the fifth quintile of income; householders in the 20s age range and householders in the 60s and older age range; single-person households and multi-person households).
In the fifth income households, the item with the largest share of spending on processed food was “breads”(8.8%), followed by “Korean sweets and confectionery”(7.2%), “milk” (5.2%), “beer” (4.1%) and “instant and freeze food” (4.0%). The rates of increase of instant and freeze foods (19.9%), baby foods (17.4%), and candy and jelly (14.7%) were high for this group.
In the case of the first income households, dried red pepper, sesame and perilla, soju, and bottled water accounted for high shares. For the fifth income households, fruit and vegetable juices, cakes, and processed fruits were included in the top 20 items of household spending on processed food by income quintile, which was a relative difference from the first income households.
For householders in the 20s age range, the item with the largest share of spending on processed food was “Korean sweets and other confectionery”(9.1%), followed by “breads”(8,9%), “instant and freeze food”(8.2%), “beer”(7.4%), “other beverages”(6.5%), and the items with the high rates of increase were “instant and freeze foods”(28.6%), “bottled water”(13.7%), “butter, other oils and fats”(11.2%). Householders in the 60s and older age range showed large shares of “dried pepper”(7.8%), “milk”(5,1%), “breads”(5.0%), “Korean sweets and other confectionery”(4.8%), and “rice cake”(3.4%). Also, the items with high rates of increase were “other processed milk”(24.5%), “baby foods”(23.9%), and “instant and frozen food”(23.3%).
For householders in the 20s age range, instant and freeze foods, beer, other beverages, ice cream, cakes, bottled water, fruits and vegetable juices, ham and bacon, milk powder, and chocolate were ranked relatively high. For householders in the 60s and older age range, dried red peppers, rice cakes, salted fish, tofu, sesame and perilla were ranked high.
For single-person households, breads made up the largest proportion of spending on processed foods, accounting for 6.6%, followed closely by Korean sweets and other confectionery (6.5%), beer (6.1%), instant and freeze foods (5.2%), and milk (4.7%), The fastest growth was in instant and freeze foods, growing by 34.6%, followed by butter and other oils and fats (27.3%) and other milk products(26.6%). For multi-person households, breads had the largest proportion of spending on processed food, accounting for 7.4%, followed by Korean and other confectioneries (7.1%) and milk (5.2%). The fastest growing item was baby foods (20.5%), followed by instant and freeze foods (19.7%) and processed fruits (17.8%).
In the case of single-person households, bottled water and kimchi were included in the ranking, while processed fruits and tofu were included in the ranking for multi-person households. Sausages, breads, crab meat, and ice cream were included in the fast growing items of single-person households, while baby foods, side dishes, salted fish, fruit liquor, sesame and perilla, and dried corvinas were included in the fast growing items of multi-person households.
PROJECTED PROPORTION OF FOOD EXPENDITURE OF HOUSEHOLDS
We used household food expenditure raw data that were collected from the first quarter of 1990 to 2017 to estimate proportions of food expenditure in 2018-2020; Quarterly data were collected until 2016 and annual data collected in 2017 were quartered using interpolation method with an average of increase rate. In the time-series econometric model used for this prospect, variables about the change in food expenditure of households are time trend, seasonality (i.e. quarterly dummy variable), dummy variable regarding the point of change in the structure of food expenditure demonstrated by previous studies, the average age of householders, the average number of household members, and the average household income (or the total amount of consumer spending as a proxy variable).
We categorized food expenditure of households into fresh foods and processed foods and investigated each of them for future prospects. As a result, the proportion of fresh foods expenditure is expected to decrease slightly, while the proportion of processed foods expenditure is expected to increase gradually. The proportion of processed foods expenditure, which was 51.5% in 2017, is expected to increase to 53.4% in 2018, 53.8% in 2019, and 54.2% in 2020. On the other hand, the proportion of fresh foods expenditure, which was 48.5% in 2017, is expected to decrease to 45.8% in 2020. However, it is worth noting that increasing consumption of Home Meal Replacement (HMR) might affect not only the proportion of processed food and fresh food expenditure of households, but also expenditure in home meals and eat-outs.
Next, the processed foods expenditure of households was categorized into 12 items to project proportions of expenditure in each item. For processed grains, the proportion of expenditure, which was initially 19.3%, is likely to increase to 22.0% in 2020. On the other hand, that of processed meat is projected to decline from 6.7% to 5.6% in 2020. The items that are expected to decrease are processed meat, processed seafood, processed fats and oils, processed fruits, processed vegetables, and other foods. The items expected to increase are processed grains, processed dairy foods, sweets and snacks, coffee and tea, juice and beverages, and alcohol. Our findings have the following limitations: 1) Our findings are only applicable to households; 2) Our findings might have been affected by the quality of raw statistical data; and 3) It is possible that statistical results may slightly vary based upon types of projection models. Therefore, such limitations should be considered to interpret the results.
DISCUSSION AND POLICY IMPLICATIONS
In Korea, processed food expenditure has increased rapidly since 1990. As a result, household spending on processed food now accounts for a higher proportion than spending on fresh food. Various demographic factors, such as an increase in single-person households, an increase in income levels, and an aging population, are driving the expansion of consumption of processed foods, which is expected to intensify in the future. Accordingly, processed food consumption is also expected to increase at least in the near future. In addition to the information on the share of processed foods in the overall diet, the information on which processed food items are being consumed at the fastest rate, and the characteristics of processed food consumption by sociodemographic groups provide useful information about the food industry’s product development and market prospects. Furthermore, it is expected that the information presented in this article will provide food and health policy makers with valuable insights on the dietary life and nutritional status of the Korean population.
REFERENCES
Lee, K.Y., et al. 2017. Report of the Agency for Food Industry Information Analysis. Korea Rural Economic Institute. http://www.krei.re.kr/foodInfo/selectBbsNttList.do?bbsNo=434&key=749
Statistics Korea. Household Income and Expenditure Survey. 1990-2017.
Date submitted: July 30, 2019
Reviewed, edited and uploaded: September 2, 2019