ABSTRACT
High price fluctuation and lack of compensating purchasing power lead to a decrease in per capita consumption amount of those essential foods and meat and the lack of concentration on the nutrient requirement and food security. The objective of this research is to cope with the findings of meat cost and income and expenditure of selected households, and the per capita meat consumption based on a different levels of income groups in Nay Pyi Taw (n=400), Myanmar. Based on the total adult equivalent population (n=1,430), the per capita monthly meat consumption was 1.87 kg/month and the annual per capita meat consumption was 22.50 kg/year. The result means that poultry meat and pork meat are the most common goods based on the different levels of income groups in the study area. By comparison, the medium-income group consumed the highest amount of per capita poultry and pork meat while the low-income group consumed the highest amount of beef meat per month. The most common meat type in the total sample respondents was poultry meat (42%), and the second was pork meat (25%). The result indicated that the meat types with minimum consumption rates in three income groups were mutton (0.54 kg/month) and beef meat (0.32 kg/month). The reason was that the meat types with accessibility and reasonable price were consumed more commonly and highly preferable in all income groups. Therefore, increase in poultry and pork production is proposed to meet the local demand in enhancing household nutrition, food security and income generation. Further research and development for livestock could be introduced to improve farmer‑preferred breeds and context‑specific management of different production practices.
Keywords: diversification of common meat types, per capita meat consumption, income groups
INTRODUCTION
Everyone needs food consumption for living standards. In food consumption, the equal balance for consumption of meat, fish, vegetables and other foods is vital for human health. Due to population growth, the main focus of meat consumption is to get proteins and fats for human health. People become more conscious about their protein intake in their daily diets. Globally, poultry meat is projected to increase 47% of the protein consumed from meat sources, followed by pig, sheep and bovine. During the COVID-19 pandemic, meat consumption behavior shifted from food service to home cooking depending on the expenditure of household. However, per capita consumption is high in high income countries based on the diversification of protein sources (OCED-FAO, 2022). According to the United Nations Food and Agricultural Organization (FAO), 2022, between 1990 and 2009, the report described that the aggregate global meat consumption increased by 60% and the per capita meat consumption by 25%. In 2022, global meat consumption is expected to continue increasing by 1.7 % per year. The total meat production in Myanmar was 3.15 million tons in 2017 and 3.53 million tons in 2018. Commercial meat production in Myanmar is focused on poultry (broilers and layers), pork and beef.
According to the FAO statistics, in 2018, per capita meat consumption in Myanmar accounted for 8.6 kg per year which is less than other ASEAN countries except India. Generally, locally produced meat is sufficient for local consumption. However, a small amount of frozen meat is imported for the consumption at high-end hotels and restaurants. Poultry meat production was found as one of the commercial meat productions in Myanmar and followed by pork, cattle and beef. Poultry meat is one of the common foods with high demand and supply over the world while Myanmar is growing around 15% per year (food and beverage in Myanmar, 2020). In 2020, total production of meat for Myanmar was 3.47 million tons, increased from 194,901 tons in 1971 at an average annual rate of 6.43%. Therefore, the study focus is to know the per capita meat consumption based on different types of meat per month and to compare the per capita meat consumption between different levels of income group in the study area.
Objectives
The specific objectives are as follows:
- To determine the monthly income and meat cost of selected households in Nay Pyi Taw
- To set per capita meat consumption based on different level of income groups in the study areas
Sampling method and selection of the study area
Zeyarthiri, Ottarathiri and Pobbathiri Townships in Nay Pyi Taw, Myanmar were selected as the preliminary study areas where a wide range of different types of households such as urban and rural households can be found. In addition, the availability of meat in Nay Pyi Taw could be bought in both wet markets and supermarkets at any time. Generally, meat prices in the study areas are normal and price fluctuations could be rarely seen.
Descriptive analysis was used to cluster different age and income level and to calculate the level of per capita meat consumption and preference of different meat types. The main interest of the study was to find out which income level is the most preferred among the meat types and per capita meat consumption based on the level of income groups.
To identify income level group, three income groups were included as low income group (between US$28 and US$141/month), medium income group (between US$142 and US$245/month) and high income group (between US$246 and US$2,030/month) for finding the different per capita meat consumption per month based on different meat types.
Adult equivalent
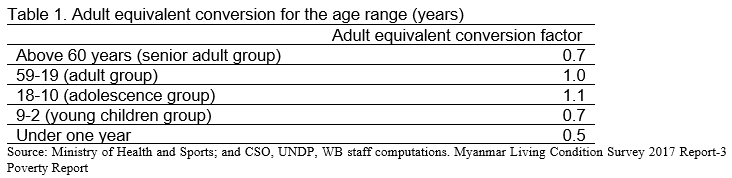
In this study, per capita meat consumption was calculated by the amount of household meat consumption per month divided by the total adult equivalent number of the household members. To classify the adult equivalent, four age groups were identified as senior adult group (≥60 years), adult group (between 59 and 19 years), adolescent group (between 18 and 10 years), young child group (between 9 years and 2 years) and under young group.
As presented in Table 1 for the adult equivalent conversion factors, the adult equivalent ratio 0.7 is assigned for the senior adults (60 years old and above 60), and 1.0 is assigned for people who are adult group (between 59 and 19 years old), 1.1 is assigned for people who belong to the adolescence group (between 18 and 10 years old), 0.7 is assigned for young children group who are between 9 and 2 years old, and 0.5 is assigned for a child who is under one year old.
Data collection and data analysis
In this research, the face-to-face interview method was conducted to collect the demographic character, monthly income, meat cost and different types of meat, and amount of consumption per month based on the preferences of meat types by using the structured questionnaire package. Purposive random sampling method was utilized in this study with the residents of three selected places from Zeyarthiri, Ottarathiri and Pobbathiri Townships in Nay Pyi Taw, Myanmar in November 2021. The collected data were digitally loaded to Microsoft Excel and with the help of STATA 15.
RESULTS AND DISCUSSION
Socio-demographic characteristics of respondents of selected households
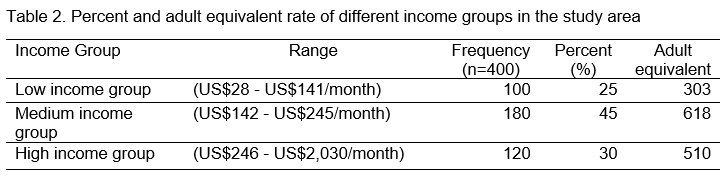
Of the total respondents (n=400), the majority of the respondents were female (94%) who were mainly responsible for preparing food and always cooking for household members in their daily life. In this study, there were three income group levels of the selected households to determine per capita meat consumption (kg/month) in the study area as described in Table 2. Around 25% of the respondents earned between US$28 and US$141/month as described as the low-income group (n=100) in the study area whereas 45 % of medium income group (n=180) earned the average monthly income of US$142 and US$245/month. In the high income group (n=120), 30% of the respondents earned US$246 < X ≤ US$2,030/month.
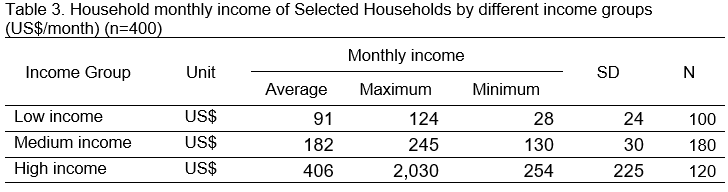
The households’ monthly income of the selected households (n=400) are shown in Table 3. The average income of the low-income group was US$91 per month with a maximum of US$124/per month and a minimum of US$28/per month. In the medium income group, the average income of the medium income group was US$182/month with a range of US$245 and US$130/month. In the high income group, the average income amount was US$406/month and the maximum income per month was US$2,030/month and the minimum income was US$254/month.
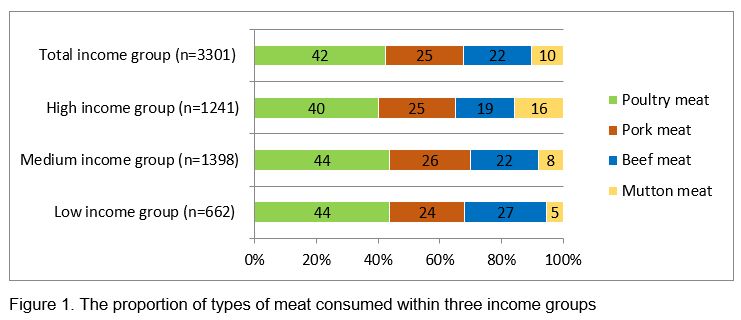
The information about the proportion of different meat consumption per income group of sample households in the study area is described in Figure 1. The consumed meat types of individual income groups also differed from each other. To start with, the proportion of preferable meat consumed types was poultry meat in the total income group (above 40%) followed by 25% of pork consumption, nearly 22% of beef consumption and 10% of mutton consumption. Based on the different income level groups, poultry meat was found the highest consumed proportion while pork was the second highest consumed amount of meat. In addition, beef was the highest proportion in the low-income group than the other two income groups because poultry and cow were reared at domestic home and considered as one of the livelihood activities in the rural sectors. Household members can access easily their food at low cost. The main reasons for having different consumed meat types among different income groups can be attributed to the access of family income, livelihood types and price of meat.
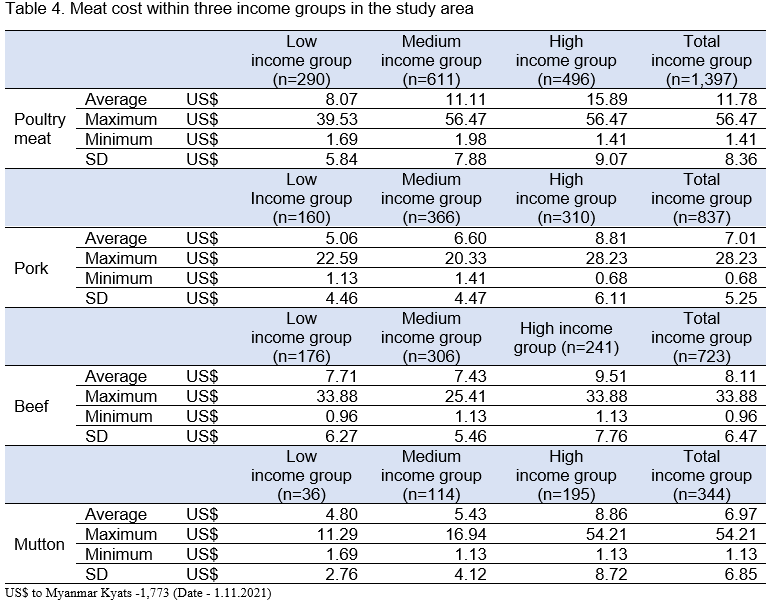
The average monthly expenditure of poultry meat among all meat types was found the lowest cost in the low-income group (US$8.07/month), followed by medium-income group (US$11.11/month) and high-income group (US$15.89/month). It is further revealed from the table that, on the average cost of meat in the study area, the high-income group expended the higher average costs for poultry meat, pork, beef and mutton as shown in Table 4. In pork consumption of the three income groups, the monthly average cost expended by the high-income group was US$8.81/month, US$6.60/month by the medium-income group and US$5.06/month by the low-income group. For beef consumption, the high-income group consumed the highest average cost (US$9.51/month), followed by the US$7.71/month and US$7.43/month of the low- and medium-income group, respectively. As for mutton consumption, the high-income group consumed US$8.86/month) while the low- and medium- income groups consumed US$4.8/month and US$ 5.43/month, respectively (Table 4).
Per capita meat consumption of different meat types per month within three income groups
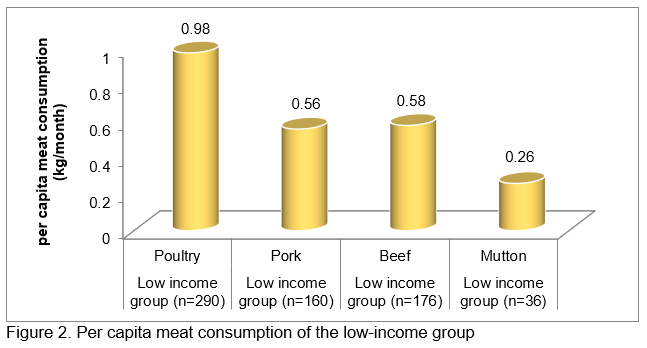
The total adult equivalent population was 1,430. The proportion of total poultry meat consumption of these households was 42% per month, 25% per month for pork, 22% per month for beef and 10% per month for mutton. Therefore, the per capita monthly meat consumption of total respondents (n=1,430) was 1.87 kg/month and the annual per capita meat consumption was 22.50 kg/year. The descriptions of per capita meat consumption per month by low-income group (n=309) are shown in Figure 2. In terms of the average monthly per capita consumption of different meat types, for the low-income group, poultry meat was the highest (0.98 kg per capita/month) among all meat types, followed by beef, pork and mutton with the rate of 0.58 kg, 0.56 kg and 0.26 kg per capita/month, respectively.
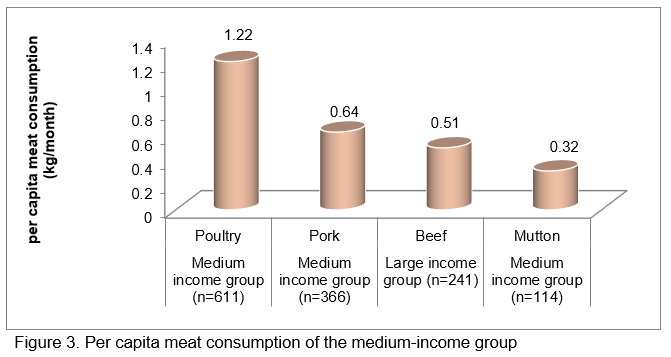
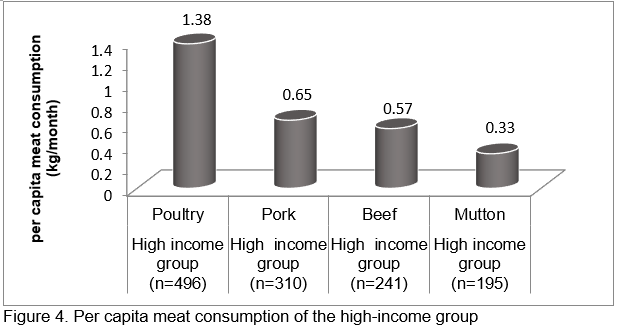
In Figure 3, the calculated monthly per capita consumption rate for poultry meat by the medium-income group (n=617) was also the highest amount (1.22 kg per month) compared to other meat types. The monthly per capita consumption rates of pork, beef and mutton by the medium-income group were 0.64 kg, 0.51 kg and 0.32 kg, respectively and were all lower than that of poultry meat. The per capita meat consumption per month by the high-income group (n=509) are described in Figure 4. The calculated per capita consumption rate for poultry meat by the high-income group was also the highest amount (1.38 kg per month) compared to other meat types. The monthly per capita consumption rates of pork, beef and mutton by the high-income group were 0.65 kg, 0.57 kg and 0.33 kg, respectively, and were all lower than that of poultry meat.
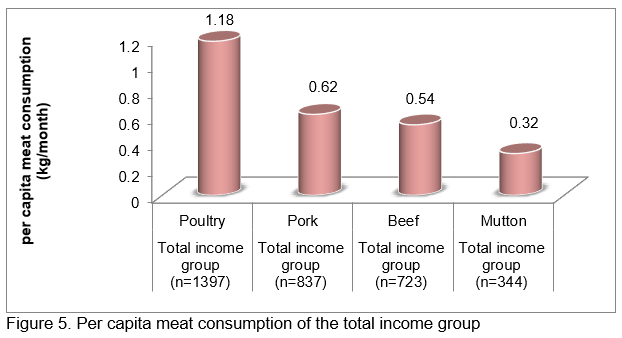
As demonstrated in Figure 5, the highest meat consumption rate per capita by the total income group was poultry meat (1.18 kg/month). Meanwhile, the per capita consumption of pork, beef and mutton by the total income group were 0.62 kg, 0.54 kg and 0.32 kg per month, respectively and were all lower than that of poultry meat. The minimum consumption rates of the meat types in three income groups were found in mutton and beef which had lower cost of meat per month compared to poultry meat. The higher consumption rates were expected to contribute to the fact that poultry meat was the highest meat cost per month among all meat types. By comparison, the highest amount of monthly per capita meat consumption for the medium-income group was poultry (1.22kg) and followed by pork meat (0.64kg). The amount of monthly per capita meat consumption of mutton was the lowest among all types of meat for all the income groups in the study area. As shown in Figure 5, in the high-income group, the most common meat consumption in the sample respondents was poultry meat and the second common meat type was pork which was also the same types of meat for the total income groups.
CONCLUSION AND RECOMMENDATION
This study investigates meat cost of selected households and the per capita meat consumption based on different level of income groups in Nay Pyi Taw. The findings suggest that poultry meat and pork meat are the most common meat consumed based on the different levels of income groups in the study area. The majority of the respondents were female (94%), and the low-income group accounted for 25%, medium-income group 45% and high-income group 30%. The average income of low-income group was US$91 per month while the medium-income group earned US$182/month. In the high-income group, the average income amount was US$406/month. The highest proportion of preferably consumed meat types in total sample respondents was poultry meat (42%), the second was pork meat (25%) followed by beef (22%) and mutton (10%), respectively. Those meat types with accessibility and reasonable price were found to be the more consumed and preferable meat types in all income groups.
Based on the total adult equivalent population (n=1,430), the per capita monthly meat consumption was 1.87 kg and the annual per capita meat consumption was 22.50 kg. In the low-income group, poultry meat was the highest consumption per month (0.98 kg per capita/month) among all meat types compared to pork (0.56 kg/month), beef (0.58 kg/month) and mutton (0.26 kg/month). In the medium-income group (n=617), poultry meat was also the highest amount (1.22 kg per month) among all meat types, followed by pork (0.64 kg), beef (0.51kg) and mutton (0.32 kg), respectively. The calculated per capita consumption rate for poultry meat by high income group was also the highest amount (1.22 kg per month). Pork, beef and mutton in this group found as 0.64 kg, 0.51 kg and 0.32 kg per month. The result indicated that the minimum consumption rates of meat types in three income group were found in mutton and beef meat. The higher consumption rates were expected to contribute to the fact that poultry meat was the highest meat cost per month in all of the income groups. By comparison, the medium-income group consumed the highest amount of poultry and pork meat per capita while the low-income group consumed the highest amount of beef meat per month. Therefore, in this study the most common meat type consumed by the sample respondents was poultry meat and the second common meat type was pork.
Therefore, poultry and pork production are proposed to be strengthened to meet the local demand in enhancing household’s nutrition, food security and income generation. With a growing demand for different livestock productions, there is a lot to do such as developing innovations that enhance the production and productivity; establishing a partnership and capacity building for effective input delivery and output marketing; and enhancing the overall performance of the value chain to maintain the quality of products. For further research, a farmer‑preferred improved breeds and context‑specific management practices that enhance the competitiveness and efficiency of different production practices needs to be introduced.
REFERENCES
Meat Consumption by Country, 2022. world population review website: Meat Consumption by Country, 2022, https://worldpopulationreview.com/ country- rankings/meat-consumption-by-country
Myanmar total production of meat, 2022. Knoema website: Myanmar total production of meat, https://knoema.com/atlas/Myanmar/topics/Agriculture/Live-Stock-Production-Production-Quantity/Total-production-of-meat
OECD-FAO, 2022. OECD library website: OECD-FAO Agricultural Outlook 2022-2031, https://www.oecd-ilibrary.org/sites/ab129327en/index.html?itemId=/content/component/ ab129327-en


How Meat Consumption Differs among Different Income Groups in Nay Pyi Taw, Myanmar
ABSTRACT
High price fluctuation and lack of compensating purchasing power lead to a decrease in per capita consumption amount of those essential foods and meat and the lack of concentration on the nutrient requirement and food security. The objective of this research is to cope with the findings of meat cost and income and expenditure of selected households, and the per capita meat consumption based on a different levels of income groups in Nay Pyi Taw (n=400), Myanmar. Based on the total adult equivalent population (n=1,430), the per capita monthly meat consumption was 1.87 kg/month and the annual per capita meat consumption was 22.50 kg/year. The result means that poultry meat and pork meat are the most common goods based on the different levels of income groups in the study area. By comparison, the medium-income group consumed the highest amount of per capita poultry and pork meat while the low-income group consumed the highest amount of beef meat per month. The most common meat type in the total sample respondents was poultry meat (42%), and the second was pork meat (25%). The result indicated that the meat types with minimum consumption rates in three income groups were mutton (0.54 kg/month) and beef meat (0.32 kg/month). The reason was that the meat types with accessibility and reasonable price were consumed more commonly and highly preferable in all income groups. Therefore, increase in poultry and pork production is proposed to meet the local demand in enhancing household nutrition, food security and income generation. Further research and development for livestock could be introduced to improve farmer‑preferred breeds and context‑specific management of different production practices.
Keywords: diversification of common meat types, per capita meat consumption, income groups
INTRODUCTION
Everyone needs food consumption for living standards. In food consumption, the equal balance for consumption of meat, fish, vegetables and other foods is vital for human health. Due to population growth, the main focus of meat consumption is to get proteins and fats for human health. People become more conscious about their protein intake in their daily diets. Globally, poultry meat is projected to increase 47% of the protein consumed from meat sources, followed by pig, sheep and bovine. During the COVID-19 pandemic, meat consumption behavior shifted from food service to home cooking depending on the expenditure of household. However, per capita consumption is high in high income countries based on the diversification of protein sources (OCED-FAO, 2022). According to the United Nations Food and Agricultural Organization (FAO), 2022, between 1990 and 2009, the report described that the aggregate global meat consumption increased by 60% and the per capita meat consumption by 25%. In 2022, global meat consumption is expected to continue increasing by 1.7 % per year. The total meat production in Myanmar was 3.15 million tons in 2017 and 3.53 million tons in 2018. Commercial meat production in Myanmar is focused on poultry (broilers and layers), pork and beef.
According to the FAO statistics, in 2018, per capita meat consumption in Myanmar accounted for 8.6 kg per year which is less than other ASEAN countries except India. Generally, locally produced meat is sufficient for local consumption. However, a small amount of frozen meat is imported for the consumption at high-end hotels and restaurants. Poultry meat production was found as one of the commercial meat productions in Myanmar and followed by pork, cattle and beef. Poultry meat is one of the common foods with high demand and supply over the world while Myanmar is growing around 15% per year (food and beverage in Myanmar, 2020). In 2020, total production of meat for Myanmar was 3.47 million tons, increased from 194,901 tons in 1971 at an average annual rate of 6.43%. Therefore, the study focus is to know the per capita meat consumption based on different types of meat per month and to compare the per capita meat consumption between different levels of income group in the study area.
Objectives
The specific objectives are as follows:
Sampling method and selection of the study area
Zeyarthiri, Ottarathiri and Pobbathiri Townships in Nay Pyi Taw, Myanmar were selected as the preliminary study areas where a wide range of different types of households such as urban and rural households can be found. In addition, the availability of meat in Nay Pyi Taw could be bought in both wet markets and supermarkets at any time. Generally, meat prices in the study areas are normal and price fluctuations could be rarely seen.
Descriptive analysis was used to cluster different age and income level and to calculate the level of per capita meat consumption and preference of different meat types. The main interest of the study was to find out which income level is the most preferred among the meat types and per capita meat consumption based on the level of income groups.
To identify income level group, three income groups were included as low income group (between US$28 and US$141/month), medium income group (between US$142 and US$245/month) and high income group (between US$246 and US$2,030/month) for finding the different per capita meat consumption per month based on different meat types.
Adult equivalent
In this study, per capita meat consumption was calculated by the amount of household meat consumption per month divided by the total adult equivalent number of the household members. To classify the adult equivalent, four age groups were identified as senior adult group (≥60 years), adult group (between 59 and 19 years), adolescent group (between 18 and 10 years), young child group (between 9 years and 2 years) and under young group.
As presented in Table 1 for the adult equivalent conversion factors, the adult equivalent ratio 0.7 is assigned for the senior adults (60 years old and above 60), and 1.0 is assigned for people who are adult group (between 59 and 19 years old), 1.1 is assigned for people who belong to the adolescence group (between 18 and 10 years old), 0.7 is assigned for young children group who are between 9 and 2 years old, and 0.5 is assigned for a child who is under one year old.
Data collection and data analysis
In this research, the face-to-face interview method was conducted to collect the demographic character, monthly income, meat cost and different types of meat, and amount of consumption per month based on the preferences of meat types by using the structured questionnaire package. Purposive random sampling method was utilized in this study with the residents of three selected places from Zeyarthiri, Ottarathiri and Pobbathiri Townships in Nay Pyi Taw, Myanmar in November 2021. The collected data were digitally loaded to Microsoft Excel and with the help of STATA 15.
RESULTS AND DISCUSSION
Socio-demographic characteristics of respondents of selected households
Of the total respondents (n=400), the majority of the respondents were female (94%) who were mainly responsible for preparing food and always cooking for household members in their daily life. In this study, there were three income group levels of the selected households to determine per capita meat consumption (kg/month) in the study area as described in Table 2. Around 25% of the respondents earned between US$28 and US$141/month as described as the low-income group (n=100) in the study area whereas 45 % of medium income group (n=180) earned the average monthly income of US$142 and US$245/month. In the high income group (n=120), 30% of the respondents earned US$246 < X ≤ US$2,030/month.
The households’ monthly income of the selected households (n=400) are shown in Table 3. The average income of the low-income group was US$91 per month with a maximum of US$124/per month and a minimum of US$28/per month. In the medium income group, the average income of the medium income group was US$182/month with a range of US$245 and US$130/month. In the high income group, the average income amount was US$406/month and the maximum income per month was US$2,030/month and the minimum income was US$254/month.
The information about the proportion of different meat consumption per income group of sample households in the study area is described in Figure 1. The consumed meat types of individual income groups also differed from each other. To start with, the proportion of preferable meat consumed types was poultry meat in the total income group (above 40%) followed by 25% of pork consumption, nearly 22% of beef consumption and 10% of mutton consumption. Based on the different income level groups, poultry meat was found the highest consumed proportion while pork was the second highest consumed amount of meat. In addition, beef was the highest proportion in the low-income group than the other two income groups because poultry and cow were reared at domestic home and considered as one of the livelihood activities in the rural sectors. Household members can access easily their food at low cost. The main reasons for having different consumed meat types among different income groups can be attributed to the access of family income, livelihood types and price of meat.
The average monthly expenditure of poultry meat among all meat types was found the lowest cost in the low-income group (US$8.07/month), followed by medium-income group (US$11.11/month) and high-income group (US$15.89/month). It is further revealed from the table that, on the average cost of meat in the study area, the high-income group expended the higher average costs for poultry meat, pork, beef and mutton as shown in Table 4. In pork consumption of the three income groups, the monthly average cost expended by the high-income group was US$8.81/month, US$6.60/month by the medium-income group and US$5.06/month by the low-income group. For beef consumption, the high-income group consumed the highest average cost (US$9.51/month), followed by the US$7.71/month and US$7.43/month of the low- and medium-income group, respectively. As for mutton consumption, the high-income group consumed US$8.86/month) while the low- and medium- income groups consumed US$4.8/month and US$ 5.43/month, respectively (Table 4).
Per capita meat consumption of different meat types per month within three income groups
The total adult equivalent population was 1,430. The proportion of total poultry meat consumption of these households was 42% per month, 25% per month for pork, 22% per month for beef and 10% per month for mutton. Therefore, the per capita monthly meat consumption of total respondents (n=1,430) was 1.87 kg/month and the annual per capita meat consumption was 22.50 kg/year. The descriptions of per capita meat consumption per month by low-income group (n=309) are shown in Figure 2. In terms of the average monthly per capita consumption of different meat types, for the low-income group, poultry meat was the highest (0.98 kg per capita/month) among all meat types, followed by beef, pork and mutton with the rate of 0.58 kg, 0.56 kg and 0.26 kg per capita/month, respectively.
In Figure 3, the calculated monthly per capita consumption rate for poultry meat by the medium-income group (n=617) was also the highest amount (1.22 kg per month) compared to other meat types. The monthly per capita consumption rates of pork, beef and mutton by the medium-income group were 0.64 kg, 0.51 kg and 0.32 kg, respectively and were all lower than that of poultry meat. The per capita meat consumption per month by the high-income group (n=509) are described in Figure 4. The calculated per capita consumption rate for poultry meat by the high-income group was also the highest amount (1.38 kg per month) compared to other meat types. The monthly per capita consumption rates of pork, beef and mutton by the high-income group were 0.65 kg, 0.57 kg and 0.33 kg, respectively, and were all lower than that of poultry meat.
As demonstrated in Figure 5, the highest meat consumption rate per capita by the total income group was poultry meat (1.18 kg/month). Meanwhile, the per capita consumption of pork, beef and mutton by the total income group were 0.62 kg, 0.54 kg and 0.32 kg per month, respectively and were all lower than that of poultry meat. The minimum consumption rates of the meat types in three income groups were found in mutton and beef which had lower cost of meat per month compared to poultry meat. The higher consumption rates were expected to contribute to the fact that poultry meat was the highest meat cost per month among all meat types. By comparison, the highest amount of monthly per capita meat consumption for the medium-income group was poultry (1.22kg) and followed by pork meat (0.64kg). The amount of monthly per capita meat consumption of mutton was the lowest among all types of meat for all the income groups in the study area. As shown in Figure 5, in the high-income group, the most common meat consumption in the sample respondents was poultry meat and the second common meat type was pork which was also the same types of meat for the total income groups.
CONCLUSION AND RECOMMENDATION
This study investigates meat cost of selected households and the per capita meat consumption based on different level of income groups in Nay Pyi Taw. The findings suggest that poultry meat and pork meat are the most common meat consumed based on the different levels of income groups in the study area. The majority of the respondents were female (94%), and the low-income group accounted for 25%, medium-income group 45% and high-income group 30%. The average income of low-income group was US$91 per month while the medium-income group earned US$182/month. In the high-income group, the average income amount was US$406/month. The highest proportion of preferably consumed meat types in total sample respondents was poultry meat (42%), the second was pork meat (25%) followed by beef (22%) and mutton (10%), respectively. Those meat types with accessibility and reasonable price were found to be the more consumed and preferable meat types in all income groups.
Based on the total adult equivalent population (n=1,430), the per capita monthly meat consumption was 1.87 kg and the annual per capita meat consumption was 22.50 kg. In the low-income group, poultry meat was the highest consumption per month (0.98 kg per capita/month) among all meat types compared to pork (0.56 kg/month), beef (0.58 kg/month) and mutton (0.26 kg/month). In the medium-income group (n=617), poultry meat was also the highest amount (1.22 kg per month) among all meat types, followed by pork (0.64 kg), beef (0.51kg) and mutton (0.32 kg), respectively. The calculated per capita consumption rate for poultry meat by high income group was also the highest amount (1.22 kg per month). Pork, beef and mutton in this group found as 0.64 kg, 0.51 kg and 0.32 kg per month. The result indicated that the minimum consumption rates of meat types in three income group were found in mutton and beef meat. The higher consumption rates were expected to contribute to the fact that poultry meat was the highest meat cost per month in all of the income groups. By comparison, the medium-income group consumed the highest amount of poultry and pork meat per capita while the low-income group consumed the highest amount of beef meat per month. Therefore, in this study the most common meat type consumed by the sample respondents was poultry meat and the second common meat type was pork.
Therefore, poultry and pork production are proposed to be strengthened to meet the local demand in enhancing household’s nutrition, food security and income generation. With a growing demand for different livestock productions, there is a lot to do such as developing innovations that enhance the production and productivity; establishing a partnership and capacity building for effective input delivery and output marketing; and enhancing the overall performance of the value chain to maintain the quality of products. For further research, a farmer‑preferred improved breeds and context‑specific management practices that enhance the competitiveness and efficiency of different production practices needs to be introduced.
REFERENCES
Meat Consumption by Country, 2022. world population review website: Meat Consumption by Country, 2022, https://worldpopulationreview.com/ country- rankings/meat-consumption-by-country
Myanmar total production of meat, 2022. Knoema website: Myanmar total production of meat, https://knoema.com/atlas/Myanmar/topics/Agriculture/Live-Stock-Production-Production-Quantity/Total-production-of-meat
OECD-FAO, 2022. OECD library website: OECD-FAO Agricultural Outlook 2022-2031, https://www.oecd-ilibrary.org/sites/ab129327en/index.html?itemId=/content/component/ ab129327-en