ABSTRACT
Korea’s agricultural sector has faced growing uncertainty from climate change, production-cost pressure, price volatility, market restructuring, and policy transition. Existing agricultural statistics are useful for structural analysis, but many are produced annually or irregularly and do not fully capture how farmers perceive current business conditions and near-term prospects. To address this information gap, the Korea Rural Economic Institute designed and implemented a pilot survey for a Farmers’ Economic Sentiment Index. The pilot separated farmers’ assessment of current conditions from their outlook for the next 12 months and covered farm management, rural life and vitality, climate and environmental conditions, and agricultural policy. The same questionnaire and index-calculation system were applied in the third and fourth quarters of 2025. The comprehensive index rose slightly from 89.12 in the third quarter to 90.45 in the fourth quarter but remained roughly 10 points below the neutral benchmark of 100. The current agricultural-conditions index improved from 73.98 to 83.33, while the 12-month outlook index rose from 71.75 to 79.84. Korean media coverage of the pilot emphasized the same core message: sentiment improved modestly, but cost, climate, and succession pressures continued to weigh on farmers’ expectations. This article argues that a farmer sentiment index can serve as an early-warning and policy-feedback instrument if it is continued regularly, linked with conventional economic statistics, and interpreted with attention to costs, climate risk, policy credibility, and intergenerational farm continuity.
Keywords: Farmers’ economic sentiment, agricultural outlook, pilot survey, rural economy, Korea, policy indicators
INTRODUCTION
Agricultural policy often depends on statistics that describe production, prices, income, costs, trade, land use, and household structure. These data are essential, but they usually arrive with a time lag and do not always show how farmers interpret the situation they face. A farm household may decide whether to continue production, invest in machinery, adjust acreage, hire workers, accept a successor, or postpone expenditure before annual statistics are available. For this reason, farmers’ expectations and perceived business conditions are valuable information for policymakers.
In Korea, this need has become more important as agricultural management conditions have become increasingly uncertain. Climate change has altered crop suitability and raised the volatility of yields and prices. Input costs have remained a major burden. Rural communities face aging, population decline, changing consumer demand, and greater exposure to policy and trade uncertainty. These changes affect farms not only through objective costs and revenues. They also shape farmers’ confidence, willingness to invest, and judgment about whether current conditions are manageable.
The manufacturing and service sectors often use business survey indices, such as business sentiment or business survey indicators, to track perceptions in a timely way. Agriculture has lacked a similarly regular and sector-specific sentiment indicator. Existing sources, including farm household economy surveys, agricultural censuses, and administrative data, are important but are not designed to capture farmers’ current assessment and near-term outlook at monthly or quarterly frequency. The Farmers’ Economic Sentiment Index was therefore designed as a pilot indicator to fill this gap.
The pilot survey was implemented not to declare a final representative index, but to build and assess a workable measurement framework. The key questions were practical: what should be asked, how should the answers be converted into an index, whether current assessment and outlook should be measured separately, and whether a regular survey could reveal changes in farmers’ sentiment with relatively little delay. This article summarizes the pilot survey and discusses how to improve the index and use it for policy.
The analytical premise is that sentiment should be treated as economic information, not as a soft supplement to hard statistics. In agriculture, expectations influence acreage decisions, machinery investment, input purchases, labor hiring, debt management, farm succession, and willingness to participate in policy programs. A well-designed sentiment index can therefore help detect stress before it appears in delayed income statistics or before farm households reduce investment in ways that damage long-term productivity.
WHY THE INDEX WAS NEEDED
The first reason for developing the index is the growing mismatch between the speed of agricultural change and the timing of conventional statistics. Prices and weather conditions can change quickly, and policy discussions can affect farmers’ expectations before measurable outcomes appear in official data. A quarterly or monthly sentiment indicator can provide an early signal of whether farmers believe that conditions are improving, deteriorating, or simply remaining difficult.
The second reason is that farmers’ expectations are linked to real management decisions. Sentiment does not merely describe mood. It can influence crop planning, investment, borrowing, farm succession, labor use, and the decision to continue or leave farming. When many farmers expect weak conditions, they may reduce investment, delay modernization, or become more cautious about production expansion. Regularly observing those expectations can help policymakers prepare support measures before the pressure becomes visible in more delayed indicators.
The third reason is that agricultural difficulties are multidimensional. A farmer may see output prices improving while production costs, climate risks, and rural labor shortages continue to weigh heavily. A single income statistic may not capture this mixed situation. The index was therefore built from multiple domains so that farm management, rural life, climate and environment, and policy perceptions can be considered together.
The fourth reason is that Korea needs a practical way to connect field perceptions to policy monitoring. Agricultural policy can be evaluated not only by final outcomes, but also by whether farmers understand policy direction, expect policies to help, and feel that trade, climate, or market risks are becoming more manageable. A sentiment survey cannot replace official statistics, but it can complement them by showing how farmers read the policy and market environment.
MEDIA AND POLICY CONTEXT
Korean media coverage of the first pilot results is useful because it shows how the wider policy community reads the index. News reports on the KREI release emphasized that the fourth-quarter comprehensive index improved only slightly to 90.45 and remained below the neutral benchmark of 100 (Dailian, 2026; Newsis, 2026). This framing is important. The index should not be interpreted as a recovery indicator simply because it rose. It should be interpreted as a measure of the balance between positive and negative perceptions, and in late 2025 that balance still leaned negative.
Nongmin News used an even sharper policy reading, noting that farmers’ perceived business conditions had become somewhat less negative while input-cost and climate burdens remained central (Nongmin News, 2026). eToday similarly highlighted that the current-condition and 12-month outlook indices improved but stayed well below 100, and that the successor question revealed a gap between current willingness to continue farming and longer-term continuity (eToday, 2026). These reports reinforce the index's value as a diagnostic tool: it can show whether improvement reflects genuine optimism or merely a reduction in pessimism.
The broader economic environment also supports the need for a farmer sentiment indicator. Korean reporting in 2025 and 2026 repeatedly linked farm-management pressure to production costs, abnormal weather, price volatility, and labor shortages. These factors are often visible to farmers before they are fully reflected in annual statistics. A quarterly sentiment survey can therefore help identify when farmers perceive cost pressure, climate damage, or policy uncertainty as binding constraints.
International experience also supports this approach. The Purdue University-CME Group Ag Economy Barometer shows that farmer sentiment can shift quickly when producers’ expectations of future conditions change (Mintert and Langemeier, 2024a, 2024b). Korea’s pilot is not identical to the US barometer, but it shares the same policy logic: asking producers directly about current conditions and expectations provides timely information that complements price, income, and production data.
PILOT SURVEY DESIGN
The pilot survey was conducted twice in 2025, once for the third quarter and once for the fourth quarter. The third-quarter survey was conducted in September 2025, and the fourth-quarter survey was conducted in November 2025. The target population was farmers engaged in grains, including rice and other food crops, fruits and vegetables, and livestock. The survey covered farmers nationwide and was implemented online through a professional survey platform.
The sample was drawn from KREI’s local correspondent network. After data cleaning based on birth year, farming experience, degree of involvement in farm management, and response quality, observations whose main commodity was classified as others were excluded from the analysis. As a result, 863 responses from the third-quarter raw data and 788 responses from the fourth-quarter raw data were used for the final pilot analysis.
To reduce structural bias from sample composition and improve index stability, the pilot used farm type and farm scale as stratification dimensions. Farm types were grains, fruits and vegetables, and livestock. Farm scale was classified by cultivated land area: large farms had at least 3 hectares, medium farms had at least 1 hectare but less than 3 hectares, and small farms had less than 1 hectare. Livestock farms without cultivated land were treated as small farms. The survey used a stratified square-root proportional sampling approach that considered both population distribution and variation, and post-stratification weights were calculated and applied by sample stratum.
Table 1. Pilot survey design and sample
|
Item
|
Description
|
|
Purpose
|
To observe farmers’ assessment of current agricultural conditions and their outlook for the next 12 months with less delay than conventional statistics.
|
|
Survey timing
|
Third quarter of 2025, surveyed in September; fourth quarter of 2025, surveyed in November.
|
|
Target farmers
|
Farmers engaged in grains, fruits and vegetables, and livestock, surveyed nationwide.
|
|
Final analytical sample
|
Third quarter: 863 responses; fourth quarter: 788 responses after data cleaning.
|
|
Sampling structure
|
Farm type by farm scale strata, using grains, fruits and vegetables, and livestock; scale classified as large, medium, and small by cultivated area.
|
|
Interpretation caution
|
The pilot uses KREI local correspondents, so interpret results as a policy-sensitive field signal rather than a final, nationally representative average.
|
The respondents were not a perfect representation of all Korean farm households. In both survey rounds, farmers aged 60 or older accounted for roughly three quarters of respondents, and the sample included a relatively high share of respondents with college-level education or higher. Because the survey used local correspondents, the results may reflect farmers who have relatively high policy awareness and access to information. This feature is not a weakness if interpreted correctly: the pilot is best read as an early, policy-sensitive field signal rather than a final measure of all farmers’ average sentiment.
INDEX COMPOSITION AND CALCULATION
The Farmers’ Economic Sentiment Index begins with individual survey questions and then aggregates them into domain-level and comprehensive indices. The questionnaire separates farmers’ assessment of current conditions from their outlook for the next 12 months. It asks respondents to compare current conditions with the same period in the previous year and to evaluate how conditions are expected to change over the coming 12 months.
Survey items cover several areas. The general items ask about overall agricultural conditions and rural living conditions. Farm-management items include production and crop conditions, consumption of agricultural and livestock products, sales prices, production costs, unit production costs, farm income, investment, development of agriculture and livestock, online distribution, exports, expected management difficulties, intention to continue farming, and existence of a successor. Rural life and vitality items cover farming activity time, non-farm wages, household consumption, rural health and medical conditions, rural tourism, young farmers, return migration to rural areas, and perceived risk of rural disappearance. Climate and environmental items cover pests, animal diseases, climate change impacts, and experience of natural disasters. Agricultural policy items cover perceptions of new policies, the direction of agricultural and rural policy, and concerns over the Korea-US tariff negotiations.
Table 2. Main domains of the Farmers’ Economic Sentiment Index
|
Domain
|
Main items
|
|
General conditions
|
Overall agricultural conditions and rural living conditions, measured for current assessment and 12-month outlook.
|
|
Farm management
|
Production, consumption, prices, costs, unit costs, income, investment, agricultural development, online distribution, exports, management difficulties, continuation, and successor status.
|
|
Rural life and vitality
|
Farming activity time, non-farm wages, household consumption, rural health care, tourism, young farmers, return migration, and risk of rural disappearance.
|
|
Climate and environment
|
Pests and animal diseases, climate-change impacts, and experience of climate-related natural disasters.
|
|
Agricultural policy
|
Expected effects of new policies, direction of agricultural and rural policy, and concerns over Korea-US tariff negotiations.
|
Each five-point response is converted linearly into an index score from 50 to 150, with 25-point intervals. A score of 100 is the neutral benchmark and means that the respondent perceives conditions as being at the same level as the previous year. A score above 100 means that positive responses dominate relative to the previous year, while a score below 100 means that negative responses dominate. The individual item index is calculated by applying sample weights to the transformed response scores. Domain indices are calculated as simple averages of item indices in the same domain. The comprehensive Farmers’ Economic Sentiment Index is then calculated as a simple average of domain indices.
Table 3. Index calculation and interpretation
|
Step
|
Method or interpretation
|
|
Response transformation
|
Five-point responses are transformed to a 50-150 scale at 25-point intervals.
|
|
Benchmark
|
100 means the same level as the previous year; above 100 means a positive assessment; below 100 means a negative assessment.
|
|
Item index
|
Transformed response scores are averaged using sample weights.
|
|
Domain index
|
All item indices in the same domain are averaged.
|
|
Comprehensive index
|
Domain indices are averaged to produce the comprehensive Farmers’ Economic Sentiment Index.
|
|
Use
|
The pilot is best interpreted by movement and direction, not by a single absolute level.
|
The index was intentionally designed to be interpreted by direction and movement rather than as an absolute measure. A value below 100 does not necessarily mean that all farm conditions are poor. It means that, relative to the previous year, negative assessments are more prevalent than positive assessments. Likewise, a rise from one quarter to the next may indicate that sentiment has become less negative, even if the index remains below 100. This interpretation is especially important for the pilot because only two quarters are available and seasonal factors may influence the results.
MAIN PILOT SURVEY RESULTS
The comprehensive Farmers’ Economic Sentiment Index rose from 89.12 in the third quarter of 2025 to 90.45 in the fourth quarter, an increase of 1.33 points. The improvement indicates that farmers’ view of the agricultural economy became somewhat less negative. However, the fourth-quarter score remained about 10 points below the neutral benchmark of 100, so the index did not show a shift into positive sentiment.
The current agricultural-conditions index improved more clearly, rising from 73.98 in the third quarter to 83.33 in the fourth quarter. This 9.35-point increase suggests that the share of farmers who felt current conditions had worsened compared with the previous year declined. Even so, the fourth-quarter score was still 16.67 points below 100. The appropriate interpretation is therefore not that farmers judged conditions to be good, but that some of the most negative pressure was eased.
The outlook for the next 12 months also improved but remained cautious. The outlook index rose from 71.75 in the third quarter to 79.84 in the fourth quarter, an increase of 8.09 points. Yet the fourth-quarter outlook was still 20.16 points below the neutral benchmark and lower than the current condition index. This suggests that farmers were more conservative about future conditions than about current conditions. The share of respondents expecting conditions to become very much better remained extremely small, at 0.49% in the third quarter and 1.25% in the fourth quarter.
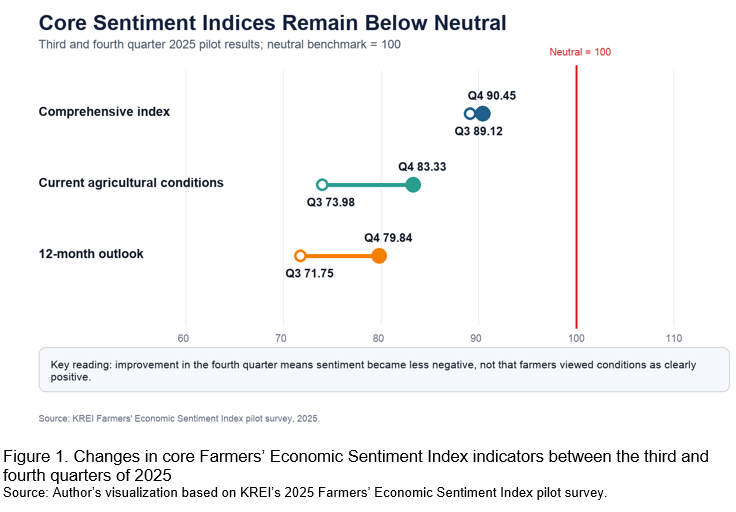
Table 4. Selected pilot survey results
|
Indicator
|
Third quarter 2025
|
Fourth quarter 2025
|
Interpretation
|
|
Comprehensive index
|
89.12
|
90.45
|
Slight improvement, but still below the neutral benchmark.
|
|
Current agricultural-conditions index
|
73.98
|
83.33
|
Negative assessment eased but remained 16.67 points below 100.
|
|
12-month agricultural-outlook index
|
71.75
|
79.84
|
Outlook improved but remained more conservative than the current assessment.
|
|
Very positive outlook response
|
0.49%
|
1.25%
|
Very few farmers expected conditions to improve much.
|
|
Pests and animal-disease index
|
80.13
|
80.33
|
Little change; continued negative perception.
|
|
Climate-impact index
|
71.73
|
72.73
|
Climate burden remained one of the weakest areas.
|
|
Climate-related disaster experience
|
About 72%
|
About 76%
|
A large majority reported damage during the previous 12 months.
|
|
Policy-direction index
|
94.43
|
95.32
|
Slight increase, but not a clearly positive evaluation of policy direction.
|
Farm-management perceptions show a mixed pattern. Sales prices and online distribution were relatively favorable and exceeded the neutral benchmark in the fourth quarter, but production costs and unit production costs remained well below 100 in both quarters. Income and investment improved somewhat, and investment moved slightly above the neutral line in the fourth quarter, but the change was too small to indicate a broad recovery. The perceived main difficulty in farm management shifted from a balance between low selling prices and high input costs in the third quarter to a stronger emphasis on input-cost pressure in the fourth quarter.
The fourth-quarter survey added questions on intention to continue farming and the existence of a successor. These results are important because they show the difference between continuing farming as a current livelihood and securing long-term farm continuity. More than 70% of respondents said that they wanted to continue farming for as long as possible or at least for the time being, while only 0.77% t wanted to quit as soon as possible. The index for willingness to continue farming was high at 127.31. By contrast, the successor index was 92.96, and the share of respondents with a definite successor was less than 10%. This gap suggests that farmers’ current willingness to remain in agriculture does not automatically translate into intergenerational continuity.
Rural life and vitality indicators also remained cautious. Non-farm wages stayed above 100 in both quarters and rose slightly in the fourth quarter, suggesting somewhat better conditions for off-farm income. The tourism index also rose in the fourth quarter but stayed close to the benchmark. However, household consumption expenditure remained around the 80 level, indicating continued pressure from living costs. Perceptions of young farmers and return migration were around the 90 level, and concern over rural disappearance remained high, with the index exceeding 110 in both quarters.
Climate and environmental perceptions showed little quarter-to-quarter change and remained negative. The pests and animal-disease index was 80.13 in the third quarter and 80.33 in the fourth quarter. The climate-impact index was lower, at 71.73 and 72.73, respectively. The share of respondents who reported damage from climate-related natural disasters during the previous 12 months was high in both quarters, about 72% in the third quarter and 76% in the fourth quarter. These findings suggest that farmers viewed climate and environmental burdens as continuing external risks rather than as conditions that could improve quickly.
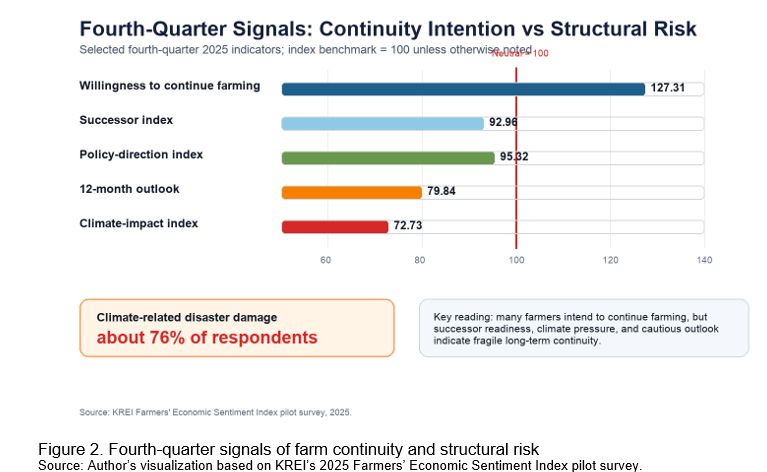
Policy perceptions were also mixed. Expectations for new agricultural policies, including the Grain Management Act, the agricultural price stabilization system, and rural basic income, remained positive in both quarters. However, concerns over the Korea-US tariff negotiations continued to weigh on perceptions of the policy environment, even though anxiety eased somewhat in the fourth quarter. The index for the direction of agricultural and rural policy rose only slightly, from 94.43 to 95.32, remaining around the neutral-to-negative area rather than showing a strongly positive evaluation.
INTERPRETATION
The pilot results indicate that farmers’ sentiment was improving at the margin, but the improvement should be interpreted carefully. A rise in the index does not mean that farmers believed agricultural conditions had clearly recovered. Rather, it means that the share of negative responses decreased and the share of mildly positive responses increased. The basic assessment remained below the neutral benchmark in most areas, especially for current and future agricultural conditions, production costs, living costs, climate impacts, and long-term rural vitality.
One important interpretation is that farmers may have been shifting from acute concern to a more adaptive view of difficult conditions. The fourth-quarter improvement partly reflects reduced negative responses, but not a strong expansion of optimistic responses. This distinction matters because policymakers should not treat the fourth-quarter increase as a sign that pressure has disappeared. It is better understood as a sign that farmers perceived some easing while still judging the environment as burdensome.
A second interpretation is that income-side indicators and cost-side indicators are moving differently. Prices, sales channels, income, and investment showed some improvement, while production costs, unit costs, climate impacts, pests, and living costs continued to constrain overall sentiment. Farmers may therefore feel that revenue opportunities exist but that the burdens they must absorb remain heavy. This gap can limit investment and weaken confidence even when some market indicators improve.
A third interpretation concerns farm continuity. The high willingness to continue farming shows that many farmers still plan to remain in agriculture, but the weak successor outlook points to long-term uncertainty. This distinction is crucial for rural policy. It means that the current farm base may continue operating in the short run, while the next-generation foundation remains fragile. Sentiment indicators should therefore include both current intention and future continuity.
A fourth interpretation is that climate and rural vitality risks are being internalized as persistent conditions. Farmers do not appear to regard climate, pests, natural disasters, population decline, and rural disappearance as short-term issues that will quickly normalize. If these risks are perceived as long-term burdens, they can influence farming decisions even when prices or policy expectations improve in a particular quarter.
From an economic-psychology perspective, the pilot's most important feature is the separation between objective conditions and perceived constraints. Farmers may respond to cost pressure, climate damage, or trade uncertainty not only when the objective shock occurs, but also when they expect the shock to persist. This expectation channel can affect behavior before official data confirm a decline in income or production. The index therefore has potential value as a leading or nowcasting indicator, provided that future data are accumulated and tested against farm-income, price, investment, and production outcomes.
The results also suggest that a sentiment index should not be used mechanically. A single below-100 reading is not a crisis diagnosis, and a small quarter-to-quarter increase is not a recovery diagnosis. Read the index alongside its subcomponents, commodity and regional context, and objective indicators. Its policy value lies in triangulation: it helps explain why farmers may hesitate to invest or expand production even when some market indicators look favorable.
WHY CONTINUED DATA ACCUMULATION MATTERS
The most important lesson from the pilot is that the index should be continued regularly so that a time series can be accumulated. Two quarters are enough to verify that the survey and calculation framework can operate, but they are not enough to identify stable trends, seasonal patterns, or turning points. A quarterly survey, and eventually a monthly survey if resources allow, would make it possible to observe whether sentiment improves during harvest periods, deteriorates during input-purchase periods, responds to policy announcements, or changes after weather shocks.
Continued data accumulation is also necessary for refining the questionnaire. Some items may be more sensitive to short-term changes, while others may move slowly. Climate impacts, rural disappearance, and farm succession may be structural indicators. Prices, costs, investment, policy expectations, and trade concerns may move more quickly. A longer data series would allow researchers to examine which items are useful as leading signals and which should be interpreted as background conditions.
Sampling and weighting also need further refinement. The pilot used KREI local correspondents and applied stratification and weights by farm type and scale. Future work should examine whether the sample should be broadened, how regional and commodity-specific representation should be improved, and whether separate indices should be produced for grains, fruits and vegetables, livestock, farm size, region, age group, or main income class. A single national index is useful for communication, but sub-indices may be more useful for policy diagnosis.
The method for calculating the representative index should also be reviewed. The pilot uses a clear and transparent approach: response scores are transformed to a 50-150 scale, weighted, averaged by domain, and then averaged into a comprehensive index. This simplicity is valuable, but alternative weighting methods may be considered as the data accumulate. For example, domain weights could be adjusted to reflect policy importance, economic contribution, or statistical reliability. Any change should preserve transparency so that users can understand what the index means.
Finally, regular publication can increase the index's value. If farmers, policy makers, researchers, cooperatives, and local governments learn to read the index over time, it can become a shared reference point for discussing agricultural conditions. The index should be accompanied by careful explanation, because a value below 100, a quarterly increase, or a domain-level difference can be misread if the benchmark and interpretation rules are not clear.
Validation should be built into future rounds. Once a longer time series is available, the index should be compared with agricultural income, input-price indices, farm-gate prices, machinery investment, disaster claims, farm-loan demand, and policy participation. If some domains lead objective outcomes by one or two quarters, they can be used as early-warning indicators. If other domains move slowly, they may be better treated as structural background indicators. This distinction will make the index more useful for both economists and policymakers.
Seasonality also requires careful treatment. Agricultural sentiment may naturally vary by cropping calendar, harvest timing, livestock cycles, input-purchase periods, and weather events. A quarterly series should therefore be published long enough to distinguish seasonal movement from genuine turning points. Over time, seasonal adjustment or year-on-year comparison may become necessary, especially if the index is used in policy briefings or budget discussions.
POLICY IMPLICATIONS
The first implication is that sentiment indicators can complement conventional agricultural statistics. Official statistics remain the foundation for policy analysis, but they often show outcomes after decisions have already been made. A sentiment index can provide early signals about management pressure, investment reluctance, policy expectations, and perceived risks. It is especially useful when the policy goal is to respond before problems become visible in income or production statistics.
The second implication is that policy diagnosis should separate current assessment from outlook. In the pilot, both current conditions and future outlook improved in the fourth quarter, but the outlook remained more conservative than the current assessment. This difference matters. A farmer may feel that current conditions are less bad than before while still expecting the next 12 months to remain difficult. Policy responses should consider both dimensions.
The third implication is that cost pressure should receive close attention. The pilot suggests that price and distribution conditions may improve without removing the burden of production costs and unit costs. If input-cost pressure remains high, improved sales prices may not translate into confidence, investment, or farm continuity. Policies related to input markets, energy, fertilizer, feed, machinery, finance, and risk management should therefore be read together with sentiment data.
The fourth implication is that economic-policy monitoring must integrate climate and environmental risk. Farmers’ economic sentiment is not shaped only by markets. It is also shaped by pests, animal diseases, extreme weather, and repeated disaster experience. Because a high share of respondents reported climate-related damage, climate adaptation should be treated as part of farm-economic stability, not as a separate environmental agenda.
The fifth implication is that farm succession needs a different policy lens from current farm continuation. The pilot shows strong willingness to continue farming but weak successor readiness. This means policies aimed at maintaining current production should not be conflated with policies aimed at sustaining the next generation. Farm succession, young farmer settlement, family farm transfer, and retirement pathways need to be monitored through separate indicators.
The sixth implication is that agricultural policy communication matters. Expectations for new policies were positive, but overall policy direction remained near neutral, and trade concerns persisted. Regular sentiment data can help identify whether policy messages are reaching farmers, whether farmers understand the expected effects, and where uncertainty remains. In this sense, the index can function as a feedback device for policy implementation.
The seventh implication for other Asian countries is that a farmer sentiment index can be a low-cost but useful addition to agricultural monitoring systems. Many countries face similar combinations of climate risk, aging farmers, cost pressure, and rural depopulation. A regular farmer survey, even if initially implemented as a pilot, can help governments understand how producers evaluate current conditions and what they expect in the near future.
The eighth implication is that the index should be communicated with professional discipline. Farmer sentiment is politically sensitive because it can be used to support claims about crisis, recovery, policy success, or policy failure. The responsible approach is to publish the benchmark, sample structure, question wording, domain composition, weighting method, and interpretation cautions together with the headline index. This transparency will reduce the risk that a single number is overinterpreted.
The ninth implication is that sentiment data can improve policy timing. If farmers’ outlook deteriorates before official income data decline, policymakers can review credit support, input-cost relief, disaster-prevention measures, market-stabilization tools, or communication on new policies earlier. Conversely, if sentiment improves while objective indicators remain weak, it may signal that policy expectations or local market conditions are improving before they appear in national statistics. Either way, the index can help make agricultural policy more anticipatory.
CONCLUSION
The Farmers’ Economic Sentiment Index was developed and implemented as a pilot to provide timely information on farmers’ assessment of current agricultural conditions and their outlook for the next 12 months. The pilot confirmed that farmers’ sentiment can be measured through a structured questionnaire, transformed into comparable index values, and interpreted across domains such as farm management, rural life and vitality, climate and environment, and agricultural policy.
The 2025 third- and fourth-quarter results show a slight improvement in overall sentiment, but not a shift to positive conditions. The comprehensive index remained below 100, current-condition and outlook indices remained clearly below the neutral benchmark, and cost, climate, living-cost, and rural-vitality concerns continued to weigh on perceptions. The results also reveal an important distinction between farmers’ willingness to continue current farming and uncertainty about securing successors.
The main value of the pilot is not the two-quarter result itself but establishing a measurement framework that can be repeated. Going forward, the survey should be continued regularly; the sample and weights should be refined; domain and sub-group indices should be reviewed; and the data should be accumulated into a time series. If developed carefully, the index can become a useful early-warning and policy-feedback tool for Korea and a practical reference for other Asian countries seeking to understand farmers’ perceptions in a rapidly changing agricultural environment.
REFERENCES
Dailian. 2026. "Farmers’ economic sentiment improves slightly in the fourth quarter but remains below the neutral benchmark." February 2026. https://www.dailian.co.kr/news/view/1610820/?sc=rss
eToday. 2026. "KREI releases pilot results for the Farmers’ Economic Sentiment Index." February 2026. https://www.etoday.co.kr/news/view/2556291?trc=right_categori_news_estudio
Joint Ministries of the Government of Korea. 2025. Measures to Improve the Agricultural Product Distribution Structure. Economic Ministers’ Meeting 25-6-2.
Kim, S., Lee, S., Lee, K., Ji, J., and Lim, J. 2026. Development of the Farmers’ Economic Sentiment Index and Pilot Survey Results. KREI Agricultural Policy Focus No. 234. Korea Rural Economic Institute.
Korea Rural Economic Institute. 2026. Development of the Farmers’ Economic Sentiment Index and Pilot Survey Results. KREI Repository. https://repository.krei.re.kr/handle/2018.oak/32640
Kwon, S. et al. 2018. A Study on Improving the Economic Sentiment Index. National Accounts Review 2018-4. Bank of Korea.
Mintert, J., and Langemeier, M. 2024a. Farmer Sentiment Drifts Lower on Weaker Future Expectations: May 2024. Purdue University-CME Group Ag Economy Barometer.
Mintert, J., and Langemeier, M. 2024b. Farmer Sentiment Drifts Lower on Weaker Future Expectations: June 2024. Purdue University-CME Group Ag Economy Barometer.
Newsis. 2026. "KREI develops Farmers’ Economic Sentiment Index and releases pilot survey results." February 11, 2026. https://mobile.newsis.com/view/NISX20260211_0003511488
Nongmin News. 2026. "Even as earnings improve, burdens remain: farmers’ perceived business conditions continue to be weak." Daum News, February 15, 2026. https://v.daum.net/v/0SXTyeKpNz
Statistics Research Institute. 2024. Living Environment, Climate Change, and Changes in Crop Production. Korean Social Trends 2024: 267-280.

Development and Pilot Survey Results of Korea’s Farmers’ Economic Sentiment Index
ABSTRACT
Korea’s agricultural sector has faced growing uncertainty from climate change, production-cost pressure, price volatility, market restructuring, and policy transition. Existing agricultural statistics are useful for structural analysis, but many are produced annually or irregularly and do not fully capture how farmers perceive current business conditions and near-term prospects. To address this information gap, the Korea Rural Economic Institute designed and implemented a pilot survey for a Farmers’ Economic Sentiment Index. The pilot separated farmers’ assessment of current conditions from their outlook for the next 12 months and covered farm management, rural life and vitality, climate and environmental conditions, and agricultural policy. The same questionnaire and index-calculation system were applied in the third and fourth quarters of 2025. The comprehensive index rose slightly from 89.12 in the third quarter to 90.45 in the fourth quarter but remained roughly 10 points below the neutral benchmark of 100. The current agricultural-conditions index improved from 73.98 to 83.33, while the 12-month outlook index rose from 71.75 to 79.84. Korean media coverage of the pilot emphasized the same core message: sentiment improved modestly, but cost, climate, and succession pressures continued to weigh on farmers’ expectations. This article argues that a farmer sentiment index can serve as an early-warning and policy-feedback instrument if it is continued regularly, linked with conventional economic statistics, and interpreted with attention to costs, climate risk, policy credibility, and intergenerational farm continuity.
Keywords: Farmers’ economic sentiment, agricultural outlook, pilot survey, rural economy, Korea, policy indicators
INTRODUCTION
Agricultural policy often depends on statistics that describe production, prices, income, costs, trade, land use, and household structure. These data are essential, but they usually arrive with a time lag and do not always show how farmers interpret the situation they face. A farm household may decide whether to continue production, invest in machinery, adjust acreage, hire workers, accept a successor, or postpone expenditure before annual statistics are available. For this reason, farmers’ expectations and perceived business conditions are valuable information for policymakers.
In Korea, this need has become more important as agricultural management conditions have become increasingly uncertain. Climate change has altered crop suitability and raised the volatility of yields and prices. Input costs have remained a major burden. Rural communities face aging, population decline, changing consumer demand, and greater exposure to policy and trade uncertainty. These changes affect farms not only through objective costs and revenues. They also shape farmers’ confidence, willingness to invest, and judgment about whether current conditions are manageable.
The manufacturing and service sectors often use business survey indices, such as business sentiment or business survey indicators, to track perceptions in a timely way. Agriculture has lacked a similarly regular and sector-specific sentiment indicator. Existing sources, including farm household economy surveys, agricultural censuses, and administrative data, are important but are not designed to capture farmers’ current assessment and near-term outlook at monthly or quarterly frequency. The Farmers’ Economic Sentiment Index was therefore designed as a pilot indicator to fill this gap.
The pilot survey was implemented not to declare a final representative index, but to build and assess a workable measurement framework. The key questions were practical: what should be asked, how should the answers be converted into an index, whether current assessment and outlook should be measured separately, and whether a regular survey could reveal changes in farmers’ sentiment with relatively little delay. This article summarizes the pilot survey and discusses how to improve the index and use it for policy.
The analytical premise is that sentiment should be treated as economic information, not as a soft supplement to hard statistics. In agriculture, expectations influence acreage decisions, machinery investment, input purchases, labor hiring, debt management, farm succession, and willingness to participate in policy programs. A well-designed sentiment index can therefore help detect stress before it appears in delayed income statistics or before farm households reduce investment in ways that damage long-term productivity.
WHY THE INDEX WAS NEEDED
The first reason for developing the index is the growing mismatch between the speed of agricultural change and the timing of conventional statistics. Prices and weather conditions can change quickly, and policy discussions can affect farmers’ expectations before measurable outcomes appear in official data. A quarterly or monthly sentiment indicator can provide an early signal of whether farmers believe that conditions are improving, deteriorating, or simply remaining difficult.
The second reason is that farmers’ expectations are linked to real management decisions. Sentiment does not merely describe mood. It can influence crop planning, investment, borrowing, farm succession, labor use, and the decision to continue or leave farming. When many farmers expect weak conditions, they may reduce investment, delay modernization, or become more cautious about production expansion. Regularly observing those expectations can help policymakers prepare support measures before the pressure becomes visible in more delayed indicators.
The third reason is that agricultural difficulties are multidimensional. A farmer may see output prices improving while production costs, climate risks, and rural labor shortages continue to weigh heavily. A single income statistic may not capture this mixed situation. The index was therefore built from multiple domains so that farm management, rural life, climate and environment, and policy perceptions can be considered together.
The fourth reason is that Korea needs a practical way to connect field perceptions to policy monitoring. Agricultural policy can be evaluated not only by final outcomes, but also by whether farmers understand policy direction, expect policies to help, and feel that trade, climate, or market risks are becoming more manageable. A sentiment survey cannot replace official statistics, but it can complement them by showing how farmers read the policy and market environment.
MEDIA AND POLICY CONTEXT
Korean media coverage of the first pilot results is useful because it shows how the wider policy community reads the index. News reports on the KREI release emphasized that the fourth-quarter comprehensive index improved only slightly to 90.45 and remained below the neutral benchmark of 100 (Dailian, 2026; Newsis, 2026). This framing is important. The index should not be interpreted as a recovery indicator simply because it rose. It should be interpreted as a measure of the balance between positive and negative perceptions, and in late 2025 that balance still leaned negative.
Nongmin News used an even sharper policy reading, noting that farmers’ perceived business conditions had become somewhat less negative while input-cost and climate burdens remained central (Nongmin News, 2026). eToday similarly highlighted that the current-condition and 12-month outlook indices improved but stayed well below 100, and that the successor question revealed a gap between current willingness to continue farming and longer-term continuity (eToday, 2026). These reports reinforce the index's value as a diagnostic tool: it can show whether improvement reflects genuine optimism or merely a reduction in pessimism.
The broader economic environment also supports the need for a farmer sentiment indicator. Korean reporting in 2025 and 2026 repeatedly linked farm-management pressure to production costs, abnormal weather, price volatility, and labor shortages. These factors are often visible to farmers before they are fully reflected in annual statistics. A quarterly sentiment survey can therefore help identify when farmers perceive cost pressure, climate damage, or policy uncertainty as binding constraints.
International experience also supports this approach. The Purdue University-CME Group Ag Economy Barometer shows that farmer sentiment can shift quickly when producers’ expectations of future conditions change (Mintert and Langemeier, 2024a, 2024b). Korea’s pilot is not identical to the US barometer, but it shares the same policy logic: asking producers directly about current conditions and expectations provides timely information that complements price, income, and production data.
PILOT SURVEY DESIGN
The pilot survey was conducted twice in 2025, once for the third quarter and once for the fourth quarter. The third-quarter survey was conducted in September 2025, and the fourth-quarter survey was conducted in November 2025. The target population was farmers engaged in grains, including rice and other food crops, fruits and vegetables, and livestock. The survey covered farmers nationwide and was implemented online through a professional survey platform.
The sample was drawn from KREI’s local correspondent network. After data cleaning based on birth year, farming experience, degree of involvement in farm management, and response quality, observations whose main commodity was classified as others were excluded from the analysis. As a result, 863 responses from the third-quarter raw data and 788 responses from the fourth-quarter raw data were used for the final pilot analysis.
To reduce structural bias from sample composition and improve index stability, the pilot used farm type and farm scale as stratification dimensions. Farm types were grains, fruits and vegetables, and livestock. Farm scale was classified by cultivated land area: large farms had at least 3 hectares, medium farms had at least 1 hectare but less than 3 hectares, and small farms had less than 1 hectare. Livestock farms without cultivated land were treated as small farms. The survey used a stratified square-root proportional sampling approach that considered both population distribution and variation, and post-stratification weights were calculated and applied by sample stratum.
Table 1. Pilot survey design and sample
Item
Description
Purpose
To observe farmers’ assessment of current agricultural conditions and their outlook for the next 12 months with less delay than conventional statistics.
Survey timing
Third quarter of 2025, surveyed in September; fourth quarter of 2025, surveyed in November.
Target farmers
Farmers engaged in grains, fruits and vegetables, and livestock, surveyed nationwide.
Final analytical sample
Third quarter: 863 responses; fourth quarter: 788 responses after data cleaning.
Sampling structure
Farm type by farm scale strata, using grains, fruits and vegetables, and livestock; scale classified as large, medium, and small by cultivated area.
Interpretation caution
The pilot uses KREI local correspondents, so interpret results as a policy-sensitive field signal rather than a final, nationally representative average.
The respondents were not a perfect representation of all Korean farm households. In both survey rounds, farmers aged 60 or older accounted for roughly three quarters of respondents, and the sample included a relatively high share of respondents with college-level education or higher. Because the survey used local correspondents, the results may reflect farmers who have relatively high policy awareness and access to information. This feature is not a weakness if interpreted correctly: the pilot is best read as an early, policy-sensitive field signal rather than a final measure of all farmers’ average sentiment.
INDEX COMPOSITION AND CALCULATION
The Farmers’ Economic Sentiment Index begins with individual survey questions and then aggregates them into domain-level and comprehensive indices. The questionnaire separates farmers’ assessment of current conditions from their outlook for the next 12 months. It asks respondents to compare current conditions with the same period in the previous year and to evaluate how conditions are expected to change over the coming 12 months.
Survey items cover several areas. The general items ask about overall agricultural conditions and rural living conditions. Farm-management items include production and crop conditions, consumption of agricultural and livestock products, sales prices, production costs, unit production costs, farm income, investment, development of agriculture and livestock, online distribution, exports, expected management difficulties, intention to continue farming, and existence of a successor. Rural life and vitality items cover farming activity time, non-farm wages, household consumption, rural health and medical conditions, rural tourism, young farmers, return migration to rural areas, and perceived risk of rural disappearance. Climate and environmental items cover pests, animal diseases, climate change impacts, and experience of natural disasters. Agricultural policy items cover perceptions of new policies, the direction of agricultural and rural policy, and concerns over the Korea-US tariff negotiations.
Table 2. Main domains of the Farmers’ Economic Sentiment Index
Domain
Main items
General conditions
Overall agricultural conditions and rural living conditions, measured for current assessment and 12-month outlook.
Farm management
Production, consumption, prices, costs, unit costs, income, investment, agricultural development, online distribution, exports, management difficulties, continuation, and successor status.
Rural life and vitality
Farming activity time, non-farm wages, household consumption, rural health care, tourism, young farmers, return migration, and risk of rural disappearance.
Climate and environment
Pests and animal diseases, climate-change impacts, and experience of climate-related natural disasters.
Agricultural policy
Expected effects of new policies, direction of agricultural and rural policy, and concerns over Korea-US tariff negotiations.
Each five-point response is converted linearly into an index score from 50 to 150, with 25-point intervals. A score of 100 is the neutral benchmark and means that the respondent perceives conditions as being at the same level as the previous year. A score above 100 means that positive responses dominate relative to the previous year, while a score below 100 means that negative responses dominate. The individual item index is calculated by applying sample weights to the transformed response scores. Domain indices are calculated as simple averages of item indices in the same domain. The comprehensive Farmers’ Economic Sentiment Index is then calculated as a simple average of domain indices.
Table 3. Index calculation and interpretation
Step
Method or interpretation
Response transformation
Five-point responses are transformed to a 50-150 scale at 25-point intervals.
Benchmark
100 means the same level as the previous year; above 100 means a positive assessment; below 100 means a negative assessment.
Item index
Transformed response scores are averaged using sample weights.
Domain index
All item indices in the same domain are averaged.
Comprehensive index
Domain indices are averaged to produce the comprehensive Farmers’ Economic Sentiment Index.
Use
The pilot is best interpreted by movement and direction, not by a single absolute level.
The index was intentionally designed to be interpreted by direction and movement rather than as an absolute measure. A value below 100 does not necessarily mean that all farm conditions are poor. It means that, relative to the previous year, negative assessments are more prevalent than positive assessments. Likewise, a rise from one quarter to the next may indicate that sentiment has become less negative, even if the index remains below 100. This interpretation is especially important for the pilot because only two quarters are available and seasonal factors may influence the results.
MAIN PILOT SURVEY RESULTS
The comprehensive Farmers’ Economic Sentiment Index rose from 89.12 in the third quarter of 2025 to 90.45 in the fourth quarter, an increase of 1.33 points. The improvement indicates that farmers’ view of the agricultural economy became somewhat less negative. However, the fourth-quarter score remained about 10 points below the neutral benchmark of 100, so the index did not show a shift into positive sentiment.
The current agricultural-conditions index improved more clearly, rising from 73.98 in the third quarter to 83.33 in the fourth quarter. This 9.35-point increase suggests that the share of farmers who felt current conditions had worsened compared with the previous year declined. Even so, the fourth-quarter score was still 16.67 points below 100. The appropriate interpretation is therefore not that farmers judged conditions to be good, but that some of the most negative pressure was eased.
The outlook for the next 12 months also improved but remained cautious. The outlook index rose from 71.75 in the third quarter to 79.84 in the fourth quarter, an increase of 8.09 points. Yet the fourth-quarter outlook was still 20.16 points below the neutral benchmark and lower than the current condition index. This suggests that farmers were more conservative about future conditions than about current conditions. The share of respondents expecting conditions to become very much better remained extremely small, at 0.49% in the third quarter and 1.25% in the fourth quarter.
Table 4. Selected pilot survey results
Indicator
Third quarter 2025
Fourth quarter 2025
Interpretation
Comprehensive index
89.12
90.45
Slight improvement, but still below the neutral benchmark.
Current agricultural-conditions index
73.98
83.33
Negative assessment eased but remained 16.67 points below 100.
12-month agricultural-outlook index
71.75
79.84
Outlook improved but remained more conservative than the current assessment.
Very positive outlook response
0.49%
1.25%
Very few farmers expected conditions to improve much.
Pests and animal-disease index
80.13
80.33
Little change; continued negative perception.
Climate-impact index
71.73
72.73
Climate burden remained one of the weakest areas.
Climate-related disaster experience
About 72%
About 76%
A large majority reported damage during the previous 12 months.
Policy-direction index
94.43
95.32
Slight increase, but not a clearly positive evaluation of policy direction.
Farm-management perceptions show a mixed pattern. Sales prices and online distribution were relatively favorable and exceeded the neutral benchmark in the fourth quarter, but production costs and unit production costs remained well below 100 in both quarters. Income and investment improved somewhat, and investment moved slightly above the neutral line in the fourth quarter, but the change was too small to indicate a broad recovery. The perceived main difficulty in farm management shifted from a balance between low selling prices and high input costs in the third quarter to a stronger emphasis on input-cost pressure in the fourth quarter.
The fourth-quarter survey added questions on intention to continue farming and the existence of a successor. These results are important because they show the difference between continuing farming as a current livelihood and securing long-term farm continuity. More than 70% of respondents said that they wanted to continue farming for as long as possible or at least for the time being, while only 0.77% t wanted to quit as soon as possible. The index for willingness to continue farming was high at 127.31. By contrast, the successor index was 92.96, and the share of respondents with a definite successor was less than 10%. This gap suggests that farmers’ current willingness to remain in agriculture does not automatically translate into intergenerational continuity.
Rural life and vitality indicators also remained cautious. Non-farm wages stayed above 100 in both quarters and rose slightly in the fourth quarter, suggesting somewhat better conditions for off-farm income. The tourism index also rose in the fourth quarter but stayed close to the benchmark. However, household consumption expenditure remained around the 80 level, indicating continued pressure from living costs. Perceptions of young farmers and return migration were around the 90 level, and concern over rural disappearance remained high, with the index exceeding 110 in both quarters.
Climate and environmental perceptions showed little quarter-to-quarter change and remained negative. The pests and animal-disease index was 80.13 in the third quarter and 80.33 in the fourth quarter. The climate-impact index was lower, at 71.73 and 72.73, respectively. The share of respondents who reported damage from climate-related natural disasters during the previous 12 months was high in both quarters, about 72% in the third quarter and 76% in the fourth quarter. These findings suggest that farmers viewed climate and environmental burdens as continuing external risks rather than as conditions that could improve quickly.
Policy perceptions were also mixed. Expectations for new agricultural policies, including the Grain Management Act, the agricultural price stabilization system, and rural basic income, remained positive in both quarters. However, concerns over the Korea-US tariff negotiations continued to weigh on perceptions of the policy environment, even though anxiety eased somewhat in the fourth quarter. The index for the direction of agricultural and rural policy rose only slightly, from 94.43 to 95.32, remaining around the neutral-to-negative area rather than showing a strongly positive evaluation.
INTERPRETATION
The pilot results indicate that farmers’ sentiment was improving at the margin, but the improvement should be interpreted carefully. A rise in the index does not mean that farmers believed agricultural conditions had clearly recovered. Rather, it means that the share of negative responses decreased and the share of mildly positive responses increased. The basic assessment remained below the neutral benchmark in most areas, especially for current and future agricultural conditions, production costs, living costs, climate impacts, and long-term rural vitality.
One important interpretation is that farmers may have been shifting from acute concern to a more adaptive view of difficult conditions. The fourth-quarter improvement partly reflects reduced negative responses, but not a strong expansion of optimistic responses. This distinction matters because policymakers should not treat the fourth-quarter increase as a sign that pressure has disappeared. It is better understood as a sign that farmers perceived some easing while still judging the environment as burdensome.
A second interpretation is that income-side indicators and cost-side indicators are moving differently. Prices, sales channels, income, and investment showed some improvement, while production costs, unit costs, climate impacts, pests, and living costs continued to constrain overall sentiment. Farmers may therefore feel that revenue opportunities exist but that the burdens they must absorb remain heavy. This gap can limit investment and weaken confidence even when some market indicators improve.
A third interpretation concerns farm continuity. The high willingness to continue farming shows that many farmers still plan to remain in agriculture, but the weak successor outlook points to long-term uncertainty. This distinction is crucial for rural policy. It means that the current farm base may continue operating in the short run, while the next-generation foundation remains fragile. Sentiment indicators should therefore include both current intention and future continuity.
A fourth interpretation is that climate and rural vitality risks are being internalized as persistent conditions. Farmers do not appear to regard climate, pests, natural disasters, population decline, and rural disappearance as short-term issues that will quickly normalize. If these risks are perceived as long-term burdens, they can influence farming decisions even when prices or policy expectations improve in a particular quarter.
From an economic-psychology perspective, the pilot's most important feature is the separation between objective conditions and perceived constraints. Farmers may respond to cost pressure, climate damage, or trade uncertainty not only when the objective shock occurs, but also when they expect the shock to persist. This expectation channel can affect behavior before official data confirm a decline in income or production. The index therefore has potential value as a leading or nowcasting indicator, provided that future data are accumulated and tested against farm-income, price, investment, and production outcomes.
The results also suggest that a sentiment index should not be used mechanically. A single below-100 reading is not a crisis diagnosis, and a small quarter-to-quarter increase is not a recovery diagnosis. Read the index alongside its subcomponents, commodity and regional context, and objective indicators. Its policy value lies in triangulation: it helps explain why farmers may hesitate to invest or expand production even when some market indicators look favorable.
WHY CONTINUED DATA ACCUMULATION MATTERS
The most important lesson from the pilot is that the index should be continued regularly so that a time series can be accumulated. Two quarters are enough to verify that the survey and calculation framework can operate, but they are not enough to identify stable trends, seasonal patterns, or turning points. A quarterly survey, and eventually a monthly survey if resources allow, would make it possible to observe whether sentiment improves during harvest periods, deteriorates during input-purchase periods, responds to policy announcements, or changes after weather shocks.
Continued data accumulation is also necessary for refining the questionnaire. Some items may be more sensitive to short-term changes, while others may move slowly. Climate impacts, rural disappearance, and farm succession may be structural indicators. Prices, costs, investment, policy expectations, and trade concerns may move more quickly. A longer data series would allow researchers to examine which items are useful as leading signals and which should be interpreted as background conditions.
Sampling and weighting also need further refinement. The pilot used KREI local correspondents and applied stratification and weights by farm type and scale. Future work should examine whether the sample should be broadened, how regional and commodity-specific representation should be improved, and whether separate indices should be produced for grains, fruits and vegetables, livestock, farm size, region, age group, or main income class. A single national index is useful for communication, but sub-indices may be more useful for policy diagnosis.
The method for calculating the representative index should also be reviewed. The pilot uses a clear and transparent approach: response scores are transformed to a 50-150 scale, weighted, averaged by domain, and then averaged into a comprehensive index. This simplicity is valuable, but alternative weighting methods may be considered as the data accumulate. For example, domain weights could be adjusted to reflect policy importance, economic contribution, or statistical reliability. Any change should preserve transparency so that users can understand what the index means.
Finally, regular publication can increase the index's value. If farmers, policy makers, researchers, cooperatives, and local governments learn to read the index over time, it can become a shared reference point for discussing agricultural conditions. The index should be accompanied by careful explanation, because a value below 100, a quarterly increase, or a domain-level difference can be misread if the benchmark and interpretation rules are not clear.
Validation should be built into future rounds. Once a longer time series is available, the index should be compared with agricultural income, input-price indices, farm-gate prices, machinery investment, disaster claims, farm-loan demand, and policy participation. If some domains lead objective outcomes by one or two quarters, they can be used as early-warning indicators. If other domains move slowly, they may be better treated as structural background indicators. This distinction will make the index more useful for both economists and policymakers.
Seasonality also requires careful treatment. Agricultural sentiment may naturally vary by cropping calendar, harvest timing, livestock cycles, input-purchase periods, and weather events. A quarterly series should therefore be published long enough to distinguish seasonal movement from genuine turning points. Over time, seasonal adjustment or year-on-year comparison may become necessary, especially if the index is used in policy briefings or budget discussions.
POLICY IMPLICATIONS
The first implication is that sentiment indicators can complement conventional agricultural statistics. Official statistics remain the foundation for policy analysis, but they often show outcomes after decisions have already been made. A sentiment index can provide early signals about management pressure, investment reluctance, policy expectations, and perceived risks. It is especially useful when the policy goal is to respond before problems become visible in income or production statistics.
The second implication is that policy diagnosis should separate current assessment from outlook. In the pilot, both current conditions and future outlook improved in the fourth quarter, but the outlook remained more conservative than the current assessment. This difference matters. A farmer may feel that current conditions are less bad than before while still expecting the next 12 months to remain difficult. Policy responses should consider both dimensions.
The third implication is that cost pressure should receive close attention. The pilot suggests that price and distribution conditions may improve without removing the burden of production costs and unit costs. If input-cost pressure remains high, improved sales prices may not translate into confidence, investment, or farm continuity. Policies related to input markets, energy, fertilizer, feed, machinery, finance, and risk management should therefore be read together with sentiment data.
The fourth implication is that economic-policy monitoring must integrate climate and environmental risk. Farmers’ economic sentiment is not shaped only by markets. It is also shaped by pests, animal diseases, extreme weather, and repeated disaster experience. Because a high share of respondents reported climate-related damage, climate adaptation should be treated as part of farm-economic stability, not as a separate environmental agenda.
The fifth implication is that farm succession needs a different policy lens from current farm continuation. The pilot shows strong willingness to continue farming but weak successor readiness. This means policies aimed at maintaining current production should not be conflated with policies aimed at sustaining the next generation. Farm succession, young farmer settlement, family farm transfer, and retirement pathways need to be monitored through separate indicators.
The sixth implication is that agricultural policy communication matters. Expectations for new policies were positive, but overall policy direction remained near neutral, and trade concerns persisted. Regular sentiment data can help identify whether policy messages are reaching farmers, whether farmers understand the expected effects, and where uncertainty remains. In this sense, the index can function as a feedback device for policy implementation.
The seventh implication for other Asian countries is that a farmer sentiment index can be a low-cost but useful addition to agricultural monitoring systems. Many countries face similar combinations of climate risk, aging farmers, cost pressure, and rural depopulation. A regular farmer survey, even if initially implemented as a pilot, can help governments understand how producers evaluate current conditions and what they expect in the near future.
The eighth implication is that the index should be communicated with professional discipline. Farmer sentiment is politically sensitive because it can be used to support claims about crisis, recovery, policy success, or policy failure. The responsible approach is to publish the benchmark, sample structure, question wording, domain composition, weighting method, and interpretation cautions together with the headline index. This transparency will reduce the risk that a single number is overinterpreted.
The ninth implication is that sentiment data can improve policy timing. If farmers’ outlook deteriorates before official income data decline, policymakers can review credit support, input-cost relief, disaster-prevention measures, market-stabilization tools, or communication on new policies earlier. Conversely, if sentiment improves while objective indicators remain weak, it may signal that policy expectations or local market conditions are improving before they appear in national statistics. Either way, the index can help make agricultural policy more anticipatory.
CONCLUSION
The Farmers’ Economic Sentiment Index was developed and implemented as a pilot to provide timely information on farmers’ assessment of current agricultural conditions and their outlook for the next 12 months. The pilot confirmed that farmers’ sentiment can be measured through a structured questionnaire, transformed into comparable index values, and interpreted across domains such as farm management, rural life and vitality, climate and environment, and agricultural policy.
The 2025 third- and fourth-quarter results show a slight improvement in overall sentiment, but not a shift to positive conditions. The comprehensive index remained below 100, current-condition and outlook indices remained clearly below the neutral benchmark, and cost, climate, living-cost, and rural-vitality concerns continued to weigh on perceptions. The results also reveal an important distinction between farmers’ willingness to continue current farming and uncertainty about securing successors.
The main value of the pilot is not the two-quarter result itself but establishing a measurement framework that can be repeated. Going forward, the survey should be continued regularly; the sample and weights should be refined; domain and sub-group indices should be reviewed; and the data should be accumulated into a time series. If developed carefully, the index can become a useful early-warning and policy-feedback tool for Korea and a practical reference for other Asian countries seeking to understand farmers’ perceptions in a rapidly changing agricultural environment.
REFERENCES
Dailian. 2026. "Farmers’ economic sentiment improves slightly in the fourth quarter but remains below the neutral benchmark." February 2026. https://www.dailian.co.kr/news/view/1610820/?sc=rss
eToday. 2026. "KREI releases pilot results for the Farmers’ Economic Sentiment Index." February 2026. https://www.etoday.co.kr/news/view/2556291?trc=right_categori_news_estudio
Joint Ministries of the Government of Korea. 2025. Measures to Improve the Agricultural Product Distribution Structure. Economic Ministers’ Meeting 25-6-2.
Kim, S., Lee, S., Lee, K., Ji, J., and Lim, J. 2026. Development of the Farmers’ Economic Sentiment Index and Pilot Survey Results. KREI Agricultural Policy Focus No. 234. Korea Rural Economic Institute.
Korea Rural Economic Institute. 2026. Development of the Farmers’ Economic Sentiment Index and Pilot Survey Results. KREI Repository. https://repository.krei.re.kr/handle/2018.oak/32640
Kwon, S. et al. 2018. A Study on Improving the Economic Sentiment Index. National Accounts Review 2018-4. Bank of Korea.
Mintert, J., and Langemeier, M. 2024a. Farmer Sentiment Drifts Lower on Weaker Future Expectations: May 2024. Purdue University-CME Group Ag Economy Barometer.
Mintert, J., and Langemeier, M. 2024b. Farmer Sentiment Drifts Lower on Weaker Future Expectations: June 2024. Purdue University-CME Group Ag Economy Barometer.
Newsis. 2026. "KREI develops Farmers’ Economic Sentiment Index and releases pilot survey results." February 11, 2026. https://mobile.newsis.com/view/NISX20260211_0003511488
Nongmin News. 2026. "Even as earnings improve, burdens remain: farmers’ perceived business conditions continue to be weak." Daum News, February 15, 2026. https://v.daum.net/v/0SXTyeKpNz
Statistics Research Institute. 2024. Living Environment, Climate Change, and Changes in Crop Production. Korean Social Trends 2024: 267-280.