INTRODUCTION
This article is translated from a webpage titled “Japanese Food Self-sufficiency Potential (日本の食料自給力)” (http://www.maff.go.jp/j/zyukyu/zikyu_ritu/012_1.html). This webpage is a subpage of a webpage titled “About food self-sufficiency rate and food self-sufficiency(食料自給率・食料自給力について)” , which is under a webpage or a project titled “Knowledge about food situation in Japan(知ってる?日本の食料事情)” (http://www.maff.go.jp/j/zyukyu/index.html).
Since 2000, the food self-sufficiency ratio, which is measured in calorie base has been used as a core index of food safety in the Basic Plan for Food, Agriculture and Rural Areas (hereinafter called “basic plan”). The other indexes and feed self-sufficiency ratio which are in weight based, are also used.
The basic plan is revised every 5 years. In each revision, the target ratio has been revised. The target year is set 10 years after the planning year. For example, the first basic plan in 2000, the target ratio was set as 45% in 2010. The targeted ratio was kept at the same level or increased by the basic plan in 2010. However, in the latest basic plan in 2015, it was pulled down at 5%. At the same time, a new target concerning food safety was introduced, which is food self-sufficiency potential index.
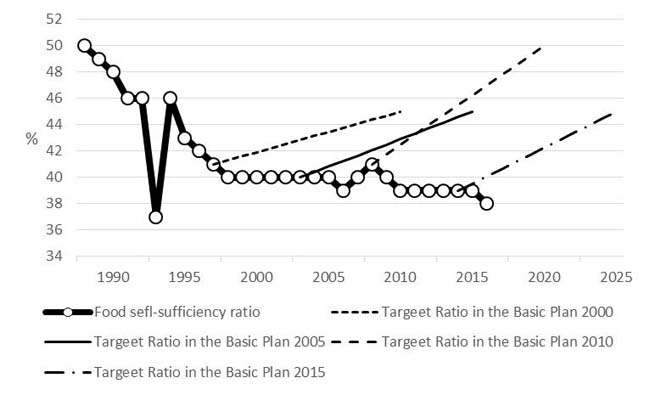
Fig. 1. Food self-sufficiency ratio: targeted and actual ratio
Source: MAFF, Food Balance Sheet and Basic Plan for Food, Agriculture and Rural Areas
Concerning the reason why the new concept was introduced, see “New basic plan and policy review on securing stable food supply and food security in Japan (part 2)” translated by F. Kabuta in FFTC-AP. http://ap.fftc.agnet.org/ap_db.php?id=571
This article is based on a translated website titled “Japanese Food Self-sufficiency Potential”. The URL is as follows.
http://www.maff.go.jp/j/zyukyu/zikyu_ritu/012_1.html
The latest basic plan assumes four patterns of scenario for calculation of food self-sufficiency potential. In the web page, the assumption, method and results of the calculation are summarized in detail. The data source except sections 5 and 6 in this article as the above mentioned website states. The sources of the other two sections are the appendix of the web pages; “Examples of meal menu corresponding to each pattern” and “Manual of food self-sufficiency potential index”. The information will be helpful to understand the new concept of food safety more practically and clearly.
“Japanese Food Self-sufficiency Potential”
The food self-sufficiency ratio expresses the potential of food production capacity of Japanese agriculture, forestry and fisheries. For promoting discussion about food safety among citizens, the concept was introduced in the basic plan by the Cabinet in May 2015.
- National attitude toward food supply in the future
A great number of citizens fear a decrease of national food supply capacity under unstable situation of international food market.
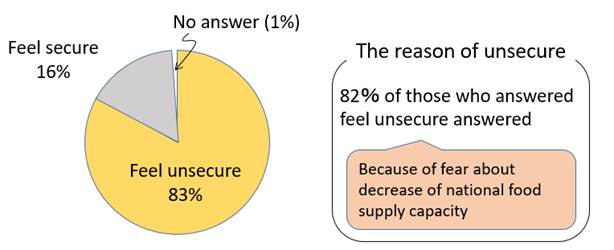
Fig. 2. Attitude of citizens towards food security
Source: the Cabinet (2014) Public opinion survey about food supply.
- What is food self-sufficiency potential index?
The food self-sufficiency potential indicates how much food can be provided by only national production when domestic agricultural land so on is fully utilized. The index is estimated in four different patterns, taking into account the divergence from current dietary habits.
Pattern A. Cultivation centering on staple cereals such as rice, wheat, and soybeans, maximizes calorie efficiency with consideration for nutritional balance to some extent.
Pattern B. Cultivation centering on staple cereals such as rice, wheat, and soybeans, maximizes calorie efficiency.
Pattern C. Cultivation centering on tubers and root crops, maximizes calorie efficiency with consideration for nutritional balance to some extent.
Pattern D. Cultivation centering on tubers and root crops, maximizes calorie efficiency.
The criteria of the classification is summarized in Table 1
Table 1. Criteria of the classification.
|
Pattern
|
A
|
B
|
C
|
D
|
|
Main crops
|
Rice, wheat and soybean
|
〇
|
〇
|
|
|
|
Tuber and root crops
(ex. Potato)
|
|
|
〇
|
〇
|
|
Consideration of nutrition balance
|
〇
|
|
〇
|
|
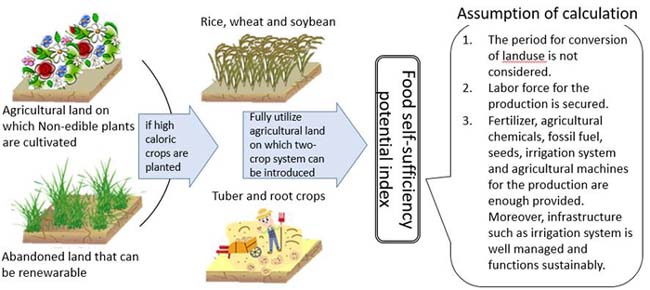
Fig. 3. Viewpoints of food self-sufficiency potential index
3. Food self-sufficiency potential index in 2016
Food self-sufficiency potential index in 2016 clarifies that cultivation centering on tubers and root crops (pattern C and D) can provide more than estimated requirement energy per person per day. However, the corresponding dietary pattern will be far different from the current one. On the other hand, cultivation centering on stable crops (patterns A and B) can realize dietary pattern closer to the current one. But provided energy is significant less than the estimated required energy.
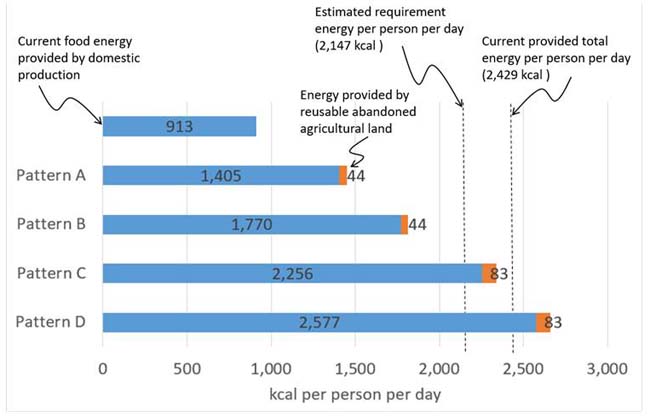
Fig. 4. Food self-sufficiency potential index in 2016.
4. Change of Food self-sufficiency potential index
Food self-sufficiency ratio has remained around 40 % steady for 20 years from 1989. However, food self-sufficiency potential index has been declining lately. It is worried that the food supply potential will still decrease more.
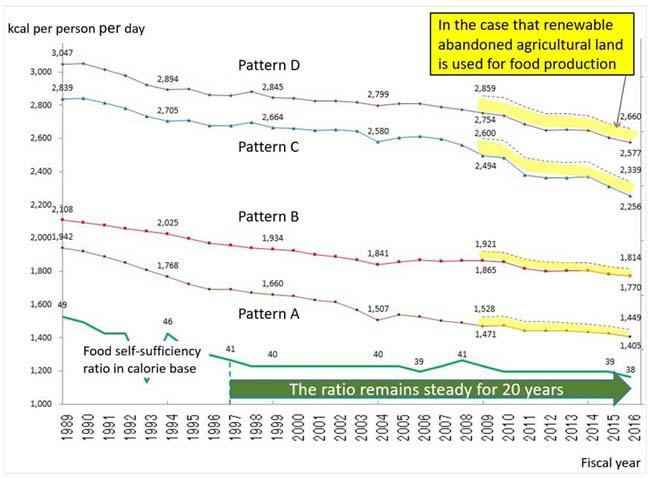
Fig. 5. Change of food self-sufficiency ratio and potential index.
5. Examples of meal menu corresponding to each pattern
According to the results of estimation, food self-sufficiency potential index is from 1,500 to 2,700 kcal per person per day in 2016. Example of meal menu corresponding to each pattern is as follows. Incidentally, the energy per person per day indicated above the following figures is the value of 2014.
(1) Pattern A : Centering on staple cereals with consideration for nutritional balance
<1,478kcal per person per day>
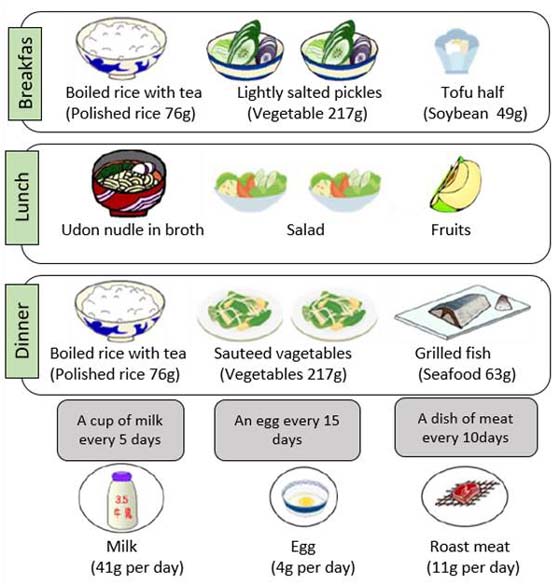
Fig. 6. A menu of pattern A
(2) Pattern B : Centering on staple cereals
<1,853kcal per person per day>
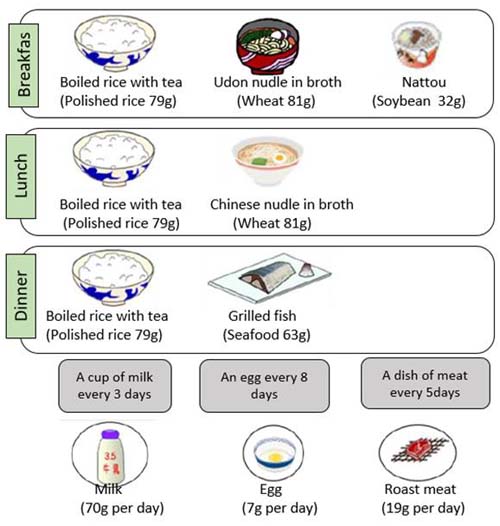
Fig. 7. A menu of pattern B
(3) Pattern C: Centering on tubers and root crops with consideration for nutritional balance
<2,456 kcal per person per day>
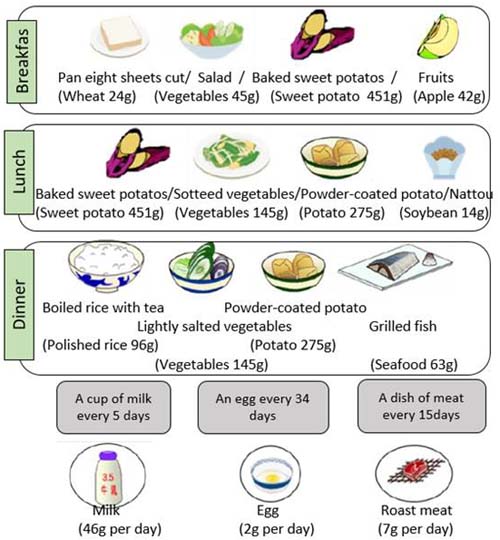
Fig. 8. A menu of pattern C
(4) Pattern D: Centering on tubers and root crops
<2,736 kcal per person per day>
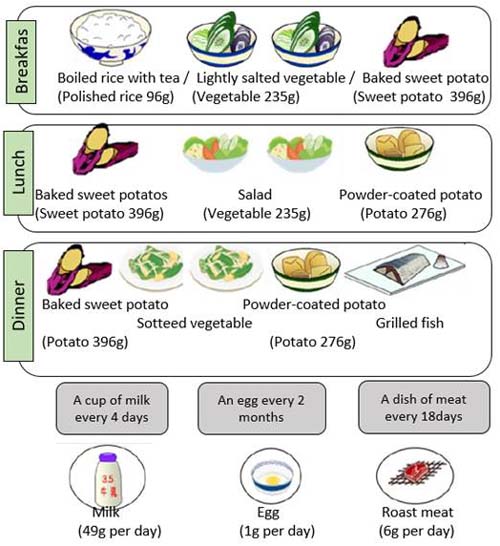
Fig. 9. A menu of pattern D
6. Estimation method of food self-sufficiency potential index
(1) Mathematical definition and assumption about food self-sufficiency potential index
The index can be calculated with the equation (1).
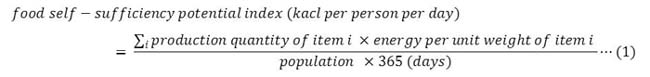
To obtain the index, first, multiply production quantity of each item by the energy per unit weight, sum them up and then divide it by population and the number of days in a year (365). In the calculation, yield rates and rates of stock decrease are considered.
The calculation is carried by every pattern mentioned above (see Table 1). Apart from this, two cases are assumed, i.e., renewable abondoned agricultural land is utilized or not. Accordingly eight patterns of index are calculated in total (see Fig. 5). Some technical conditions mentioned in Figure. 3 are also assumed.
(2) Method to estimate production quantity of crops
The quantity of each crop calculated by the equation (2)

Corresponding to pattern, crops are selected as shown in Table 2.
Table 2. Planted crops in each pattern
|
Pattern
|
A
|
B
|
C
|
D
|
|
Rice
|
〇
|
〇
|
〇
|
〇
|
|
Wheat
|
〇
|
〇
|
〇
|
-
|
|
Soybeans
|
〇
|
〇
|
〇
|
-
|
|
Sweet potato
|
-
|
-
|
〇
|
〇
|
|
Potato
|
-
|
-
|
〇
|
〇
|
|
Vegetables
|
〇
|
〇
|
〇
|
〇
|
|
Fruits
|
〇
|
-
|
〇
|
-
|
|
Sugarcane
|
〇
|
〇
|
〇
|
〇
|
|
Feed
|
〇
|
〇
|
〇
|
〇
|
Plantation area is set to maximize supplied energy under the conditions of each pattern (see Table 3). Targeted nutrients for consideration of nutritional balance and the standard intake are listed in Table 4.
Table 3. Condition to plantation of each pattern
|
Conditions
|
Pattern A
|
Pattern B
|
Pattern C
|
Pattern D
|
|
Land Use
|
Two-crop system is carried on multi-purpose paddy field and upland field in Kanto district and westward. The combinations as follows.
1) Rice -Wheat
2) Soybean - Wheat
3) Tuber and roots crops - Vegetables
4) Vegetables - Wheat
|
○
|
○
|
○
|
○
|
|
In wet-paddy field rice is planted.
|
○
|
○
|
○
|
○
|
|
In Okinawa prefecture, double cropping of rice is carried.
|
○
|
○
|
○
|
○
|
|
Sweet potato is planted in well-dry paddy field and upland field.
|
×
|
×
|
○
|
○
|
|
Potato is planted in well-dry paddy field and upland field.
|
×
|
×
|
○
|
○
|
|
Fruits are produced in the exiting orchard.
|
○
|
×
|
○
|
×
|
|
Sugarcane is produced in upland field in Okinawa prefecture except area of orchard.
|
○
|
○
|
○
|
○
|
|
Feed is produced (herbage) is cultivated in Soya District of Hokkaido.
|
○
|
○
|
○
|
○
|
|
Nutrition
|
Intake protein should be more than the standard value estimated by "Dairy reference intake" Ministry of Health, Labor and Welfare (2015).
|
○
|
×
|
○
|
×
|
|
The number of types of vitamin and mineral intakes that are more than standard value estimated by "Dairy reference intake" Ministry of Health, Labor and Welfare (2015) should be over 18.
|
○
|
×
|
○
|
×
|
Table 4. Targeted nutrients and type of standard value
|
Nutrient
|
Type of standard value
|
Nutrient
|
Type of standard value
|
|
Protein
|
Recommended dietary allowance
|
Mineral
|
Sodium
|
Estimated average requirement
|
|
Vitamin
|
Vitamin A
|
Recommended dietary allowance
|
Potassium
|
Adequate intake
|
|
Vitamin D
|
Adequate intake
|
Calcium
|
Recommended dietary allowance
|
|
Vitamin E
|
Adequate intake
|
Magnesium
|
Recommended dietary allowance
|
|
Vitamin K
|
Adequate intake
|
Rin
|
Recommended dietary allowance
|
|
Vitamin B1
|
Recommended dietary allowance
|
Iron
|
Recommended dietary allowance
|
|
Vitamin B2
|
Recommended dietary allowance
|
Zinc
|
Recommended dietary allowance
|
|
Niacin
|
Recommended dietary allowance
|
Copper
|
Recommended dietary allowance
|
|
Vitamin B6
|
Recommended dietary allowance
|
Manganese
|
Adequate intake
|
|
Vitamin
B 12
|
Recommended dietary allowance
|
Iodine
|
Recommended dietary allowance
|
|
Folic acid
|
Recommended dietary allowance
|
Selenium
|
Recommended dietary allowance
|
|
Pantothenic acid
|
Adequate intake
|
Chromium
|
Adequate intake
|
|
Biotin
|
Adequate intake
|
Molybdenum
|
Recommended dietary allowance
|
|
Vitamin C
|
Recommended dietary allowance
|
|
|
|
In the case of rice, the average yield of the year is applied to the yield of unit agricultural land. In the case of the other crops, the average yield of the past 7 except lowest and highest yield is applied. The yield of multi-purpose paddy field and irrigation equipped upland field is estimated with consideration of yield increasing effect.
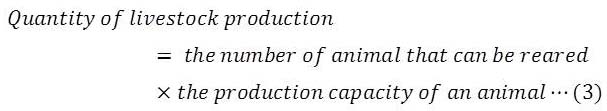
(3) Method to estimate production quantity of livestock
The production quantity of livestock is calculated by multiplying the number of animal and production capacity per animal. On this occasion the rate of slaughter, i.e., the ratio of animal shipped to meat market, is taken into account.
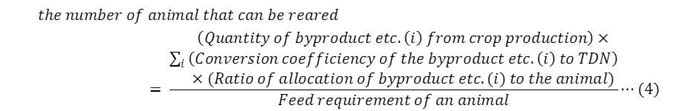
1) Estimation of the number of animals that can be reared
The number of animals that can be reared is estimated by that estimated feed supply based on byproducts of crop production etc. divided by feed requirement of each animal.
The ratio of allocation of byproduct etc. to each animal is fixed by current demand quantity. Domestic produced roughage (ex. rice straw, wheat straw, potato stalk, bagasse and pasture) is allocated to cows and beef cattle equally (1:1). Domestic concentrated feed (ex. rice bran, rice oilcake, wheat bran and treacle) is allocated to pigs, broilers and hens in the ratio of 2:1:2.
2) Estimation of the production capacity of an animal
1. Cows
The quantity of production per cow is corrected with reference to Australian and the other domestic case of milk production that raise cows on only roughage.
2. Beef cattle
The quantity of production per animal is corrected with reference to Australian and the other domestic case of beef production that raise animal on only roughage. The weight of dressed carcass is fixed to the average weight of the year.
3. Pigs, broilers and eggs
The quantity of production per animal is calculated by the weight of dressed carcass in the case of pig production, the weight of meat with born in the case of broiler and the number of egg produced by adult hens.
(4) Method to estimate production quantity of marine and forestry products
1) Seafood
The estimation of production quantity consists of three components. The first is current catch per year. The second is seafood under TAC system. The production is estimated by the residual catch within the TAC. The third is seafood from aquaculture. The production quantity is estimated under assumption that fish is cultivated on only feed made from fish scraps.
2) Marine algae
The current production is used for estimation.
3) Mushrooms
4) The current production is used for estimation.
(5) Method to estimate production quantity of processed products
The quantity of processed food listed in Table 5 is calculated by multiplying the production quantity of source material and yielding percentage together.
Table 5. Processed foods and the source materials
|
Item
|
Source material
|
|
Refined sugar
|
Sugarcane
|
|
Rice bran oil
|
Rice
|
|
beef tallow
|
Beef
|
|
Livestock
|
Pork
|
|
Chicken fat
|
Chicken meat
|
|
Fish oil
|
Fish meat
|
|
Date submitted: May 11, 2018
Reviewed, edited and uploaded: July 20, 2018
|

Understanding food self-sufficiency ratio and food self-sufficiency potential index in Japan
INTRODUCTION
This article is translated from a webpage titled “Japanese Food Self-sufficiency Potential (日本の食料自給力)” (http://www.maff.go.jp/j/zyukyu/zikyu_ritu/012_1.html). This webpage is a subpage of a webpage titled “About food self-sufficiency rate and food self-sufficiency(食料自給率・食料自給力について)” , which is under a webpage or a project titled “Knowledge about food situation in Japan(知ってる?日本の食料事情)” (http://www.maff.go.jp/j/zyukyu/index.html).
Since 2000, the food self-sufficiency ratio, which is measured in calorie base has been used as a core index of food safety in the Basic Plan for Food, Agriculture and Rural Areas (hereinafter called “basic plan”). The other indexes and feed self-sufficiency ratio which are in weight based, are also used.
The basic plan is revised every 5 years. In each revision, the target ratio has been revised. The target year is set 10 years after the planning year. For example, the first basic plan in 2000, the target ratio was set as 45% in 2010. The targeted ratio was kept at the same level or increased by the basic plan in 2010. However, in the latest basic plan in 2015, it was pulled down at 5%. At the same time, a new target concerning food safety was introduced, which is food self-sufficiency potential index.
Fig. 1. Food self-sufficiency ratio: targeted and actual ratio
Source: MAFF, Food Balance Sheet and Basic Plan for Food, Agriculture and Rural Areas
Concerning the reason why the new concept was introduced, see “New basic plan and policy review on securing stable food supply and food security in Japan (part 2)” translated by F. Kabuta in FFTC-AP. http://ap.fftc.agnet.org/ap_db.php?id=571
This article is based on a translated website titled “Japanese Food Self-sufficiency Potential”. The URL is as follows.
http://www.maff.go.jp/j/zyukyu/zikyu_ritu/012_1.html
The latest basic plan assumes four patterns of scenario for calculation of food self-sufficiency potential. In the web page, the assumption, method and results of the calculation are summarized in detail. The data source except sections 5 and 6 in this article as the above mentioned website states. The sources of the other two sections are the appendix of the web pages; “Examples of meal menu corresponding to each pattern” and “Manual of food self-sufficiency potential index”. The information will be helpful to understand the new concept of food safety more practically and clearly.
“Japanese Food Self-sufficiency Potential”
The food self-sufficiency ratio expresses the potential of food production capacity of Japanese agriculture, forestry and fisheries. For promoting discussion about food safety among citizens, the concept was introduced in the basic plan by the Cabinet in May 2015.
A great number of citizens fear a decrease of national food supply capacity under unstable situation of international food market.
Fig. 2. Attitude of citizens towards food security
Source: the Cabinet (2014) Public opinion survey about food supply.
The food self-sufficiency potential indicates how much food can be provided by only national production when domestic agricultural land so on is fully utilized. The index is estimated in four different patterns, taking into account the divergence from current dietary habits.
Pattern A. Cultivation centering on staple cereals such as rice, wheat, and soybeans, maximizes calorie efficiency with consideration for nutritional balance to some extent.
Pattern B. Cultivation centering on staple cereals such as rice, wheat, and soybeans, maximizes calorie efficiency.
Pattern C. Cultivation centering on tubers and root crops, maximizes calorie efficiency with consideration for nutritional balance to some extent.
Pattern D. Cultivation centering on tubers and root crops, maximizes calorie efficiency.
The criteria of the classification is summarized in Table 1
Table 1. Criteria of the classification.
Pattern
A
B
C
D
Main crops
Rice, wheat and soybean
〇
〇
Tuber and root crops
(ex. Potato)
〇
〇
Consideration of nutrition balance
〇
〇
Fig. 3. Viewpoints of food self-sufficiency potential index
3. Food self-sufficiency potential index in 2016
Food self-sufficiency potential index in 2016 clarifies that cultivation centering on tubers and root crops (pattern C and D) can provide more than estimated requirement energy per person per day. However, the corresponding dietary pattern will be far different from the current one. On the other hand, cultivation centering on stable crops (patterns A and B) can realize dietary pattern closer to the current one. But provided energy is significant less than the estimated required energy.
Fig. 4. Food self-sufficiency potential index in 2016.
4. Change of Food self-sufficiency potential index
Food self-sufficiency ratio has remained around 40 % steady for 20 years from 1989. However, food self-sufficiency potential index has been declining lately. It is worried that the food supply potential will still decrease more.
Fig. 5. Change of food self-sufficiency ratio and potential index.
5. Examples of meal menu corresponding to each pattern
According to the results of estimation, food self-sufficiency potential index is from 1,500 to 2,700 kcal per person per day in 2016. Example of meal menu corresponding to each pattern is as follows. Incidentally, the energy per person per day indicated above the following figures is the value of 2014.
(1) Pattern A : Centering on staple cereals with consideration for nutritional balance
<1,478kcal per person per day>
Fig. 6. A menu of pattern A
(2) Pattern B : Centering on staple cereals
<1,853kcal per person per day>
Fig. 7. A menu of pattern B
(3) Pattern C: Centering on tubers and root crops with consideration for nutritional balance
<2,456 kcal per person per day>
Fig. 8. A menu of pattern C
(4) Pattern D: Centering on tubers and root crops
<2,736 kcal per person per day>
Fig. 9. A menu of pattern D
6. Estimation method of food self-sufficiency potential index
(1) Mathematical definition and assumption about food self-sufficiency potential index
The index can be calculated with the equation (1).
To obtain the index, first, multiply production quantity of each item by the energy per unit weight, sum them up and then divide it by population and the number of days in a year (365). In the calculation, yield rates and rates of stock decrease are considered.
The calculation is carried by every pattern mentioned above (see Table 1). Apart from this, two cases are assumed, i.e., renewable abondoned agricultural land is utilized or not. Accordingly eight patterns of index are calculated in total (see Fig. 5). Some technical conditions mentioned in Figure. 3 are also assumed.
(2) Method to estimate production quantity of crops
The quantity of each crop calculated by the equation (2)
Corresponding to pattern, crops are selected as shown in Table 2.
Table 2. Planted crops in each pattern
Pattern
A
B
C
D
Rice
〇
〇
〇
〇
Wheat
〇
〇
〇
-
Soybeans
〇
〇
〇
-
Sweet potato
-
-
〇
〇
Potato
-
-
〇
〇
Vegetables
〇
〇
〇
〇
Fruits
〇
-
〇
-
Sugarcane
〇
〇
〇
〇
Feed
〇
〇
〇
〇
Plantation area is set to maximize supplied energy under the conditions of each pattern (see Table 3). Targeted nutrients for consideration of nutritional balance and the standard intake are listed in Table 4.
Table 3. Condition to plantation of each pattern
Conditions
Pattern A
Pattern B
Pattern C
Pattern D
Land Use
Two-crop system is carried on multi-purpose paddy field and upland field in Kanto district and westward. The combinations as follows.
1) Rice -Wheat
2) Soybean - Wheat
3) Tuber and roots crops - Vegetables
4) Vegetables - Wheat
○
○
○
○
In wet-paddy field rice is planted.
○
○
○
○
In Okinawa prefecture, double cropping of rice is carried.
○
○
○
○
Sweet potato is planted in well-dry paddy field and upland field.
×
×
○
○
Potato is planted in well-dry paddy field and upland field.
×
×
○
○
Fruits are produced in the exiting orchard.
○
×
○
×
Sugarcane is produced in upland field in Okinawa prefecture except area of orchard.
○
○
○
○
Feed is produced (herbage) is cultivated in Soya District of Hokkaido.
○
○
○
○
Nutrition
Intake protein should be more than the standard value estimated by "Dairy reference intake" Ministry of Health, Labor and Welfare (2015).
○
×
○
×
The number of types of vitamin and mineral intakes that are more than standard value estimated by "Dairy reference intake" Ministry of Health, Labor and Welfare (2015) should be over 18.
○
×
○
×
Table 4. Targeted nutrients and type of standard value
Nutrient
Type of standard value
Nutrient
Type of standard value
Protein
Recommended dietary allowance
Mineral
Sodium
Estimated average requirement
Vitamin
Vitamin A
Recommended dietary allowance
Potassium
Adequate intake
Vitamin D
Adequate intake
Calcium
Recommended dietary allowance
Vitamin E
Adequate intake
Magnesium
Recommended dietary allowance
Vitamin K
Adequate intake
Rin
Recommended dietary allowance
Vitamin B1
Recommended dietary allowance
Iron
Recommended dietary allowance
Vitamin B2
Recommended dietary allowance
Zinc
Recommended dietary allowance
Niacin
Recommended dietary allowance
Copper
Recommended dietary allowance
Vitamin B6
Recommended dietary allowance
Manganese
Adequate intake
Vitamin
B 12
Recommended dietary allowance
Iodine
Recommended dietary allowance
Folic acid
Recommended dietary allowance
Selenium
Recommended dietary allowance
Pantothenic acid
Adequate intake
Chromium
Adequate intake
Biotin
Adequate intake
Molybdenum
Recommended dietary allowance
Vitamin C
Recommended dietary allowance
In the case of rice, the average yield of the year is applied to the yield of unit agricultural land. In the case of the other crops, the average yield of the past 7 except lowest and highest yield is applied. The yield of multi-purpose paddy field and irrigation equipped upland field is estimated with consideration of yield increasing effect.
(3) Method to estimate production quantity of livestock
The production quantity of livestock is calculated by multiplying the number of animal and production capacity per animal. On this occasion the rate of slaughter, i.e., the ratio of animal shipped to meat market, is taken into account.
1) Estimation of the number of animals that can be reared
The number of animals that can be reared is estimated by that estimated feed supply based on byproducts of crop production etc. divided by feed requirement of each animal.
The ratio of allocation of byproduct etc. to each animal is fixed by current demand quantity. Domestic produced roughage (ex. rice straw, wheat straw, potato stalk, bagasse and pasture) is allocated to cows and beef cattle equally (1:1). Domestic concentrated feed (ex. rice bran, rice oilcake, wheat bran and treacle) is allocated to pigs, broilers and hens in the ratio of 2:1:2.
2) Estimation of the production capacity of an animal
1. Cows
The quantity of production per cow is corrected with reference to Australian and the other domestic case of milk production that raise cows on only roughage.
2. Beef cattle
The quantity of production per animal is corrected with reference to Australian and the other domestic case of beef production that raise animal on only roughage. The weight of dressed carcass is fixed to the average weight of the year.
3. Pigs, broilers and eggs
The quantity of production per animal is calculated by the weight of dressed carcass in the case of pig production, the weight of meat with born in the case of broiler and the number of egg produced by adult hens.
(4) Method to estimate production quantity of marine and forestry products
1) Seafood
The estimation of production quantity consists of three components. The first is current catch per year. The second is seafood under TAC system. The production is estimated by the residual catch within the TAC. The third is seafood from aquaculture. The production quantity is estimated under assumption that fish is cultivated on only feed made from fish scraps.
2) Marine algae
The current production is used for estimation.
3) Mushrooms
4) The current production is used for estimation.
(5) Method to estimate production quantity of processed products
The quantity of processed food listed in Table 5 is calculated by multiplying the production quantity of source material and yielding percentage together.
Table 5. Processed foods and the source materials
Item
Source material
Refined sugar
Sugarcane
Rice bran oil
Rice
beef tallow
Beef
Livestock
Pork
Chicken fat
Chicken meat
Fish oil
Fish meat
Date submitted: May 11, 2018
Reviewed, edited and uploaded: July 20, 2018