ABSTRACT
Rice (Oryza sativa) plays a vital role in farmers’ livelihoods and serves as a significant source of export income for Myanmar through the sale of surplus production. The use of certified rice seed is essential for increasing rice yields, and demand for certified seeds remains high throughout the country. Certified rice seed production is carried out by the public sector, seed production farmers, and private seed companies engaging in contract farming with local farmers. Among the regions, Mandalay stands out as the leading area for rice seed production by the private sector. The objectives of this study were to assess the socioeconomic conditions of rice seed production farmers and to compare the cost and return structures of contract and non-contract seed producers within the study area. The results indicate that younger farmers were more involved as non-contract seed producers, and their educational levels were generally higher compared to contract farmers. However, contract farmers possessed significantly greater experience in rice seed production. Both groups had access to farm machinery and infrastructure; nevertheless, non-contract farmers owned more warehouses, seed cleaners, and packaging machines than contract farmers. Cost and return analyses were conducted for the 2023–2024 monsoon and summer rice seed production seasons. The average rice yield of contract farmers was significantly higher than that of non-contract farmers during the monsoon season, while no significant difference was observed between the groups in the summer season. In both seasons, the average market price for certified rice seed was higher among non-contract farmers. However, seed production costs were significantly greater for non-contract farmers, primarily because they managed seed storage, cleaning, and packaging independently to access the market. In contrast, contract farmers had these processes handled by seed companies, as seeds were sold directly to the companies immediately after harvest under the terms of the contract. Contract farmers achieved a significantly higher benefit-cost ratio (BCR) than non-contract farmers during the study years. In conclusion, contract farming practices with private sector involvement should be further promoted, while the public sector should support non-contract farmers through cost-effective strategies and improved market information to foster the development of certified rice seed production and the overall rice industry.
Keywords: Certified rice seeds, Contract and non-contract seed production farmers, Cost and Return Analysis
INTRODUCTION
In Myanmar, rice is cultivated during both the monsoon and summer seasons, with the latter relying on irrigated water sources. According to the National Plan for 2022–2023, the total rice cultivation area amounted to 7.14 million hectares, comprising 6.07 million hectares of monsoon rice and 1.07 million hectares of summer rice. The average yield was 3.95 metric tons per hectare, resulting in a total production of approximately 27.98 million metric tons. During the same period, Myanmar exported over 1.22 million metric tons of rice (MOALI, 2023). In the current context, Myanmar is emerging as a significant player in the international rice trade. Among the top ten rice-exporting countries worldwide, Myanmar ranked 8th in the 2023–2024 (Seasia Stats, 2024). The country contributes to the global market by supplying affordable white rice and parboiled rice. Domestically, Myanmar cultivates a wide range of rice varieties. The top ten monsoon rice varieties include Sinthukha, Manawthukha, Ayeyarmin, Pawsanyin, Sinakayi-3, Meedone, Shwewarrtun, Hnann Karr, Sinthwelatt, and Yadanartoe. For summer cultivation, the leading varieties are Theehtetyinn, 90 Days, Sinthukha, Manawthukha, Yadanartoe, Pakhanshwewar, Shwethweyin, Supernankauk, Hmawbi-2, and Yezinlonethwe.
The Ministry of Agriculture, Livestock and Irrigation (MOALI) actively promotes the development of the seed industry by encouraging the participation of seed grower associations, private companies, and collaborating farmers (MOALI, 2023). The Department of Agricultural Research (DAR) is primarily responsible for producing breeder and foundation seeds of rice. In addition, private seed companies produce breeder and foundation seeds for their proprietary rice varieties. The Seed Division under the Department of Agriculture produces registered seeds on government seed farms. Seed production farmers then use these registered seeds to cultivate certified seeds on local farms for commercial distribution. Private seed companies also produce and market both registered and certified seeds, which are cultivated either on company-owned farms or through contract farming arrangements with local farmers. Contract Farming (CF) plays an increasingly important role in agricultural development across many developing countries. It refers to agricultural production conducted under a formal agreement between farmers and buyers, outlining specific conditions for production and marketing of the commodity. For private seed companies, contract farming provides a dependable supply of high-quality seeds, which is essential for meeting the rising demand for improved seed varieties. Thailand is considered one of the pioneers of contract farming in the Mekong region of Southeast Asia (Marks, 2022). Previous studies have also shown that, in general, rice farmers engaged in contract farming tend to achieve higher profits compared to those operating under non-contract arrangements (Setboonsarng et al., 2006). The national average rice yield in Myanmar stands at 3.95 metric tons per hectare (equivalent to 76.63 baskets per acre), which remains below the targeted yield of 5.15 metric tons per hectare (100 baskets per acre). Achieving higher yields is possible through the use of certified seeds of high-yielding varieties and the adoption of improved crop management practices. Studies have shown that grain yields are significantly higher when farmers utilize good-quality certified seeds. However, one of the key constraints in rice production is the limited availability of quality rice seeds, which remains a dominant factor affecting rice productivity (Khin Sandar Lin and Cho Cho San, 2018). To meet the growing demand of the rice industry, the rice seed sector in Myanmar still requires significant development, particularly in increasing the supply of certified seeds. The use of high-quality seeds is crucial for enhancing rice productivity. Previous research has highlighted contract farming with private sector involvement as a practical approach to increase seed production (Ashok et al., 2016). Currently, rice seed production is carried out by seed grower associations, private companies, and individual farmers, with growing encouragement for a private sector-led seed industry in Myanmar (San Kyi, 2019). Table 1 illustrates the total rice seed production area by seed producer farmers, as well as by the public and private sectors (Rice Division, DOA, 2024). The Mandalay Region records the largest seed production area by the private sector, totalling 1,121.41 hectares, while seed producer farmers are cultivating certified rice seeds on 2,706.60 hectares. Despite these efforts, there remains a limited number of studies in Myanmar that compares the costs and returns of contract versus non-contract seed producer farmers. Such analyses are essential to promote rice seed production and inform evidence-based policy recommendations for the development of the rice seed sector.
Table 1. Total seed-producing area by farmers, private seed companies and public sector in Myanmar (2022-2023)
|
No.
|
States and regions
|
Sown area (ha)
|
Total
|
|
Farmers
|
Private sector
|
Public sector
|
|
1
|
Nay Pyi Taw
|
180.49
|
925.13
|
0
|
1,105.62
|
|
2
|
Kachin
|
290.57
|
0
|
0
|
290.57
|
|
3
|
Kayah
|
60.70
|
0
|
0
|
60.70
|
|
4
|
Kayin
|
46.54
|
0
|
0
|
46.54
|
|
5
|
Chin
|
97.13
|
0
|
0
|
97.13
|
|
6
|
Sagaing
|
2,760.83
|
88.22
|
0
|
2,849.05
|
|
7
|
Tanintharyi
|
261.03
|
0
|
0
|
261.03
|
|
8
|
Bago
|
9,985.03
|
627.68
|
84.99
|
10,697.70
|
|
9
|
Magway
|
2,399.84
|
600.16
|
62.73
|
3,062.73
|
|
10
|
Mandalay
|
2,706.60
|
1,121.41
|
647.51
|
4,475.52
|
|
11
|
Mon
|
364.23
|
80.94
|
8.09
|
453.26
|
|
12
|
Rakhine
|
770.94
|
0
|
0
|
770.94
|
|
13
|
Yangon
|
1,477.94
|
0
|
0
|
1,477.94
|
|
14
|
Shan
|
530.96
|
101.58
|
37.23
|
669.77
|
|
15
|
Ayeyarwady
|
3,157.83
|
379.60
|
255.77
|
3,793.20
|
|
Total
|
25,090.65
|
3,924.72
|
1,096.32
|
30,111.69
|
Source: Rice Division DOA,2024
Objectives of the study
1. To observe the socioeconomic conditions of contract and non-contract certified rice seed production farmers in the study area
2. To compare the cost and return analysis of contract and non-contract rice seed production farmers in the study area.
METHODOLOGY
Study sites and sample selection for data collection
Amarapura Township and Patheingyi Township in the Mandalay Region were purposively selected as the study areas due to the high concentration of rice seed production farms located within these townships. Primary data were collected in November 2024 from both contract and non-contract rice seed production farmers through the structured questionnaires. Secondary data were obtained from official sources, including reports from the Department of Planning, Rice Division, Mandalay Region, and Township Offices of the Department of Agriculture (DOA) under the Ministry of Agriculture, Livestock and Irrigation (MOALI), as well as other relevant publications. A simple random sampling method was employed to select 211 seed production farmers in the study area. Among them, 98 contract farmers were cultivating certified rice seeds on approximately 275.72 hectares, under contractual agreements with private seed companies. In contrast, 113 non-contract farmers were producing certified rice seeds on around 325.48 hectares and were independently marketing their seeds.
Data collection and data analysis
Descriptive statistics, including mean, standard deviation, frequency, and percentage, were used to describe and compare the socioeconomic and farm characteristics of contract and non-contract seed producer farmers in the study area. Cost and return analysis was employed to estimate the expenses and benefits associated with rice seed production under both contract and non-contract farming systems. Enterprise budgeting was utilized to evaluate the costs and returns of the production process. The primary objective of enterprise budgeting is to illustrate differences in net benefits across various resource scenarios, thereby assisting in management decision-making (Olson, 2003). This analysis was applied to assess the profitability of certified rice seed production among farmers in the study area. Statistical analysis, including t-tests, was conducted using STATA software to determine the significance of differences observed between the two groups.
RESULTS AND DISCUSSION
Socioeconomic conditions of rice seed producer farmers in the study area
There is a statistically significant difference in age and education between farmers at the 99% confidence level, as indicated by the t-test results. Table 2 presents the age distribution of household heads among the sampled farms in the study area, including their frequencies and percentages. Younger farmers were more prevalent among non-contract seed producers. The average age of contract seed producer farmers was 54 years, while that of non-contract seed producers was 51 years.
Table 2. Demographic characteristics of rice seed producer farmers in the study area
|
Items
|
Contract seed production farmers (N=98)
|
Non-Contract seed production farmers (N=113)
|
|
Frequency
|
Percent
|
Frequency
|
Percent
|
|
Age group (year)
|
|
|
|
|
|
21 – 30
|
0
|
0.00
|
2
|
1.76
|
|
31 – 40
|
6
|
6.12
|
14
|
12.39
|
|
41 – 50
|
25
|
25.51
|
43
|
38.05
|
|
51 – 60
|
46
|
46.94
|
36
|
31.86
|
|
Over 60
|
21
|
21.43
|
18
|
15.93
|
|
Average Age
|
54.53 (35-74)
|
|
51.03 (27-78)
|
(t-test) 0.00***
|
Note: The values in the parentheses represent range. *** are significant differences at 1% level.
The education levels of household heads were categorized into four groups: primary, secondary, high school, and graduate levels. Among contract seed production farmers, the majority (55.10%) had attained secondary school education, compared to 41.59% among non-contract seed producers. No household heads were found to be illiterate. Within the contract seed producer group, 5.10% (five household heads) had attained graduate-level education. In contrast, the educational attainment was higher among non-contract seed producers, with 12.39% (fourteen household heads) holding graduate degrees. Figures 1 and 2 illustrate the distribution of education levels among contract and non-contract seed production farmers in the study area.
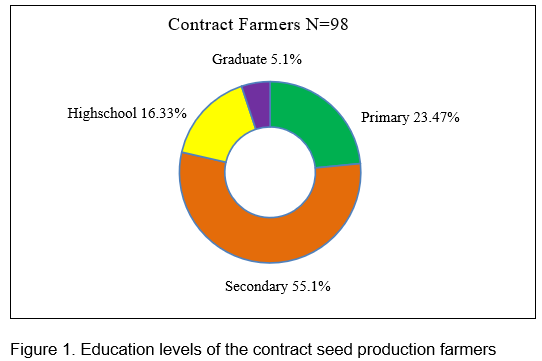
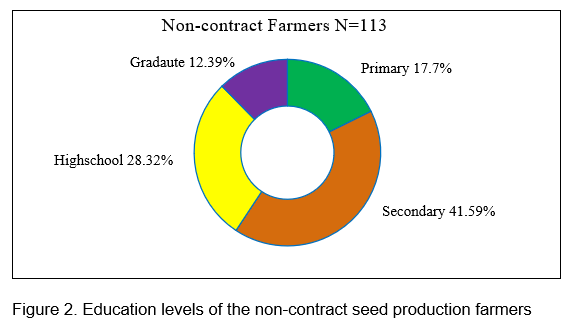
Table 3 presents information on household size, land ownership, rice seed production area, and farming experience of rice seed production farmers in the study area. The average household size was 4.30 for contract seed producers and 4.41 for non-contract seed producers. The average number of family laborers engaged in farming was 1.77 among contract seed producers and 2.02 among non-contract producers. In terms of farming experience, contract seed producers had an average of 28 years, while non-contract producers had 25 years; this difference was not statistically significant. Similarly, land ownership did not vary significantly between the two groups, with average farm sizes of 3.92 hectares for contract farmers and 3.59 hectares for non-contract farmers. The rice seed production areas were also comparable, averaging 2.81 hectares and 2.88 hectares, respectively. However, the average rice seed production experience was 6.22 years for contract farmers and 4.86 years for non-contract farmers, representing a statistically significant difference between the two groups at the 99% confidence level.
Table 3. Household size, land assets, seed production area and working experiences of rice seed production farmers in the study area.
|
Items
|
Unit
|
Contract farmers
(N=98)
|
Non-Contract farmers (N=113)
|
t-test
|
|
Average
|
SD
|
Average
|
SD
|
|
Household size
|
No.
|
4.30
(2-9)
|
1.39
|
4.41
(2-8)
|
1.18
|
0.52ns
|
|
Family farm labour
|
No.
|
1.77
(1-6)
|
0.99
|
2.02
(1-7)
|
0.96
|
0.06ns
|
|
Land ownership
|
ha
|
3.92
(0.40-41.28)
|
4.64
|
3.59
(0.81-28.32)
|
3.63
|
0.56ns
|
|
Average rice seed producing area
|
ha
|
2.81
(0.40-20.23)
|
2.35
|
2.88
(0.81-12.14)
|
2.45
|
0.81ns
|
|
Farming experience
|
Year
|
27.55
(4-51)
|
12.83
|
25.10
(5-55)
|
11.62
|
0.14ns
|
|
Rice seed production experience
|
Year
|
6.22
(1-15)
|
2.73
|
4.86
(1-17)
|
3.17
|
0.00***
|
Note: The values in the parentheses represent range. *** are significant differences at 1% level and ns is not significant differences.
Table 4 presents a comparison of farm assets between contract and non-contract rice seed production farmers. It was observed that non-contract farmers owned more physical assets such as warehouses, seed cleaners, and packaging machines compared to contract farmers. Household assets, which serve as important indicators of living standards, were also assessed in this study. These included housing materials, access to electricity, communication devices, transportation, and internet connectivity. Table 5 summarizes these findings. Brick houses were more prevalent among contract farmers (71.43%) than non-contract farmers (56.64%). Additionally, many farmers, regardless of contract status, owned light trucks for transporting agricultural products. Access to electricity, mobile phones, and internet (Wi-Fi) services was generally available among rice seed producer households.
Table 4. Farms assets of rice seed production farmers in the study area
|
Items
|
Contract seed production farmers (N=98)
|
Non-Contract seed production farmers (N=113)
|
Total seed production farmers(N=211)
|
|
Packaging machine
|
1 (1.02%)
|
6 (5.31%)
|
7 (3.32%)
|
|
Seed-cleaner
|
2 (2.04%)
|
7 (6.19%)
|
9 (4.27%)
|
|
Rice seeder
|
3 (3.06%)
|
7 (6.19%)
|
10 (4.74%)
|
|
Combine harvester
|
5 (5.10%)
|
11 (9.73%)
|
16 (7.58%)
|
|
Hand Tractor
|
24 (24.49%)
|
38 (33.63%)
|
63 (29.38%)
|
|
Tractor
|
30 (30.61%)
|
35 (30.97%)
|
65 (30.81%)
|
|
Warehouse
|
41 (41.84%)
|
63 (55.75%)
|
104 (49.29%)
|
Note: The values in the parentheses represent percentage of sample farmers.
Table 5. Household assets of rice seed production farmers in the study area
|
Items
|
Contract seed production farmers (N=98)
|
Non-Contract seed production farmers (N=113)
|
Total seed production farmers(N=211)
|
|
Bricks house
|
70 (71.43%)
|
64 (56.64%)
|
134 (63.51%)
|
|
Wooden house
|
17 (17.35%)
|
39 (34.51%)
|
56 (26.54%)
|
|
Bamboo house
|
11 (11.22%)
|
10 (8.85%)
|
21 (9.95%)
|
|
Light Truck
|
37 (37.76%)
|
31 (27.43%)
|
68 (32.22%)
|
|
Internet Wi-Fi
|
31 (31.63%)
|
55 (48.67%)
|
86 (40.76%)
|
|
Electricity
|
95 (96.94%)
|
113 (100.00%)
|
207 (98.58%)
|
|
Mobilephone
|
98 (100.00%)
|
113 (100.00%)
|
210 (100.00%)
|
Note: The values in the parentheses represent percentage of sample farmers.
Cost and Return Analysis of contract and non-contract seed production farmers
A cost–return analysis was conducted on rice seed production during the 2023–2024 monsoon and summer seasons. Most farmers in the study area produced certified seeds of Ayeyarmin, Sinthukha, Manawthukha, 90-day, and Shwethweyin varieties. Table 6 reports average yields, market prices, and gross benefits for contract and non-contract seed producers across both seasons. The average monsoon-season yield was 4,646 kg/ha for contract farmers and 4,487 kg/ha for non-contract farmers—a difference that was statistically significant at the 1% level (p < 0.01). In contrast, summer-season yields did not differ significantly: 5,873 kg/ha for contract farmers versus 5,837 kg/ha for non-contract farmers.
Average certified seed prices received by non-contract farmers were significantly higher than those obtained by contract farmers, as non-contract farmers could sell directly on the open market. Contract farmers, bound by guaranteed prices stipulated in their agreements, received an average of US$0.73/kg for monsoon rice seed and US$0.53/kg for summer rice seed. Non-contract farmers received US$0.81/kg and US$0.57/kg, respectively. Consequently, gross benefits (revenue per acre) were significantly higher for non-contract farmers. However, it should be noted that not all non-contract farmers realized high prices; there was substantial variability between the minimum and maximum prices they obtained.
Table 6. Yield, market price, gross benefit of contract and non-contract rice seed production farmers in the study area (2023-2024 Monsoon and summer rice)
|
Items
|
Unit
|
Contract seed production farmers (N=89)
|
SD
|
Non-contract seed production farmers (N=103)
|
SD
|
t-test
|
|
Yield/ha (monsoon rice)
|
kg/ha
|
4,646
(4,227-5,155)
|
211.86
|
4,487
(4,124-5,155)
|
261.05
|
0.00***
|
|
Market price
(monsoon rice)
|
US$/kg
|
0.73
(0.68-0.75)
|
0.02
|
0.81
(0.67-1.03)
|
0.09
|
0.00***
|
|
Gross Benefit
(Monsoon rice)
|
US$/ha
|
3,376
(2,991-3689)
|
175.13
|
3,618
(2,915-5,217)
|
440.34
|
0.00***
|
|
Yield/ha (Summer rice)
|
kg/ha
|
5,873
(5,155-6,598)
|
310.84
|
5,837
(5,000-6,701)
|
392.08
|
0.51ns
|
|
Market price (Summer rice)
|
US$/kg
|
0.53
(0.50-0.57)
|
0.03
|
0.57
(0.43-0.77)
|
0.08
|
0.00***
|
|
Gross Benefit (Summer rice)
|
US$/ha
|
3,100
(2,718-3,530)
|
224.06
|
3,314
(2,382-4,571)
|
516.22
|
0.00***
|
1 USD = 2100 MMK (Central Bank of Myanmar, Date- 30/11/2024)
Note: The values in the parentheses represent range *** are significant differences at 1% level and ns is not significant differences.
Figures 3 and 4 compare the seed production costs incurred by contract and non-contract rice seed producer farmers. The costs associated with family labor, hired labor, and total material inputs were significantly higher for non-contract farmers compared to their contract counterparts. This finding aligns with previous research, which highlighted that post-harvest storage costs—incurred during the 7–8 months between harvest and the subsequent planting season—constitute a substantial portion of total seed production expenses (Win et al., 2023).
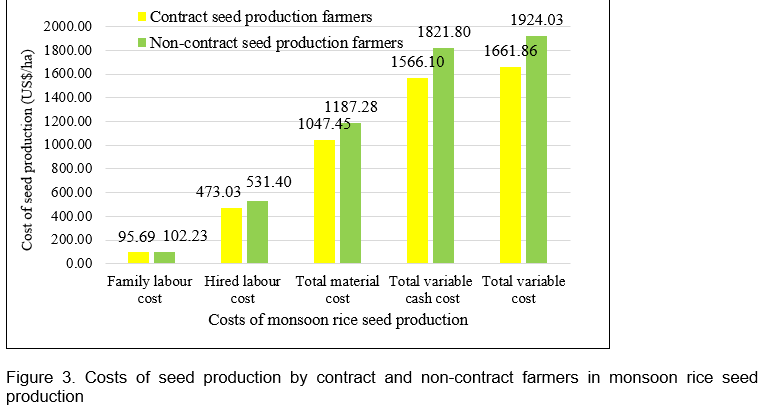
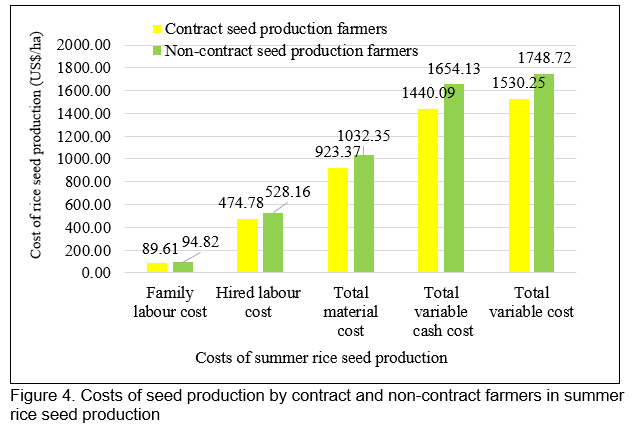
Table 7 presents the enterprise budget analysis for contract and non-contract seed production farmers engaged in monsoon rice seed production during the 2023–2024 season. The break-even yield for contract seed producers was 2,287 kg/ha, while for non-contract seed producers it was slightly higher at 2,372 kg/ha. Similarly, the break-even price was 0.36 US$/kg for contract farmers and 0.43 US$/kg for non-contract farmers, indicating that both the break-even yield and price were higher for non-contract producers. In terms of profitability, the return per unit of cash cost was 2.16 for contract farmers and 2.00 for non-contract farmers. The return on capital invested, measured by the benefit-cost ratio (BCR), was 2.04 for contract farmers and 1.89 for non-contract farmers. These differences in BCR were statistically significant at the 99% confidence level, suggesting that contract seed production was relatively more profitable under the study conditions.
Table 7. Enterprise budget of contract and non-contract rice seed production farmers in the study area (2023-2024 monsoon rice)
|
Items
|
Unit
|
Contract seed production farmers (N=89)
|
SD
|
Non-Contract seed production farmers (N=103)
|
SD
|
t-test
|
|
RAVCC
|
US$/ha
|
1,810
(1,504-2,159)
|
141.37
|
1,796
(998-2,900)
|
316.60
|
0.69ns
|
|
RAVC
|
US$/ha
|
1714
(1,380-2,048)
|
137.01
|
1,694
(892-2,785)
|
318.13
|
0.56ns
|
|
RPCC
|
|
2.16
(1.92-2.46)
|
0.12
|
2.00
(1.50-2.55)
|
0.21
|
0.00***
|
|
BCR
|
|
2.04
(1.81-2.32)
|
0.11
|
1.89
(1.43-2.42)
|
0.19
|
0.00***
|
|
Break-even yield
|
kg/ha
|
2,287
(2,000-2,704)
|
141.42
|
2,372
(1,979-3,098)
|
266.51
|
0.00***
|
|
Break-even price
|
US$/kg
|
0.36
(0.31-0.40)
|
0.02
|
0.43
(0.30-0.57)
|
0.05
|
0.00***
|
1 USD = 2,100 MMK (Central Bank of Myanmar, Date- 30/11/2024)
Note: The values in the parentheses represent range. *** are significant differences at 1% level and ns is not significant differences.
Where: RAVC= Return above variable cash cost
RAVC= Return above variable cost
RPCC = Return per unit of cash cost
BCR = Benefit-cost ratio (Return per unit of capital)
Table 8 presents the enterprise budget for contract and non-contract farmers engaged in summer rice seed production. Similar to the monsoon season, returns above variable cash costs and total variable costs did not differ significantly between the two groups. The break-even yield was 2,903 kg/ha for contract farmers and 3,110 kg/ha for non-contract farmers. The break-even price of summer rice seed was 0.26 US$/kg for contract seed producers and 0.30 US$/kg for non-contract producers. Consistent with monsoon rice seed production, the average break-even yield and break-even price were higher for non-contract farmers compared to contract farmers. The return per unit of cash cost was 2.16 for contract seed producers and 2.01 for non-contract seed producers. The benefit-cost ratio (BCR) was 2.03 for contract farmers and 1.90 for non-contract farmers. These differences were statistically significant at the 99% confidence level, confirming similar profitability trends in the summer season.
Table 8. Enterprise budget of rice seed production farmers in the study area (2023-2024 summer rice)
|
Items
|
Unit
|
Contract seed production farmers (N=75)
|
SD
|
Non-Contract seed production farmers (N=98)
|
SD
|
t-test
|
|
RAVCC
|
US$/ha
|
1,660
(1,203-2,164)
|
207.20
|
1,660
(1,000-2,824)
|
405.80
|
0.99ns
|
|
RAVC
|
US$/ha
|
1,570
(1,097-2,086)
|
208.86
|
1,565
(913-2,739)
|
405.12
|
0.92ns
|
|
RPUCC
|
|
2.16
(1.79-2.58)
|
0.17
|
2.01
(1.67-2.62)
|
0.23
|
0.00***
|
|
BCR
|
|
2.03
(1.68-2.45)
|
0.16
|
1.90
(1.58-2.50)
|
0.22
|
0.00***
|
|
Break-even yield
|
kg/ha
|
2,903
(2,379-3,331)
|
207.51
|
3,110
(2,376-3,607)
|
335.46
|
0.01***
|
|
Break-even price
|
US$/kg
|
0.26
(0.21-0.32)
|
0.20
|
0.30
(0.22-0.38)
|
0.03
|
0.00***
|
1 USD = 2100 MMK (Central Bank of Myanmar, Date- 30/11/2024)
Note: The values in the parentheses represent range. *** are significant differences at 1% level and ns is not significant differences.
Where: RAVC= Return above variable cash cost
RAVC= Return above variable cost
RPCC = Return per unit of cash cost
BCR = Benefit-cost ratio (Return per unit of capital)
CONCLUSION AND RECOMMENDATION
This study examines the socioeconomic conditions of contract and non-contract rice seed production farmers. Both groups exhibited similar levels of farming experience, household size, family farm labor, land ownership, and rice seed production area. However, contract seed producers had greater experience specifically in rice seed production. Non-contract seed producers tended to be younger and had a higher proportion of graduates compared to their contract counterparts.
Farm machinery and infrastructure are critical for efficient seed production, reflecting the scale and investment capacity of farmers. Both groups owned various farm and household assets. Overall, non-contract farmers appeared to possess more farm assets related to seed processing. Conversely, contract farmers often had access to facilities and services provided by seed companies.
Cost and return analyses revealed that non-contract seed producers incurred significantly higher costs, primarily due to expenses related to seed cleaning, packaging, and storage for market sales in subsequent seasons. Although non-contract farmers generally received higher average market prices for their seeds, contract seed producers achieved greater returns. This is largely because contract farmers benefited from guaranteed prices stipulated in their agreements with seed companies, eliminating the need to seek buyers independently.
In contrast, non-contract farmers sold their seeds on the open market, where prices were variable and not always favorable. As a result, the benefit-cost ratio (BCR) among non-contract farmers was inconsistent, with some achieving high profitability while others experienced lower returns due to wide disparities in capital investment.
In conclusion, contract seed producers were more profitable than non-contract producers. Contract farming in rice seed production demonstrated multiple strengths but also presented potential weaknesses, opportunities, and threats for local farmers. Therefore, a subsequent study focusing on a SWOT analysis of contract farming in the study area is recommended.
The findings underscore the profitability of seed production involving private sector participation, indicating a positive role for seed companies in supporting local farmers. This insight motivates further research into factors influencing farmer participation in contract farming systems for rice seed production.
To improve outcomes for non-contract farmers, it is essential to provide guaranteed market prices, marketing information, and access to marketing platforms through public sector support. Public sector involvement remains crucial for both contract and non-contract seed producers, as it offers necessary technologies and facilitates seed company participation to advance certified rice seed production.
Encouraging contract farming practices with private sector engagement should continue, while non-contract farmers should be supported with cost-effective strategies and reliable market information. Such integrated efforts are vital for the sustainable development of certified rice seed production and the broader rice industry in Myanmar.
REFERENCES
Ashok, K. M., A. Kumar, J. K. Pramod and D. Alwin. (2016). Impact of contracts in high yielding varieties seed production on profits and yield. The case of Nepal.
Khin Sandar Lin and Cho Cho San. (2018). Gender perspective on technology adoption of rice production in Thazi Township, Myanmar. Journal of Agricultural Research, 5(2), 39-46.
Marks, D. (2022). The Contract Farming Promotion and Development Act, 2017 of Thailand: Origins and impacts to date. MRLG Thematic Study Series, 12.
Ministry of Agriculture, Livestock and Irrigation (MOALI). (2023). Department of Planning, Myanmar Agriculture Sector in Brief. Nay Pyi Taw. Myanmar.
Olson, K. (2003). Farm management principles and strategies. The textbook of farm management: Principles and strategies. Department of Applied Economics at the University of Minnesota.
Rice Division, Department of Agriculture (DOA). (2024). Seed Producing Area, Yield and Production of Rice Certified Seeds by States and Regions. Nay Pyi Taw. Myanmar.
San Kyi. (2019). Seed Sector Development in Myanmar. Seed Division, Department of Agriculture. Ministry of Agriculture, Livestock and Irrigation, Myanmar.
Seasia Stats. (2024). Rice Export Data. https://www.gnlm.com.mm/myanmar-ranks-8th-among-worlds-top-10-rice-expor....
Setboonsarng, S., P. Leung., and J. Cai. (2006). Contract farming and poverty reduction: The case of organic rice contract farming in Thailand. Poverty Strategies in Asia, 266.
Win, M. T., Maredia, M. K., and Boughton, D. (2023). Farmer demand for certified legume seeds and the viability of farmer seed enterprises: Evidence from Myanmar. Food Security, 15(2), 555-569.


The Cost and Return Analysis of Contract and Non-Contract Rice Seed Production Farmers in the Mandalay Region
ABSTRACT
Rice (Oryza sativa) plays a vital role in farmers’ livelihoods and serves as a significant source of export income for Myanmar through the sale of surplus production. The use of certified rice seed is essential for increasing rice yields, and demand for certified seeds remains high throughout the country. Certified rice seed production is carried out by the public sector, seed production farmers, and private seed companies engaging in contract farming with local farmers. Among the regions, Mandalay stands out as the leading area for rice seed production by the private sector. The objectives of this study were to assess the socioeconomic conditions of rice seed production farmers and to compare the cost and return structures of contract and non-contract seed producers within the study area. The results indicate that younger farmers were more involved as non-contract seed producers, and their educational levels were generally higher compared to contract farmers. However, contract farmers possessed significantly greater experience in rice seed production. Both groups had access to farm machinery and infrastructure; nevertheless, non-contract farmers owned more warehouses, seed cleaners, and packaging machines than contract farmers. Cost and return analyses were conducted for the 2023–2024 monsoon and summer rice seed production seasons. The average rice yield of contract farmers was significantly higher than that of non-contract farmers during the monsoon season, while no significant difference was observed between the groups in the summer season. In both seasons, the average market price for certified rice seed was higher among non-contract farmers. However, seed production costs were significantly greater for non-contract farmers, primarily because they managed seed storage, cleaning, and packaging independently to access the market. In contrast, contract farmers had these processes handled by seed companies, as seeds were sold directly to the companies immediately after harvest under the terms of the contract. Contract farmers achieved a significantly higher benefit-cost ratio (BCR) than non-contract farmers during the study years. In conclusion, contract farming practices with private sector involvement should be further promoted, while the public sector should support non-contract farmers through cost-effective strategies and improved market information to foster the development of certified rice seed production and the overall rice industry.
Keywords: Certified rice seeds, Contract and non-contract seed production farmers, Cost and Return Analysis
INTRODUCTION
In Myanmar, rice is cultivated during both the monsoon and summer seasons, with the latter relying on irrigated water sources. According to the National Plan for 2022–2023, the total rice cultivation area amounted to 7.14 million hectares, comprising 6.07 million hectares of monsoon rice and 1.07 million hectares of summer rice. The average yield was 3.95 metric tons per hectare, resulting in a total production of approximately 27.98 million metric tons. During the same period, Myanmar exported over 1.22 million metric tons of rice (MOALI, 2023). In the current context, Myanmar is emerging as a significant player in the international rice trade. Among the top ten rice-exporting countries worldwide, Myanmar ranked 8th in the 2023–2024 (Seasia Stats, 2024). The country contributes to the global market by supplying affordable white rice and parboiled rice. Domestically, Myanmar cultivates a wide range of rice varieties. The top ten monsoon rice varieties include Sinthukha, Manawthukha, Ayeyarmin, Pawsanyin, Sinakayi-3, Meedone, Shwewarrtun, Hnann Karr, Sinthwelatt, and Yadanartoe. For summer cultivation, the leading varieties are Theehtetyinn, 90 Days, Sinthukha, Manawthukha, Yadanartoe, Pakhanshwewar, Shwethweyin, Supernankauk, Hmawbi-2, and Yezinlonethwe.
The Ministry of Agriculture, Livestock and Irrigation (MOALI) actively promotes the development of the seed industry by encouraging the participation of seed grower associations, private companies, and collaborating farmers (MOALI, 2023). The Department of Agricultural Research (DAR) is primarily responsible for producing breeder and foundation seeds of rice. In addition, private seed companies produce breeder and foundation seeds for their proprietary rice varieties. The Seed Division under the Department of Agriculture produces registered seeds on government seed farms. Seed production farmers then use these registered seeds to cultivate certified seeds on local farms for commercial distribution. Private seed companies also produce and market both registered and certified seeds, which are cultivated either on company-owned farms or through contract farming arrangements with local farmers. Contract Farming (CF) plays an increasingly important role in agricultural development across many developing countries. It refers to agricultural production conducted under a formal agreement between farmers and buyers, outlining specific conditions for production and marketing of the commodity. For private seed companies, contract farming provides a dependable supply of high-quality seeds, which is essential for meeting the rising demand for improved seed varieties. Thailand is considered one of the pioneers of contract farming in the Mekong region of Southeast Asia (Marks, 2022). Previous studies have also shown that, in general, rice farmers engaged in contract farming tend to achieve higher profits compared to those operating under non-contract arrangements (Setboonsarng et al., 2006). The national average rice yield in Myanmar stands at 3.95 metric tons per hectare (equivalent to 76.63 baskets per acre), which remains below the targeted yield of 5.15 metric tons per hectare (100 baskets per acre). Achieving higher yields is possible through the use of certified seeds of high-yielding varieties and the adoption of improved crop management practices. Studies have shown that grain yields are significantly higher when farmers utilize good-quality certified seeds. However, one of the key constraints in rice production is the limited availability of quality rice seeds, which remains a dominant factor affecting rice productivity (Khin Sandar Lin and Cho Cho San, 2018). To meet the growing demand of the rice industry, the rice seed sector in Myanmar still requires significant development, particularly in increasing the supply of certified seeds. The use of high-quality seeds is crucial for enhancing rice productivity. Previous research has highlighted contract farming with private sector involvement as a practical approach to increase seed production (Ashok et al., 2016). Currently, rice seed production is carried out by seed grower associations, private companies, and individual farmers, with growing encouragement for a private sector-led seed industry in Myanmar (San Kyi, 2019). Table 1 illustrates the total rice seed production area by seed producer farmers, as well as by the public and private sectors (Rice Division, DOA, 2024). The Mandalay Region records the largest seed production area by the private sector, totalling 1,121.41 hectares, while seed producer farmers are cultivating certified rice seeds on 2,706.60 hectares. Despite these efforts, there remains a limited number of studies in Myanmar that compares the costs and returns of contract versus non-contract seed producer farmers. Such analyses are essential to promote rice seed production and inform evidence-based policy recommendations for the development of the rice seed sector.
Table 1. Total seed-producing area by farmers, private seed companies and public sector in Myanmar (2022-2023)
No.
States and regions
Sown area (ha)
Total
Farmers
Private sector
Public sector
1
Nay Pyi Taw
180.49
925.13
0
1,105.62
2
Kachin
290.57
0
0
290.57
3
Kayah
60.70
0
0
60.70
4
Kayin
46.54
0
0
46.54
5
Chin
97.13
0
0
97.13
6
Sagaing
2,760.83
88.22
0
2,849.05
7
Tanintharyi
261.03
0
0
261.03
8
Bago
9,985.03
627.68
84.99
10,697.70
9
Magway
2,399.84
600.16
62.73
3,062.73
10
Mandalay
2,706.60
1,121.41
647.51
4,475.52
11
Mon
364.23
80.94
8.09
453.26
12
Rakhine
770.94
0
0
770.94
13
Yangon
1,477.94
0
0
1,477.94
14
Shan
530.96
101.58
37.23
669.77
15
Ayeyarwady
3,157.83
379.60
255.77
3,793.20
Total
25,090.65
3,924.72
1,096.32
30,111.69
Source: Rice Division DOA,2024
Objectives of the study
1. To observe the socioeconomic conditions of contract and non-contract certified rice seed production farmers in the study area
2. To compare the cost and return analysis of contract and non-contract rice seed production farmers in the study area.
METHODOLOGY
Study sites and sample selection for data collection
Amarapura Township and Patheingyi Township in the Mandalay Region were purposively selected as the study areas due to the high concentration of rice seed production farms located within these townships. Primary data were collected in November 2024 from both contract and non-contract rice seed production farmers through the structured questionnaires. Secondary data were obtained from official sources, including reports from the Department of Planning, Rice Division, Mandalay Region, and Township Offices of the Department of Agriculture (DOA) under the Ministry of Agriculture, Livestock and Irrigation (MOALI), as well as other relevant publications. A simple random sampling method was employed to select 211 seed production farmers in the study area. Among them, 98 contract farmers were cultivating certified rice seeds on approximately 275.72 hectares, under contractual agreements with private seed companies. In contrast, 113 non-contract farmers were producing certified rice seeds on around 325.48 hectares and were independently marketing their seeds.
Data collection and data analysis
Descriptive statistics, including mean, standard deviation, frequency, and percentage, were used to describe and compare the socioeconomic and farm characteristics of contract and non-contract seed producer farmers in the study area. Cost and return analysis was employed to estimate the expenses and benefits associated with rice seed production under both contract and non-contract farming systems. Enterprise budgeting was utilized to evaluate the costs and returns of the production process. The primary objective of enterprise budgeting is to illustrate differences in net benefits across various resource scenarios, thereby assisting in management decision-making (Olson, 2003). This analysis was applied to assess the profitability of certified rice seed production among farmers in the study area. Statistical analysis, including t-tests, was conducted using STATA software to determine the significance of differences observed between the two groups.
RESULTS AND DISCUSSION
Socioeconomic conditions of rice seed producer farmers in the study area
There is a statistically significant difference in age and education between farmers at the 99% confidence level, as indicated by the t-test results. Table 2 presents the age distribution of household heads among the sampled farms in the study area, including their frequencies and percentages. Younger farmers were more prevalent among non-contract seed producers. The average age of contract seed producer farmers was 54 years, while that of non-contract seed producers was 51 years.
Table 2. Demographic characteristics of rice seed producer farmers in the study area
Items
Contract seed production farmers (N=98)
Non-Contract seed production farmers (N=113)
Frequency
Percent
Frequency
Percent
Age group (year)
21 – 30
0
0.00
2
1.76
31 – 40
6
6.12
14
12.39
41 – 50
25
25.51
43
38.05
51 – 60
46
46.94
36
31.86
Over 60
21
21.43
18
15.93
Average Age
54.53 (35-74)
51.03 (27-78)
(t-test) 0.00***
Note: The values in the parentheses represent range. *** are significant differences at 1% level.
The education levels of household heads were categorized into four groups: primary, secondary, high school, and graduate levels. Among contract seed production farmers, the majority (55.10%) had attained secondary school education, compared to 41.59% among non-contract seed producers. No household heads were found to be illiterate. Within the contract seed producer group, 5.10% (five household heads) had attained graduate-level education. In contrast, the educational attainment was higher among non-contract seed producers, with 12.39% (fourteen household heads) holding graduate degrees. Figures 1 and 2 illustrate the distribution of education levels among contract and non-contract seed production farmers in the study area.
Table 3 presents information on household size, land ownership, rice seed production area, and farming experience of rice seed production farmers in the study area. The average household size was 4.30 for contract seed producers and 4.41 for non-contract seed producers. The average number of family laborers engaged in farming was 1.77 among contract seed producers and 2.02 among non-contract producers. In terms of farming experience, contract seed producers had an average of 28 years, while non-contract producers had 25 years; this difference was not statistically significant. Similarly, land ownership did not vary significantly between the two groups, with average farm sizes of 3.92 hectares for contract farmers and 3.59 hectares for non-contract farmers. The rice seed production areas were also comparable, averaging 2.81 hectares and 2.88 hectares, respectively. However, the average rice seed production experience was 6.22 years for contract farmers and 4.86 years for non-contract farmers, representing a statistically significant difference between the two groups at the 99% confidence level.
Table 3. Household size, land assets, seed production area and working experiences of rice seed production farmers in the study area.
Items
Unit
Contract farmers
(N=98)
Non-Contract farmers (N=113)
t-test
Average
SD
Average
SD
Household size
No.
4.30
(2-9)
1.39
4.41
(2-8)
1.18
0.52ns
Family farm labour
No.
1.77
(1-6)
0.99
2.02
(1-7)
0.96
0.06ns
Land ownership
ha
3.92
(0.40-41.28)
4.64
3.59
(0.81-28.32)
3.63
0.56ns
Average rice seed producing area
ha
2.81
(0.40-20.23)
2.35
2.88
(0.81-12.14)
2.45
0.81ns
Farming experience
Year
27.55
(4-51)
12.83
25.10
(5-55)
11.62
0.14ns
Rice seed production experience
Year
6.22
(1-15)
2.73
4.86
(1-17)
3.17
0.00***
Note: The values in the parentheses represent range. *** are significant differences at 1% level and ns is not significant differences.
Table 4 presents a comparison of farm assets between contract and non-contract rice seed production farmers. It was observed that non-contract farmers owned more physical assets such as warehouses, seed cleaners, and packaging machines compared to contract farmers. Household assets, which serve as important indicators of living standards, were also assessed in this study. These included housing materials, access to electricity, communication devices, transportation, and internet connectivity. Table 5 summarizes these findings. Brick houses were more prevalent among contract farmers (71.43%) than non-contract farmers (56.64%). Additionally, many farmers, regardless of contract status, owned light trucks for transporting agricultural products. Access to electricity, mobile phones, and internet (Wi-Fi) services was generally available among rice seed producer households.
Table 4. Farms assets of rice seed production farmers in the study area
Items
Contract seed production farmers (N=98)
Non-Contract seed production farmers (N=113)
Total seed production farmers(N=211)
Packaging machine
1 (1.02%)
6 (5.31%)
7 (3.32%)
Seed-cleaner
2 (2.04%)
7 (6.19%)
9 (4.27%)
Rice seeder
3 (3.06%)
7 (6.19%)
10 (4.74%)
Combine harvester
5 (5.10%)
11 (9.73%)
16 (7.58%)
Hand Tractor
24 (24.49%)
38 (33.63%)
63 (29.38%)
Tractor
30 (30.61%)
35 (30.97%)
65 (30.81%)
Warehouse
41 (41.84%)
63 (55.75%)
104 (49.29%)
Note: The values in the parentheses represent percentage of sample farmers.
Table 5. Household assets of rice seed production farmers in the study area
Items
Contract seed production farmers (N=98)
Non-Contract seed production farmers (N=113)
Total seed production farmers(N=211)
Bricks house
70 (71.43%)
64 (56.64%)
134 (63.51%)
Wooden house
17 (17.35%)
39 (34.51%)
56 (26.54%)
Bamboo house
11 (11.22%)
10 (8.85%)
21 (9.95%)
Light Truck
37 (37.76%)
31 (27.43%)
68 (32.22%)
Internet Wi-Fi
31 (31.63%)
55 (48.67%)
86 (40.76%)
Electricity
95 (96.94%)
113 (100.00%)
207 (98.58%)
Mobilephone
98 (100.00%)
113 (100.00%)
210 (100.00%)
Note: The values in the parentheses represent percentage of sample farmers.
Cost and Return Analysis of contract and non-contract seed production farmers
A cost–return analysis was conducted on rice seed production during the 2023–2024 monsoon and summer seasons. Most farmers in the study area produced certified seeds of Ayeyarmin, Sinthukha, Manawthukha, 90-day, and Shwethweyin varieties. Table 6 reports average yields, market prices, and gross benefits for contract and non-contract seed producers across both seasons. The average monsoon-season yield was 4,646 kg/ha for contract farmers and 4,487 kg/ha for non-contract farmers—a difference that was statistically significant at the 1% level (p < 0.01). In contrast, summer-season yields did not differ significantly: 5,873 kg/ha for contract farmers versus 5,837 kg/ha for non-contract farmers.
Average certified seed prices received by non-contract farmers were significantly higher than those obtained by contract farmers, as non-contract farmers could sell directly on the open market. Contract farmers, bound by guaranteed prices stipulated in their agreements, received an average of US$0.73/kg for monsoon rice seed and US$0.53/kg for summer rice seed. Non-contract farmers received US$0.81/kg and US$0.57/kg, respectively. Consequently, gross benefits (revenue per acre) were significantly higher for non-contract farmers. However, it should be noted that not all non-contract farmers realized high prices; there was substantial variability between the minimum and maximum prices they obtained.
Table 6. Yield, market price, gross benefit of contract and non-contract rice seed production farmers in the study area (2023-2024 Monsoon and summer rice)
Items
Unit
Contract seed production farmers (N=89)
SD
Non-contract seed production farmers (N=103)
SD
t-test
Yield/ha (monsoon rice)
kg/ha
4,646
(4,227-5,155)
211.86
4,487
(4,124-5,155)
261.05
0.00***
Market price
(monsoon rice)
US$/kg
0.73
(0.68-0.75)
0.02
0.81
(0.67-1.03)
0.09
0.00***
Gross Benefit
(Monsoon rice)
US$/ha
3,376
(2,991-3689)
175.13
3,618
(2,915-5,217)
440.34
0.00***
Yield/ha (Summer rice)
kg/ha
5,873
(5,155-6,598)
310.84
5,837
(5,000-6,701)
392.08
0.51ns
Market price (Summer rice)
US$/kg
0.53
(0.50-0.57)
0.03
0.57
(0.43-0.77)
0.08
0.00***
Gross Benefit (Summer rice)
US$/ha
3,100
(2,718-3,530)
224.06
3,314
(2,382-4,571)
516.22
0.00***
1 USD = 2100 MMK (Central Bank of Myanmar, Date- 30/11/2024)
Note: The values in the parentheses represent range *** are significant differences at 1% level and ns is not significant differences.
Figures 3 and 4 compare the seed production costs incurred by contract and non-contract rice seed producer farmers. The costs associated with family labor, hired labor, and total material inputs were significantly higher for non-contract farmers compared to their contract counterparts. This finding aligns with previous research, which highlighted that post-harvest storage costs—incurred during the 7–8 months between harvest and the subsequent planting season—constitute a substantial portion of total seed production expenses (Win et al., 2023).
Table 7 presents the enterprise budget analysis for contract and non-contract seed production farmers engaged in monsoon rice seed production during the 2023–2024 season. The break-even yield for contract seed producers was 2,287 kg/ha, while for non-contract seed producers it was slightly higher at 2,372 kg/ha. Similarly, the break-even price was 0.36 US$/kg for contract farmers and 0.43 US$/kg for non-contract farmers, indicating that both the break-even yield and price were higher for non-contract producers. In terms of profitability, the return per unit of cash cost was 2.16 for contract farmers and 2.00 for non-contract farmers. The return on capital invested, measured by the benefit-cost ratio (BCR), was 2.04 for contract farmers and 1.89 for non-contract farmers. These differences in BCR were statistically significant at the 99% confidence level, suggesting that contract seed production was relatively more profitable under the study conditions.
Table 7. Enterprise budget of contract and non-contract rice seed production farmers in the study area (2023-2024 monsoon rice)
Items
Unit
Contract seed production farmers (N=89)
SD
Non-Contract seed production farmers (N=103)
SD
t-test
RAVCC
US$/ha
1,810
(1,504-2,159)
141.37
1,796
(998-2,900)
316.60
0.69ns
RAVC
US$/ha
1714
(1,380-2,048)
137.01
1,694
(892-2,785)
318.13
0.56ns
RPCC
2.16
(1.92-2.46)
0.12
2.00
(1.50-2.55)
0.21
0.00***
BCR
2.04
(1.81-2.32)
0.11
1.89
(1.43-2.42)
0.19
0.00***
Break-even yield
kg/ha
2,287
(2,000-2,704)
141.42
2,372
(1,979-3,098)
266.51
0.00***
Break-even price
US$/kg
0.36
(0.31-0.40)
0.02
0.43
(0.30-0.57)
0.05
0.00***
1 USD = 2,100 MMK (Central Bank of Myanmar, Date- 30/11/2024)
Note: The values in the parentheses represent range. *** are significant differences at 1% level and ns is not significant differences.
Where: RAVC= Return above variable cash cost
RAVC= Return above variable cost
RPCC = Return per unit of cash cost
BCR = Benefit-cost ratio (Return per unit of capital)
Table 8 presents the enterprise budget for contract and non-contract farmers engaged in summer rice seed production. Similar to the monsoon season, returns above variable cash costs and total variable costs did not differ significantly between the two groups. The break-even yield was 2,903 kg/ha for contract farmers and 3,110 kg/ha for non-contract farmers. The break-even price of summer rice seed was 0.26 US$/kg for contract seed producers and 0.30 US$/kg for non-contract producers. Consistent with monsoon rice seed production, the average break-even yield and break-even price were higher for non-contract farmers compared to contract farmers. The return per unit of cash cost was 2.16 for contract seed producers and 2.01 for non-contract seed producers. The benefit-cost ratio (BCR) was 2.03 for contract farmers and 1.90 for non-contract farmers. These differences were statistically significant at the 99% confidence level, confirming similar profitability trends in the summer season.
Table 8. Enterprise budget of rice seed production farmers in the study area (2023-2024 summer rice)
Items
Unit
Contract seed production farmers (N=75)
SD
Non-Contract seed production farmers (N=98)
SD
t-test
RAVCC
US$/ha
1,660
(1,203-2,164)
207.20
1,660
(1,000-2,824)
405.80
0.99ns
RAVC
US$/ha
1,570
(1,097-2,086)
208.86
1,565
(913-2,739)
405.12
0.92ns
RPUCC
2.16
(1.79-2.58)
0.17
2.01
(1.67-2.62)
0.23
0.00***
BCR
2.03
(1.68-2.45)
0.16
1.90
(1.58-2.50)
0.22
0.00***
Break-even yield
kg/ha
2,903
(2,379-3,331)
207.51
3,110
(2,376-3,607)
335.46
0.01***
Break-even price
US$/kg
0.26
(0.21-0.32)
0.20
0.30
(0.22-0.38)
0.03
0.00***
1 USD = 2100 MMK (Central Bank of Myanmar, Date- 30/11/2024)
Note: The values in the parentheses represent range. *** are significant differences at 1% level and ns is not significant differences.
Where: RAVC= Return above variable cash cost
RAVC= Return above variable cost
RPCC = Return per unit of cash cost
BCR = Benefit-cost ratio (Return per unit of capital)
CONCLUSION AND RECOMMENDATION
This study examines the socioeconomic conditions of contract and non-contract rice seed production farmers. Both groups exhibited similar levels of farming experience, household size, family farm labor, land ownership, and rice seed production area. However, contract seed producers had greater experience specifically in rice seed production. Non-contract seed producers tended to be younger and had a higher proportion of graduates compared to their contract counterparts.
Farm machinery and infrastructure are critical for efficient seed production, reflecting the scale and investment capacity of farmers. Both groups owned various farm and household assets. Overall, non-contract farmers appeared to possess more farm assets related to seed processing. Conversely, contract farmers often had access to facilities and services provided by seed companies.
Cost and return analyses revealed that non-contract seed producers incurred significantly higher costs, primarily due to expenses related to seed cleaning, packaging, and storage for market sales in subsequent seasons. Although non-contract farmers generally received higher average market prices for their seeds, contract seed producers achieved greater returns. This is largely because contract farmers benefited from guaranteed prices stipulated in their agreements with seed companies, eliminating the need to seek buyers independently.
In contrast, non-contract farmers sold their seeds on the open market, where prices were variable and not always favorable. As a result, the benefit-cost ratio (BCR) among non-contract farmers was inconsistent, with some achieving high profitability while others experienced lower returns due to wide disparities in capital investment.
In conclusion, contract seed producers were more profitable than non-contract producers. Contract farming in rice seed production demonstrated multiple strengths but also presented potential weaknesses, opportunities, and threats for local farmers. Therefore, a subsequent study focusing on a SWOT analysis of contract farming in the study area is recommended.
The findings underscore the profitability of seed production involving private sector participation, indicating a positive role for seed companies in supporting local farmers. This insight motivates further research into factors influencing farmer participation in contract farming systems for rice seed production.
To improve outcomes for non-contract farmers, it is essential to provide guaranteed market prices, marketing information, and access to marketing platforms through public sector support. Public sector involvement remains crucial for both contract and non-contract seed producers, as it offers necessary technologies and facilitates seed company participation to advance certified rice seed production.
Encouraging contract farming practices with private sector engagement should continue, while non-contract farmers should be supported with cost-effective strategies and reliable market information. Such integrated efforts are vital for the sustainable development of certified rice seed production and the broader rice industry in Myanmar.
REFERENCES
Ashok, K. M., A. Kumar, J. K. Pramod and D. Alwin. (2016). Impact of contracts in high yielding varieties seed production on profits and yield. The case of Nepal.
Khin Sandar Lin and Cho Cho San. (2018). Gender perspective on technology adoption of rice production in Thazi Township, Myanmar. Journal of Agricultural Research, 5(2), 39-46.
Marks, D. (2022). The Contract Farming Promotion and Development Act, 2017 of Thailand: Origins and impacts to date. MRLG Thematic Study Series, 12.
Ministry of Agriculture, Livestock and Irrigation (MOALI). (2023). Department of Planning, Myanmar Agriculture Sector in Brief. Nay Pyi Taw. Myanmar.
Olson, K. (2003). Farm management principles and strategies. The textbook of farm management: Principles and strategies. Department of Applied Economics at the University of Minnesota.
Rice Division, Department of Agriculture (DOA). (2024). Seed Producing Area, Yield and Production of Rice Certified Seeds by States and Regions. Nay Pyi Taw. Myanmar.
San Kyi. (2019). Seed Sector Development in Myanmar. Seed Division, Department of Agriculture. Ministry of Agriculture, Livestock and Irrigation, Myanmar.
Seasia Stats. (2024). Rice Export Data. https://www.gnlm.com.mm/myanmar-ranks-8th-among-worlds-top-10-rice-expor....
Setboonsarng, S., P. Leung., and J. Cai. (2006). Contract farming and poverty reduction: The case of organic rice contract farming in Thailand. Poverty Strategies in Asia, 266.
Win, M. T., Maredia, M. K., and Boughton, D. (2023). Farmer demand for certified legume seeds and the viability of farmer seed enterprises: Evidence from Myanmar. Food Security, 15(2), 555-569.