Toshiyuki Kako
Kibi International University
e-mail: kako@kobe-u.ac.jp
ABSTRACT
Japan has been pushing forward trade liberalization, and the country’s average tariff rate is at 4.9%, which is low by international standard. Agricultural imports increased rapidly with a reduction of tariff rate, appreciation of yen, and increase in income. Japan has been the biggest net importer of agricultural products in the world since 1984, and food self-sufficiency ratio has kept declining to 39% in 2011. Since rice supplies about 60% of Japan's food self-sufficiency ratio, it is important to maintain high self-sufficiency rate of rice for Japan's food security. Under the progress of globalization and trade liberalization, it is important to promote structural improvement, and establish rice farming structure in which rice farmers with more than 5 ha of rice production produce majority of rice output. At the same time, it is desirable to maintain and strengthen Income Support Direct Payment program so that large scale rice growers can get stable farm income.
INTRODUCTION
Food, energy and military security are three important elements of any national existence. Japan, Korea, and Taiwan are facing difficult agricultural problems as well as food security problems. These problems are related to the rapid industrialization characterized by unbalanced growth between the manufacturing and agricultural sectors. Comparative disadvantage of the agricultural sector is a common characteristic of Japan, Korea, and Taiwan. Agricultural sector in these countries are characterized by low land-labor ratio and small-scale and scattered landholding system. Wage rates and farmland prices had increased in the process of rapid economic development. Agricultural production costs of these countries are relatively high because of high land price, high wage rate and small scale farming. There are big differences in agricultural production cost between these countries and major agricultural exporting countries which are endowed with large farmland. Food self-sufficiency ratio of these countries had declined as imports of agricultural products increased under the progress of globalization and free trade.
Key words: Food Self-Sufficiency Ratio, MA Rice Import, Rice Policy, TPP
As food self-sufficiency ratio declines, people’s concern for food security has increased in Japan. How to maintain food security and vigorous rural areas are the issues and challenges facing globalization and free trade. One of the important questions is how to combine tariff and direct payment in order to maintain food security and vigorous rural areas under the progress of globalization.
In this article, the following topics related to agricultural trade liberalization, rice farming, and food self-sufficiency ratio will be discussed. The period of analysis is the 20 years from 1990 to 2010, in which globalization got into full swing.
1) Summarize major changes in the agriculture sector.
2) Review the process of trade liberalization of agricultural products.
3) Examine recent policy measures related to rice economy.
4) Summarize the development of Japonica rice production in Heilongjiang province in China.
5) Consider the possible impact of Trans-Pacific Partnership Agreement on the rice economy and food self-sufficiency ratio of Japan.
Position of Agriculture in the National Economy
Position of agricultural sector in the national economy has declined in the process of economic development over the last 20 years in Japan. The share of the Gross Agricultural Product within Gross Domestic Product declined gradually, from 1.8% in 1990 to 0.9% in 2010. The proportion of agricultural labor force within the total labor force declined from 6.2% in 1990 to 3.4% in 2010. The percentage of labor force, older than 65 years old, engaged in farming increased from 33.1% to 60.6%. Arable land area decreased by 12% , from 5.24 million ha to 4.59 million ha during the same period. These figures tell us that agricultural input, as well as agricultural output decreased largely, and that small-scale farming managed by old farmers had increased during the past 20 years.
Imports of agricultural products increased to supplement the contraction of domestic agricultural production. Imports of agricultural products increased by 90%, from US$28.9 billion to US$55.0 billion during the 20 years. Meanwhile, agricultural exports stayed at low level, - US$3 billion in 2010.
Although the position of the agricultural sector in the national economy fell greatly, total domestic production of agricultural and food industries was recorded at US$1.02 trillion in 2009, which accounted for 11% of all industries, forming one of the major industrial fields in the Japanese economy.
Worsening of Terms of Trade in the agricultural sector
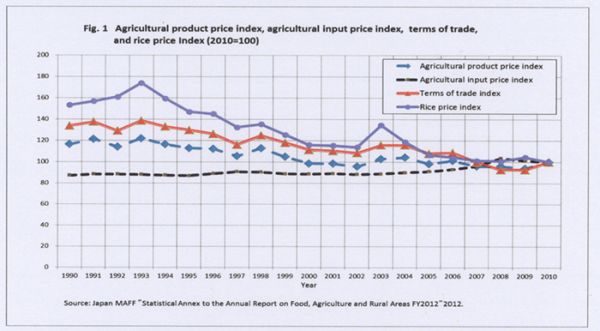
Terms of Trade index of agriculture sector, which is calculated as a ratio of farm product synthesis price index and agricultural production material synthesis price index, declined by 29% during the period 1990~2010 (Fig.1).The fall of Terms of Trade index of the agricultural sector was caused by a fall of 14% of the farm products synthesis price index and a rise of 15% of the agricultural production material synthesis price index during the 20 years. For agricultural management, this fall of Terms of Trade index means that the sale price of farm products fell against the purchase price of agricultural production material. As a result, agricultural production income fell by 41% during the past 20 years.
The budget of the Ministry of Agriculture, Forestry and Fisheries also decreased by 24% from ¥2,519 billion in 1990 to ¥1,902 billion in 2010, and agricultural protection by financial incentives also decreased. With this, the size of the Japanese agriculture sector reduced under the WTO system which started in 1995.
There were differences in the extent of the contraction among different areas of the agricultural sector. Reduction of the production value of the rice sector stood out in comparison with that of the livestock and vegetables sectors. Production value of the past livestock and vegetable sectors decreased by 18%, and 13%, respectively during the past 20 years. Meanwhile, production value of the rice sector had a staggering 51% decline. Rice production value decreased due to the decline in the price of rice and the reduction of rice consumption which was caused by income increase and changes in the dietary habit.
Reduction of farmland and total planted area
The non-agricultural sectors have increased the demand for land and have, more competitively competed for land use with the agricultural sector. Higher returns for land from non-agricultural use relative to agricultural use have increased the transfer of farmland to non-agricultural use. At the same time the amount of abandoned farmland increased because of aging and the resulting shortage of agricultural labor force, low profitability of farming, and the rice diversion program. Total farmland area has decreased by 12.4%, from 5.24 million ha in 1990 to 4.59 million ha in 2010. There was 400,000 ha of abandoned farmland in 2010.
The farmland utilization ratio has also declined over time, from 102% in 1990 to 92% in 2010. The combined result of these changes is a 21% reduction in the total planted area, from 5.35 million ha in 1990 to 4.23 million ha in 2010:
Changes in average operation size per farm household by category
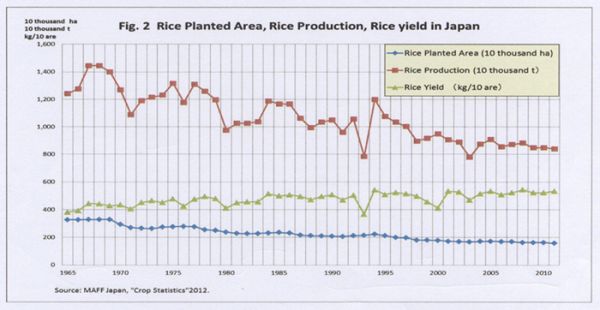
Big differences also were evident in the expansion of the average operation size per farm households by category of farming. In the case of processing type livestock farming, which relies heavily on imported feeds, operation size has expanded rather easily. Average operation size for milk cows, beef cattle, and pigs per farm household increased 2.15 times, 3.35 times, and 5.28 times, respectively over 20 years from 1990 to 2010. On the other hand, the expansion of farm size of land intensive farming was rather slow because the augmentation of farm size needs a transfer of ownership right or tenant right of the farmland. The average operation size for rice increased 1.46 times from 0.72 ha to 1.05 ha during the same period. The rice diversion program has been carried out since 1970, and total rice planted area has been declining until today (Fig 2). This is one of the reasons for the slow expansion of the average amount of rice production per farm.
The scale of transfer of utilization rights and ownership rights of farmland has not been large enough to increase the number of large-scale farms. Although the tendency toward large-scale farms with more than 5 hectares of farmland is slowly increasing, the average farm size remains small at only 1.96 ha in 2010.
Average rice planted area per farm increased by 46%, from 0.72 ha in 1990 to 1.05 ha in 2010. In recent years, agricultural earnings and farm gross income of rice farming are also sluggish. Upbringing of large-scale rice farm management has been an important policy concern for a long time. As for the management form, there are family farms, community-based farm cooperatives, and incorporation management. Although the number of community-based farm cooperatives, and incorporation management has been increasing recently, the absolute number of family farm management is still the largest. The number of community-based farm cooperatives has increased mainly in the Tohoku and Kyushu regions, since 2005. The number came to 14,643 in 2011.The number of legal agricultural production persons, using farmlands for their own farming needs has been persistently increasing. After the revised Agricultural Land Act took effect, 404 corporations entered agricultural production between December 2009 and March 2011.
Increase in the proportion of aging farm labor force
In the process of rapid economic growth, the labor absorption power of the industrial sector strengthened and drew a large amount of labor force from the agricultural sector. Many young farm household members found jobs in no-agricultural sectors almost as soon as they graduated from high school or college. The number of new school graduates entering agriculture was 1,800 in 1990, and this number kept declining and fell to 1,600 in 2010. The result is a shrinking farming population and an increase in the proportion of aging farm labor. Japan’s agricultural labor force was 2.61 million in 2010, down from 4.82 million in 1990. The proportion of agricultural labor force 65 years old and over rose from 33.1% in 1990 to 61.6% in 2011. Average age of farmers was 65.8 in 2010. The continuing outflow of the agricultural labor force and the decreasing number of newcomers to agriculture have caused a shortage of young labor equipped with good management and farming skills, thus further weakening the competitive power of the agricultural sector. As a new tendency, the numbers of employed agricultural workers, who are employed regularly by the legal agricultural producers, have been increasing recently. It increased to 5,100 in 2009.
Trends of Agricultural Trade
Outline of agricultural trade and food self-sufficiency ratio
Japan's trade balance was in surplus throughout the 1990~2010 periods, mainly due to the increase in exports of manufacturing goods. Foreign currency reserves increased, and the foreign exchange rate of the yen against the dollar appreciated by more than 30%, during the 20 past years. Imports of agricultural products, which became cheaper in comparison with domestically produced agricultural products, increased partly due to the appreciation of the Yen.
Japan has been the world largest net importer of agricultural products since 1984. Japan imported US$50.5 billion of agricultural products from USA, ASEAN, EU, China, and Australia in 2009. On the other hand, exports of agricultural products were US$3.0 billion. Annual net imports of agricultural products were US$47.4 billion in 2009. Japan’s agricultural imports comprised a significant portion of the world agricultural trade; 17.0% of maize, 15.0% of banana, 10.5% of pork, 4.8% of soybeans in 2009. Japan’s import value of maize, pork, and chicken were the largest in the world and soybeans was the second, beef was the fourth, and wheat was the fifth in the world.
On the other hand, exports of Japan’s agricultural products remained stagnant for the last 10 years, mainly because of high prices due partly to the high production cost and appreciation of the Yen. Agricultural exports in 2009 were US$3 billion, which is similar to the level of exports in 2001. Rice export was 2,202 ton, and export value was ¥7.3 million in 2012.
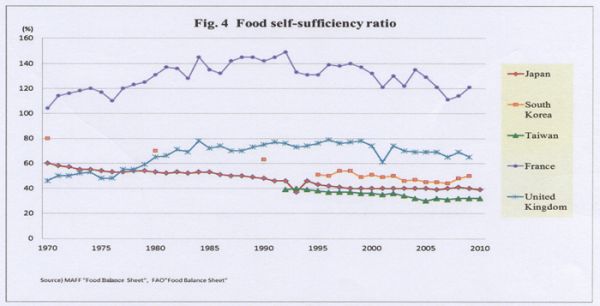
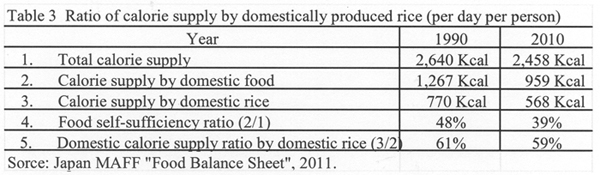
Food self-sufficiency ratio of Japan had declined from 48% in 1990 to 39% in 2010, as shown in Fig 4. This is the lowest level among countries with population of more than 100 million, and the majority of Japanese consider that this to be too low. According to the result of the public-opinion poll carried out in 2010 by the Cabinet Office of Japan, 90.3% of the respondents felt that it is better to produce food domestically with continuous effort to reduce production costs, even though domestically produced food prices are to some extent higher than international food prices. In contrast, only 5.4% of the respondents answered that it is better to import foods if they are cheaper. (Cabinet office of Japan, 2010)
MA rice import based on the GATT・UR agricultural agreement
Rice trade was under the control of the government, and rice was not imported except in time of rice shortages due to bad crops until 1994. However, due to the GATT・ UR agricultural agreement of 1993, a special exception measure of tariffication was applied to Japan's rice. As a compensation for the special exception measure of tariffication, Minimum Access rice (hereafter MA rice for short) import was decided to increase from 4% of domestic rice consumption in 1995, to 8% in 2000.
Since Japan takes the State Trading regime, in which the Government imports rice unitarily, the full quantity of MA rice was imported as an obligation. Although MA rice was imported without any import tax, Government collected margin, and sold MA rice domestically by topping a markup of ¥292 per 1 kg on the imported rice price.
The SBS (simultaneous buy and sell) import formula was introduced in one part of MA rice. 100,000 metric tons of rice was imported as SBS rice, and 667,000 metric tons of rice was imported as MA general rice. SBS rice was sold for staple foods, and MA general rice was sold for processing, food aid, and feed use.
The Japanese government changed the rice import method from the tariffication special exception measure to the tariffication measure from 1999. After the switchover from the tariffication special exception measure to the tariffication measure, fixed amount of MA rice i.e. 767,000 metric tons of brown rice was imported every year. Since there was a large difference between domestic rice price and international rice price, a specific tax of 341 yen per 1 kg was imposed on imported rice except MA rice. Since this tax is very high, which is equal to 778% in ad valorem tax, only around 100 tons of rice was imported per year.
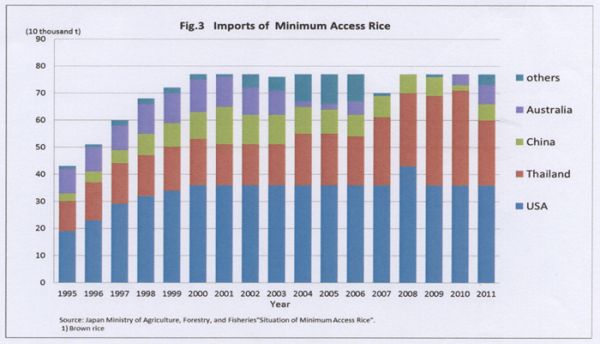
Figure 3 shows the trend of MA rice import quantity since 1995. Considering MA general import rice, the selling price of US milled medium grain rice in the domestic market was 66% lower than the retail price of rice produced in Japan. Although the retail price of SBS rice has been increasing since 2000, it is still 40~50% lower than the price of domestically produced rice in 2007.
12.42 million tons of MA rice was imported during the period from April 1995 to March 2013. The share of MA rice by country compared to total Japanese MA rice imports during the 16 years from 1955 to 2011 is as follows; USA has the largest share of 44~56%, and Thailand has the second largest share of 20~46%. Thailand has increased its share since 2007 and it was 46% in 2010.
MA rice has been sold mainly for non-staple rice use, so that MA rice creates as few adverse effects on domestic rice as possible. The sale breakdown is 1.25 million metric tons for staple foods, 4.0 million tons for processing, 0.2 million tons for glutinous rice, 2.94 million tons for food aid, 3.0 million tons for feed, and 0.87 million tons for inventory.
The buying and selling losses and storage fees of MA rice have accumulated, and the financial loss of ¥133.6 billion occurred during the period from April, 1995 to October, 2007 (Japan MAFF, 2009).
The SBS rice import quota was 100,000 tons. SBS rice import decreased sharply in 2010 to 37,000 tons due to the introduction of "Rice Traceability Low" in Japan. Conservation of transaction record has been obligatory from October 2010. It also became an obligation to transmit production place information to consumers from July 2011. Japanese consumers tend to prefer domestic rice, and demand for imported SBS rice has decreased.
However, the East Japan great earthquake disaster and accident at the Fukushima nuclear power generation which occurred in 2011 lead to contamination of agricultural products, including rice, by radioactive cesium. This became a big issue. It was difficult to collect safe domestic rice. Again on this account SBS rice import was restored to the 100,000 ton level in 2011.
When we look at SBS import share by country, the Chinese share was largest. The share was within the range of 60% to a little over 70%. In 2010 rice imported from China decreased sharply due to the influence of the Rice Traceability Low (Shoichi Ito. 2013).
The shares of SBS rice imported by country in 2012 were: USA 41%, China 28%, Australia 24%, Thailand 5%, and others 2%. Characteristics of recent SBS rice import are the increase in the share of Australian rice in 2011, 2012, and the decrease in the Chinese rice share.
Rice producer's price in Japan had traced a declining trend since 1999, due to the influence of MA rice import and decrease in rice consumption, except in 2003 when the rice price soared because of bad crop, as shown in Figure 1. Rice income per 10 followed a declining trend except for 2003, and the declining rate has increased since 2004.
There were requests and negotiations to reduce Japan's high tariff rate of 778% in the WTO Doha round, that began in 2000. Since the Doha round negotiations ended in failure, the same tariff rate of rice is still being maintained.
Japan concluded, signed or completed negotiations on Economic Partnership Agreements (EPA) with 13 countries/regions. Rice was treated as a sensitive commodity in all of the EPA, and the 778% tariff rate is maintained for rice. However, in TPP negotiation, in which Japan started to participate in negotiation from July 2013, some member countries such as USA and Australia have exported SBS rice to Japan. It is entrusted to future TPP negotiations, as to whether Japan can maintain the current tariff rate or not. The consequences of negotiation will greatly influence the future of Japanese rice farming.
Major Policies Related to Rice Farming
The Basic Law on Food, Agriculture, and Rural Areas, which is considered to be the constitution in the field of agriculture, was enacted in 1999. The objective of this Law is to stabilize and improve people's lifestyle and to develop the national economy through comprehensively and systematically implementing policies on food, agriculture and rural areas. Basic ideas of four measures are:
-
Secure stable supply of good quality food at reasonable prices;
-
Sustainable development of agriculture by securing agricultural facilities including the necessary farmlands and irrigation/drainage as well as the workforce;
-
Fulfillment of multifunctional roles such as the conservation of national land and water resources, and the natural environment;
-
Development of rural areas such as the formation of a good landscape and maintenance of cultural traditions.
Major goals of Basic Law on Food, Agriculture, and Rural Areas are to strengthen the competitiveness of the agricultural sector, and to increase calorie self-sufficiency ratio to 50% by 2020, and to increase scale and efficiency of farms in order to help them survive and provide a greater share of Japan’s need.
The Government shall establish a basic plan for food, agriculture and rural area for the promotion of the comprehensive and systematic implementation of policies on food, agriculture and rural areas. The basic plan shall be reviewed every five years. The target for the food self-sufficiency ratio shall be established in view of improving the ratio.
WTO Doha round negotiation begun in 2000, and reduction of the tariff rate of agricultural commodity was on the agenda. Basic Plan on Food, Agriculture, and Rural Areas in 2000, concentrated measures on establishing efficient and stable farm management in which main agriculture workers can earn a lifetime income on the equivalent level of a person who works in other industry. It was aimed to establish an agricultural structure in which the farm management takes a considerable part of total agricultural production.
The Basic Plan on Food, Agriculture and Rural Areas 2000 set up a specific target of 45% for the food self-sufficiency ratio to be achieved by 2010. This target was expected to have been achieved based on efforts of related parties including producers, consumers, and food industries. However, agriculture and rural areas faced tough conditions including a substantial decline in agricultural income and serious shortages of motivated farmers. The Japanese agricultural sector and related industries could not fully meet the needs of consumers and the food industry. The food self-sufficiency ratio has stayed at 40 % during the period 1999-2005.
Direct Payment Program for Paddy-and Upland-Field Farming
On the basis of the failure in achieving the target, the New Basic Plan on Food, Agriculture and Rural Areas was enacted in 2005, and set up a new target for raising the food self-sufficiency ratio to 45% by 2015. As an attempt to achieve this policy goal, the Food Self-Sufficiency Ratio Improvement Council was established in 2005, and has formulated action plans to steadily improve the food self-sufficiency ratio.
Rice production costs per 10 are have declined by 18% from 1998 to 2007 while, producer's rice price index declined by 25% during the same period. Decreasing rice output is added to collapse the producer's income from rice production. As a result farm income decreased by one-third during the ten years. However, there was no support program to compensate for a large part of the loss. As a countermeasure to such situation, the Direct Payment Program for Paddy-and Upland-Field Farming was introduced in 2007. The major objective of this program is to establish a strong agricultural structure, which can bear international competition under the WTO regime. Policy measures are concentrated on certified individual farm management with more than or equal to 4 ha of farm size, and community-based agricultural cooperatives with more than or equal to 20 ha of farm size. This program aimed to strengthen farm management of land use type agriculture such as rice, wheat and soybeans. Subsidy was paid to compensate for the differential of production conditions with foreign countries, and to reduce the influence of income reduction.
Regardless of the introduction of The New Program, food self-sufficiency ratio did not improve at all as shown in Fig.4. It was 40% in 2009. Later it was pointed out that limiting the object of the Direct Payment Program to large farm managements is not appropriate, and the amount of compensation was not large enough to support farm management.
The Basic Plan for Food, Agriculture and Rural Areas 2010 was introduced in 2010. This Basic Plan puts forward following agriculture policy principles.
-
Switching to a production system to meet consumer needs including high quality, safety and consumer confidence.
-
Reviving vigorous rural areas through collaboration between primary, secondary and tertiary industries. Promoting “The Sixth Industry” to expand farmer’s income.
-
To increase Japan’s food self-sufficiency ratio to 50% on a calorie supply basis by 2020.
Pilot Income Support Direct Payment Program
Aiming at solution for the problems of Programs of Direct Payment for Paddy-and Upland-Field Farming introduced in 2007, Pilot Income Support Direct Payment Program (PISDP program for short) was introduced in 2010. The object of the program is to secure sustainability and create an environment where all motivated farmers can continue practicing agriculture and tackle their business development. PISDP program removed the constraint on the policy object based on farm size, which was introduced by Direct Payment for Paddy-and Upland-Field Farming Program.
For the sake of maintaining regulation of demand and supply of rice, and support management of paddy farming, a net total of fixed payment and variable payment are paid to the participants of the PISDP program, as shown in Figure 5. Standard production cost of rice is defined as operating cost + 80% of the family labor costs, and is calculated as the moderation of five years among the past seven years. Standard selling price is the average price of the past three years. Standard production cost (US$156.4/60 kg) was about 81% of full production cost (operation cost + family labor costs + own land rent + own capital interest: US$192.8 /60kg) in Fiscal Year 2010.
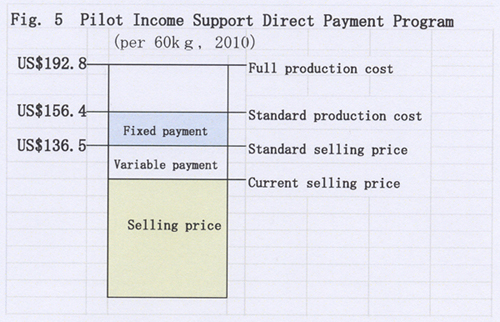
Fixed payments (US$19.9/60kg) is the difference between the standard selling price (US$156.4/60kg)and the standard production cost (US$136.5/60kg). Variable payment is the difference between the standard selling price and the current selling price.
When converted into 10 are, a net total of fixed payment of US$170.9 and variable payment of US$172.0 was paid to participants of PISDP program. Entry area was 1.08 million ha and the amount of fixed payments was US$184.6million in FY2010.
Effects of Pilot Income Support Direct Payment Program for rice farming
The nationwide number of recipients under the PISDP Program for rice farming totaled 1.16 million (including 1.15 million independent farms, 6,000 incorporated farms and 7,000 community-based farm cooperatives). The percentage of the applicants for entry to the PISDP program is high, 75.8% of 1,755,763 object farms, and 75.6% of 1,430,000 entry area at the end of August 2010.
A breakdown of the recipients under the program by rice planted area shows that those with rice acreage at five ha or more accounted for 36% of the total (Japan MAFF, 2011). The implementation of the PISDP Program for Farmers has made some contribution toward improving farming business performance, promoting the adjustment of rice supply and expanding production of rice for new uses.
Paddy farms’ agricultural income in 2010 expanded by 37% from the previous year, due to subsidies provided under the PISDP Program for rice farmers, despite a 4% drop in rice price. As a result of the introduction of the PISDP Program in FY2010 excessive rice planted area compared with the target volume of rice production, declined by 19,000 ha to 22,000 ha.
The program did not only help to stabilize farmers’ business but also achieved some progress in organizing community-based farm cooperatives, increasing farmland liquidity and expanding production of feed uses. The number of community-based farm cooperatives has increased year by year, standing at approximately 15,000, as of February 2012.
PISDP program’s structural improvement effect in rice farming
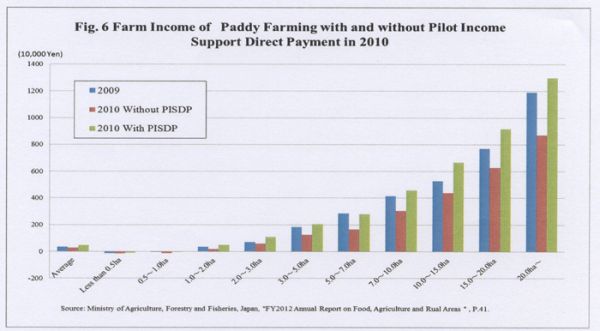
There exist differences in the production cost of rice along the scale of rice production. The average rice production cost of all scale classes is US$156.1 per 60 kg, but an average rice production cost of less than 0.5 ha class is US$231.0, which is US$74.9 higher than the total average in 2010. On the other hand, the average rice production cost of 5~10 ha class is US$112, which is US$44.1 lower than total average (Fig. 6). Merit of the large-scale class is the foundation of investment for the expansion of rice farming or diversification of farm management.
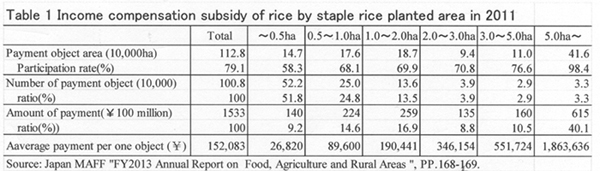
Rice growers participated in PISDP program received direct payments of US$342.9 per 10 are on average in 2010. Since larger-scale class farmers received more direct payment, agricultural income of large-scale class farmers increased more as shown in Fig. 6. Differences of farmer’s income between income from rice production without direct payment and with PISDP direct payment are bigger for larger-scale class farmers. Table 1 shows the amount of the direct payment by scale of rice planted area in 2011. Largest scale rice producers who cultivate more than or equal to five ha of rice received 12.2 times of the direct payment of the average size class farmers. Bigger increase in agricultural income of large-scale class farmers is the foundation of investment for the expansion of rice farming or diversification of farm management. This will help to increase the number of large scale rice farm management.
From the standpoint of raising the utilization rate of cultivated land, which contributes to the increase in the food self-sufficiency ratio, a subsidy of US$170.9 per 10 are was paid for the introduction of twice-a-year crop rotation such as combination of staple rice and strategic crop (wheat, soybean, buckwheat, rice for feed, rice for bio-energy, rice for WCS, rice for processing) or the combination of strategic crops together.
Income Support Direct Payment Program for Farmers
Income Support Direct Payment Program for Farmers was carried out for paddy farming as well as dry field farming in 2011. Direct payments are paid to paddy farmers as well as dry field farmers who participated in ISDP program. The difference between the standard production cost and the standard selling price of dry field agricultural products such as wheat, soybeans, sugar beet was paid as fixed payment. This program has made some contributions to improve farm business performance, promoting the adjustment of supply and demand of rice, and expanding production of rice for new uses.
Development of Japonica rice production in Heilongjiang China
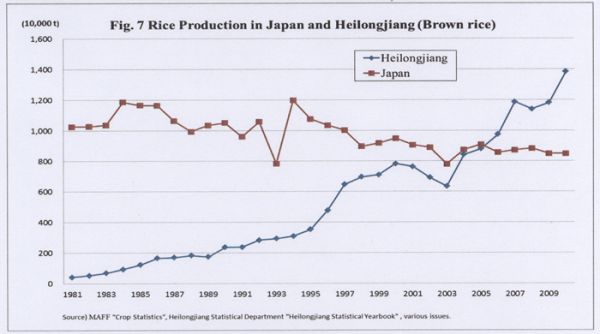
Heilongjiang is the largest japonica rice producing province in China. Japonica rice production was 20.62 million tons (paddy rice) in 2011, which is about 1.84 times of the rice production in Japan. Rice production in Heilongjiang increased by 37 times during the 30 years from 1981 to 2011 (Fig. 7).
This rapid increase in rice production is mainly attributable to the expansion of the rice planted area, which increased 15.4 times during the 30 years. Investment in land improvement such as riparian work and irrigation work, as well as the diffusion of rice transplanting technology and cold-resistant high yielding varieties transferred from Japan contributed to rapid expansion of rice planted area.
Rice export from Heilongjiang has been mainly carried out by Heilongjiang Beidahuang Reclamation Group. Rice export started at the end of the 1990s and 50,000 tons of Japonica rice was exported in 1999. Rice export increased smoothly afterwards, and expanded to 310,000 tons in 2007. Global grain price soared from 2008, and the Chinese Government restrained rice exports. Rice exports by Heilongjiang Beidahuang Reclamation Group decreased to 130,000 tons, which is less than half of the previous year. Rice export in 2010 was confined to the level of a little less than 50 thousand tons, too.
Japanese rice wholesalers evaluated imported SBS rice from Heilongjiang to be fairy good, and there was no problem with quality and price. Rice imported from China had the largest share in Japan's SBS rice import for most of the years until 2009. However, China’s SBS rice export to Japan declined sharply since the introduction of the Traceability Act in 2010.
The retail rice price in a department store in Harbin was 49.9-88.9 Yuan per 10 kg at the beginning of October 2011. In terms of Japanese yen it was ¥599~1,067 per 10 kg, about 1/6~1/4 of retail price in Japan. Handling of the rice will be important item of negotiation in the Japan, China and Korea Free Trade Agreement (FTA for short) negotiation. Since Heilongjiang has long experience of SBS rice export to Japan, the possibility of increasing rice export to Japan from Heilongjiang is suitable, if Japan's import tariff rate of rice is reduced.
EPA, TPP and Rice Problem
Trans-Pacific-Partnership negotiation
Japan participated in Trans-Pacific-Partnership (TPP for short) negotiation, which is said to be a Free-trade arrangement of high quality aiming at custom duty abolition in July, 2013. Japan's simple average tariff rate of all items is 4.9% in 2010, which is located approximately midway among the TPP negotiation participating 12 countries. On the other hand, the average tariff rate of agricultural commodity is 21% (World Trade Organization, 2010). It is highest among the TPP negotiation participating countries. This high average tariff rate of agricultural product is due to the high tariff rates of some commodities, such as rice (778%), wheat (252%), butter (360%), and sugar (328%). Tariff rates of agricultural commodities except those sensitive five items are low. Japanese Government aims to exclude five items (rice, wheat, beef and pork, dairy produce, and sugar) from tariff abolition at the TPP negotiation.
Tariff abolition rate of the Economic Partnership Agreement (EPA) that Japan concluded up to now is from the middle of 80% to latter half of 80%. If tariff rates of the five sensitive agricultural products are to be protected, abolition rate is 93.5%. The target that the U.S.A., which is the leader country in TPP negotiation, pursues is over 95%. Selection of which items to protect among five sensitive items, will start from now on.
Rice imports and reduction of food self-sufficiency ratio
Rice is crucially important commodity to maintain Japan’s food self-sufficiency ratio. It is expected that if the tariff rate of rice is largely reduced, Japonica rice import will increase from California, Heilongjiang, and Australia. Table 1 shows rice production cost per 60 kg and retail rice price per 1 kg of Japan, USA, and Heilongjiang. Japan’s production cost is more than 8 times higher than that of California and Heilongjiang. Japan’s Rice retail price is 3.9 times and 5.3 times higher compared to that of California and Heilongjiang, respectively.
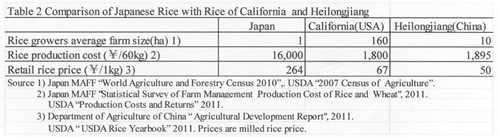
If current tariff rate of rice (i.e. 778 %) is reduced considerably, the possibility of increase in imports of Japonica rice outside the import quota from California, Australia and Heilongjiang will increase. This will reduce the rice production and the food self-sufficiency ratio of Japan sharply. As shown in Table 1, 59% of domestically supplied calorie is provided by domestically produced rice. If domestic rice production decreases in half due to import increase, food self-sufficiency ratio will decline by 12% point, and food self-sufficiency rate will decline to 27%. This will cause the issue of food insecurity, prostration of rural community, and the deterioration in the multi-functionality of agriculture.
Future problems and countermeasures
According to the projection by the Policy Research Institute, Japan MAFF, demand for agricultural products for food, feeds and biofuel uses in the world is expected to expand in line with population and income growth. Grain and soybean nominal prices in 2020 are estimated to be 24~35% higher than the 2007~2009 average (Policy Research Institute, 2011).
The majority of the Japanese are feeling anxious about the future of food supply. According to the results of “The Public Opinion Poll about the Role of Food, Agriculture, and Rural Areas” carried out by the Cabinet Office in 2010, 75% of respondents replied that Japan’s food self-sufficiency ratio of 40% is too low. The major reasons for anxiety about future food security are, first, the food self-sufficiency ratio has declined continuously for more than 45 years to 39% in 2010, which was the lowest among the countries with a population of more than 100 million. Second, domestic agricultural production has been decreasing since 1985 despite continuous policy efforts at enhancing agricultural production. Third, over 86% of respondents are feeling anxious about the future food imports, partly because many countries regulated and/or banned exports of foods during the World Food Crisis of 2007~2008. Riots and protest movements took place in about 20 developing countries that depended heavily on food imports.
The objective of The Basic Plan on Food, Agriculture and Rural Areas enacted in 2010 is to raise the food self-sufficiency rate to 50% by 2020. The content of the Plan is to raise wheat production from 880,000 tons in 2008 to 1.8 million tons in 2020, soybeans from 260,000 tons to 600,000 tons, rice for flour from 0.1 tons to 500,000 tons, and rice for feed from 0.9 tons to 700,000 tons, respectively.
CONCLUSION
Japan entered TPP negotiation on July 2013, the same year when the Japan, China, Korea FTA negotiations also started. The issue of further market-opening measures of Japanese agriculture attracts attention.
It is important to promote structural reform of paddy agriculture, and to pursue economies of scale in rice production. This will help to reduce the rice price difference between domestic and foreign markets. It is also necessary to make full use of paddy fields; producing not only staple rice, but also rice for feeds, whole crop silage, wheat, soybeans, feed crop, etc.
The Income Support Direct Payment program, which was introduced since 2010, contributed to promote agricultural reform. This program brought more increase in income to large-scale farmers than to small-scale farmers. Continuation and repletion of this policy will help to accelerate structural reform in rice farming. Large scale farmers seem to take a larger share of rice production, and therefore, average rice production cost will decline. Income Support Direct Payment program will also contribute to accelerate the full use of paddy fields and improve the food self-sufficiency ratio.
Even if such agricultural structural improvement in paddy farming advances smoothly, it is still not possible to compete with rice production in California and Heilongjiang. It is indispensable to maintain an appropriate tariff rate to compensate for the differences in land endowment, farm size, and agricultural input prices. Without appropriate tariff rates, Japanese paddy farming will be severely damaged, and the food self-sufficiency ratio will decline further.
Retention of food, military, and energy security are three important major affairs of national sustainability. Maintaining appropriate tariff rates in order to maintain food security is necessary for Japan to continue to exist as an independent country.
Japan pursues a food security policy by itself, as well as constructing a joint reserve of rice with ASEAN+ three countries (Japan and China, Korea). It is also desirable to promote an export strategy to help promote the consumption of delicious and healthy Japanese foods and other agricultural products to wealthy peoples in the world.
REFERENCES
Ministry of Agriculture, Forestry and Fisheries, Japan. 2009. Report on Minimum Access Rice.
Ministry of Agriculture, Forestry and Fisheries, Japan. 2011. FY2010 Annual Report on Food, Agriculture and Rural Areas in Japan.
Policy Research Institute, Ministry of Agriculture, Forestry and Fisheries, Japan. 2011. Outlook of Supply and Demand for Food in the World in 2020.
Shoichi Ito. 2013. Japan’s Rice Policy and its Role in the World Rice Market: Japan Should Act as a Watchdog. 299-312 in: David Dawe ed., The Rice Crisis; Markets, Policies and Food Security. Earthscan.
The Cabinet Office of Japan. 2010. The Public Opinion Poll about the Role of Food, Agriculture, and Rural Areas.
World Trade Organization. 2010. World Tariff Profiles 2010.
|
Submitted as a resource paper for the FFTC.NACF International Seminar on Threats and Opportunities of the Free Trade Agreements in the Asian Region. Sept. 29 - Oct. 3, 2013, Seoul, Korea |

Trade Liberalization and Rice Farming in Japan and Heilongjiang China
Toshiyuki Kako
Kibi International University
e-mail: kako@kobe-u.ac.jp
ABSTRACT
Japan has been pushing forward trade liberalization, and the country’s average tariff rate is at 4.9%, which is low by international standard. Agricultural imports increased rapidly with a reduction of tariff rate, appreciation of yen, and increase in income. Japan has been the biggest net importer of agricultural products in the world since 1984, and food self-sufficiency ratio has kept declining to 39% in 2011. Since rice supplies about 60% of Japan's food self-sufficiency ratio, it is important to maintain high self-sufficiency rate of rice for Japan's food security. Under the progress of globalization and trade liberalization, it is important to promote structural improvement, and establish rice farming structure in which rice farmers with more than 5 ha of rice production produce majority of rice output. At the same time, it is desirable to maintain and strengthen Income Support Direct Payment program so that large scale rice growers can get stable farm income.
INTRODUCTION
Food, energy and military security are three important elements of any national existence. Japan, Korea, and Taiwan are facing difficult agricultural problems as well as food security problems. These problems are related to the rapid industrialization characterized by unbalanced growth between the manufacturing and agricultural sectors. Comparative disadvantage of the agricultural sector is a common characteristic of Japan, Korea, and Taiwan. Agricultural sector in these countries are characterized by low land-labor ratio and small-scale and scattered landholding system. Wage rates and farmland prices had increased in the process of rapid economic development. Agricultural production costs of these countries are relatively high because of high land price, high wage rate and small scale farming. There are big differences in agricultural production cost between these countries and major agricultural exporting countries which are endowed with large farmland. Food self-sufficiency ratio of these countries had declined as imports of agricultural products increased under the progress of globalization and free trade.
Key words: Food Self-Sufficiency Ratio, MA Rice Import, Rice Policy, TPP
As food self-sufficiency ratio declines, people’s concern for food security has increased in Japan. How to maintain food security and vigorous rural areas are the issues and challenges facing globalization and free trade. One of the important questions is how to combine tariff and direct payment in order to maintain food security and vigorous rural areas under the progress of globalization.
In this article, the following topics related to agricultural trade liberalization, rice farming, and food self-sufficiency ratio will be discussed. The period of analysis is the 20 years from 1990 to 2010, in which globalization got into full swing.
1) Summarize major changes in the agriculture sector.
2) Review the process of trade liberalization of agricultural products.
3) Examine recent policy measures related to rice economy.
4) Summarize the development of Japonica rice production in Heilongjiang province in China.
5) Consider the possible impact of Trans-Pacific Partnership Agreement on the rice economy and food self-sufficiency ratio of Japan.
Position of Agriculture in the National Economy
Position of agricultural sector in the national economy has declined in the process of economic development over the last 20 years in Japan. The share of the Gross Agricultural Product within Gross Domestic Product declined gradually, from 1.8% in 1990 to 0.9% in 2010. The proportion of agricultural labor force within the total labor force declined from 6.2% in 1990 to 3.4% in 2010. The percentage of labor force, older than 65 years old, engaged in farming increased from 33.1% to 60.6%. Arable land area decreased by 12% , from 5.24 million ha to 4.59 million ha during the same period. These figures tell us that agricultural input, as well as agricultural output decreased largely, and that small-scale farming managed by old farmers had increased during the past 20 years.
Imports of agricultural products increased to supplement the contraction of domestic agricultural production. Imports of agricultural products increased by 90%, from US$28.9 billion to US$55.0 billion during the 20 years. Meanwhile, agricultural exports stayed at low level, - US$3 billion in 2010.
Although the position of the agricultural sector in the national economy fell greatly, total domestic production of agricultural and food industries was recorded at US$1.02 trillion in 2009, which accounted for 11% of all industries, forming one of the major industrial fields in the Japanese economy.
Worsening of Terms of Trade in the agricultural sector
Terms of Trade index of agriculture sector, which is calculated as a ratio of farm product synthesis price index and agricultural production material synthesis price index, declined by 29% during the period 1990~2010 (Fig.1).The fall of Terms of Trade index of the agricultural sector was caused by a fall of 14% of the farm products synthesis price index and a rise of 15% of the agricultural production material synthesis price index during the 20 years. For agricultural management, this fall of Terms of Trade index means that the sale price of farm products fell against the purchase price of agricultural production material. As a result, agricultural production income fell by 41% during the past 20 years.
The budget of the Ministry of Agriculture, Forestry and Fisheries also decreased by 24% from ¥2,519 billion in 1990 to ¥1,902 billion in 2010, and agricultural protection by financial incentives also decreased. With this, the size of the Japanese agriculture sector reduced under the WTO system which started in 1995.
There were differences in the extent of the contraction among different areas of the agricultural sector. Reduction of the production value of the rice sector stood out in comparison with that of the livestock and vegetables sectors. Production value of the past livestock and vegetable sectors decreased by 18%, and 13%, respectively during the past 20 years. Meanwhile, production value of the rice sector had a staggering 51% decline. Rice production value decreased due to the decline in the price of rice and the reduction of rice consumption which was caused by income increase and changes in the dietary habit.
Reduction of farmland and total planted area
The non-agricultural sectors have increased the demand for land and have, more competitively competed for land use with the agricultural sector. Higher returns for land from non-agricultural use relative to agricultural use have increased the transfer of farmland to non-agricultural use. At the same time the amount of abandoned farmland increased because of aging and the resulting shortage of agricultural labor force, low profitability of farming, and the rice diversion program. Total farmland area has decreased by 12.4%, from 5.24 million ha in 1990 to 4.59 million ha in 2010. There was 400,000 ha of abandoned farmland in 2010.
The farmland utilization ratio has also declined over time, from 102% in 1990 to 92% in 2010. The combined result of these changes is a 21% reduction in the total planted area, from 5.35 million ha in 1990 to 4.23 million ha in 2010:
Changes in average operation size per farm household by category
Big differences also were evident in the expansion of the average operation size per farm households by category of farming. In the case of processing type livestock farming, which relies heavily on imported feeds, operation size has expanded rather easily. Average operation size for milk cows, beef cattle, and pigs per farm household increased 2.15 times, 3.35 times, and 5.28 times, respectively over 20 years from 1990 to 2010. On the other hand, the expansion of farm size of land intensive farming was rather slow because the augmentation of farm size needs a transfer of ownership right or tenant right of the farmland. The average operation size for rice increased 1.46 times from 0.72 ha to 1.05 ha during the same period. The rice diversion program has been carried out since 1970, and total rice planted area has been declining until today (Fig 2). This is one of the reasons for the slow expansion of the average amount of rice production per farm.
The scale of transfer of utilization rights and ownership rights of farmland has not been large enough to increase the number of large-scale farms. Although the tendency toward large-scale farms with more than 5 hectares of farmland is slowly increasing, the average farm size remains small at only 1.96 ha in 2010.
Average rice planted area per farm increased by 46%, from 0.72 ha in 1990 to 1.05 ha in 2010. In recent years, agricultural earnings and farm gross income of rice farming are also sluggish. Upbringing of large-scale rice farm management has been an important policy concern for a long time. As for the management form, there are family farms, community-based farm cooperatives, and incorporation management. Although the number of community-based farm cooperatives, and incorporation management has been increasing recently, the absolute number of family farm management is still the largest. The number of community-based farm cooperatives has increased mainly in the Tohoku and Kyushu regions, since 2005. The number came to 14,643 in 2011.The number of legal agricultural production persons, using farmlands for their own farming needs has been persistently increasing. After the revised Agricultural Land Act took effect, 404 corporations entered agricultural production between December 2009 and March 2011.
Increase in the proportion of aging farm labor force
In the process of rapid economic growth, the labor absorption power of the industrial sector strengthened and drew a large amount of labor force from the agricultural sector. Many young farm household members found jobs in no-agricultural sectors almost as soon as they graduated from high school or college. The number of new school graduates entering agriculture was 1,800 in 1990, and this number kept declining and fell to 1,600 in 2010. The result is a shrinking farming population and an increase in the proportion of aging farm labor. Japan’s agricultural labor force was 2.61 million in 2010, down from 4.82 million in 1990. The proportion of agricultural labor force 65 years old and over rose from 33.1% in 1990 to 61.6% in 2011. Average age of farmers was 65.8 in 2010. The continuing outflow of the agricultural labor force and the decreasing number of newcomers to agriculture have caused a shortage of young labor equipped with good management and farming skills, thus further weakening the competitive power of the agricultural sector. As a new tendency, the numbers of employed agricultural workers, who are employed regularly by the legal agricultural producers, have been increasing recently. It increased to 5,100 in 2009.
Trends of Agricultural Trade
Outline of agricultural trade and food self-sufficiency ratio
Japan's trade balance was in surplus throughout the 1990~2010 periods, mainly due to the increase in exports of manufacturing goods. Foreign currency reserves increased, and the foreign exchange rate of the yen against the dollar appreciated by more than 30%, during the 20 past years. Imports of agricultural products, which became cheaper in comparison with domestically produced agricultural products, increased partly due to the appreciation of the Yen.
Japan has been the world largest net importer of agricultural products since 1984. Japan imported US$50.5 billion of agricultural products from USA, ASEAN, EU, China, and Australia in 2009. On the other hand, exports of agricultural products were US$3.0 billion. Annual net imports of agricultural products were US$47.4 billion in 2009. Japan’s agricultural imports comprised a significant portion of the world agricultural trade; 17.0% of maize, 15.0% of banana, 10.5% of pork, 4.8% of soybeans in 2009. Japan’s import value of maize, pork, and chicken were the largest in the world and soybeans was the second, beef was the fourth, and wheat was the fifth in the world.
On the other hand, exports of Japan’s agricultural products remained stagnant for the last 10 years, mainly because of high prices due partly to the high production cost and appreciation of the Yen. Agricultural exports in 2009 were US$3 billion, which is similar to the level of exports in 2001. Rice export was 2,202 ton, and export value was ¥7.3 million in 2012.
Food self-sufficiency ratio of Japan had declined from 48% in 1990 to 39% in 2010, as shown in Fig 4. This is the lowest level among countries with population of more than 100 million, and the majority of Japanese consider that this to be too low. According to the result of the public-opinion poll carried out in 2010 by the Cabinet Office of Japan, 90.3% of the respondents felt that it is better to produce food domestically with continuous effort to reduce production costs, even though domestically produced food prices are to some extent higher than international food prices. In contrast, only 5.4% of the respondents answered that it is better to import foods if they are cheaper. (Cabinet office of Japan, 2010)
MA rice import based on the GATT・UR agricultural agreement
Rice trade was under the control of the government, and rice was not imported except in time of rice shortages due to bad crops until 1994. However, due to the GATT・ UR agricultural agreement of 1993, a special exception measure of tariffication was applied to Japan's rice. As a compensation for the special exception measure of tariffication, Minimum Access rice (hereafter MA rice for short) import was decided to increase from 4% of domestic rice consumption in 1995, to 8% in 2000.
Since Japan takes the State Trading regime, in which the Government imports rice unitarily, the full quantity of MA rice was imported as an obligation. Although MA rice was imported without any import tax, Government collected margin, and sold MA rice domestically by topping a markup of ¥292 per 1 kg on the imported rice price.
The SBS (simultaneous buy and sell) import formula was introduced in one part of MA rice. 100,000 metric tons of rice was imported as SBS rice, and 667,000 metric tons of rice was imported as MA general rice. SBS rice was sold for staple foods, and MA general rice was sold for processing, food aid, and feed use.
The Japanese government changed the rice import method from the tariffication special exception measure to the tariffication measure from 1999. After the switchover from the tariffication special exception measure to the tariffication measure, fixed amount of MA rice i.e. 767,000 metric tons of brown rice was imported every year. Since there was a large difference between domestic rice price and international rice price, a specific tax of 341 yen per 1 kg was imposed on imported rice except MA rice. Since this tax is very high, which is equal to 778% in ad valorem tax, only around 100 tons of rice was imported per year.
Figure 3 shows the trend of MA rice import quantity since 1995. Considering MA general import rice, the selling price of US milled medium grain rice in the domestic market was 66% lower than the retail price of rice produced in Japan. Although the retail price of SBS rice has been increasing since 2000, it is still 40~50% lower than the price of domestically produced rice in 2007.
12.42 million tons of MA rice was imported during the period from April 1995 to March 2013. The share of MA rice by country compared to total Japanese MA rice imports during the 16 years from 1955 to 2011 is as follows; USA has the largest share of 44~56%, and Thailand has the second largest share of 20~46%. Thailand has increased its share since 2007 and it was 46% in 2010.
MA rice has been sold mainly for non-staple rice use, so that MA rice creates as few adverse effects on domestic rice as possible. The sale breakdown is 1.25 million metric tons for staple foods, 4.0 million tons for processing, 0.2 million tons for glutinous rice, 2.94 million tons for food aid, 3.0 million tons for feed, and 0.87 million tons for inventory.
The buying and selling losses and storage fees of MA rice have accumulated, and the financial loss of ¥133.6 billion occurred during the period from April, 1995 to October, 2007 (Japan MAFF, 2009).
The SBS rice import quota was 100,000 tons. SBS rice import decreased sharply in 2010 to 37,000 tons due to the introduction of "Rice Traceability Low" in Japan. Conservation of transaction record has been obligatory from October 2010. It also became an obligation to transmit production place information to consumers from July 2011. Japanese consumers tend to prefer domestic rice, and demand for imported SBS rice has decreased.
However, the East Japan great earthquake disaster and accident at the Fukushima nuclear power generation which occurred in 2011 lead to contamination of agricultural products, including rice, by radioactive cesium. This became a big issue. It was difficult to collect safe domestic rice. Again on this account SBS rice import was restored to the 100,000 ton level in 2011.
When we look at SBS import share by country, the Chinese share was largest. The share was within the range of 60% to a little over 70%. In 2010 rice imported from China decreased sharply due to the influence of the Rice Traceability Low (Shoichi Ito. 2013).
The shares of SBS rice imported by country in 2012 were: USA 41%, China 28%, Australia 24%, Thailand 5%, and others 2%. Characteristics of recent SBS rice import are the increase in the share of Australian rice in 2011, 2012, and the decrease in the Chinese rice share.
Rice producer's price in Japan had traced a declining trend since 1999, due to the influence of MA rice import and decrease in rice consumption, except in 2003 when the rice price soared because of bad crop, as shown in Figure 1. Rice income per 10 followed a declining trend except for 2003, and the declining rate has increased since 2004.
There were requests and negotiations to reduce Japan's high tariff rate of 778% in the WTO Doha round, that began in 2000. Since the Doha round negotiations ended in failure, the same tariff rate of rice is still being maintained.
Japan concluded, signed or completed negotiations on Economic Partnership Agreements (EPA) with 13 countries/regions. Rice was treated as a sensitive commodity in all of the EPA, and the 778% tariff rate is maintained for rice. However, in TPP negotiation, in which Japan started to participate in negotiation from July 2013, some member countries such as USA and Australia have exported SBS rice to Japan. It is entrusted to future TPP negotiations, as to whether Japan can maintain the current tariff rate or not. The consequences of negotiation will greatly influence the future of Japanese rice farming.
Major Policies Related to Rice Farming
The Basic Law on Food, Agriculture, and Rural Areas, which is considered to be the constitution in the field of agriculture, was enacted in 1999. The objective of this Law is to stabilize and improve people's lifestyle and to develop the national economy through comprehensively and systematically implementing policies on food, agriculture and rural areas. Basic ideas of four measures are:
Major goals of Basic Law on Food, Agriculture, and Rural Areas are to strengthen the competitiveness of the agricultural sector, and to increase calorie self-sufficiency ratio to 50% by 2020, and to increase scale and efficiency of farms in order to help them survive and provide a greater share of Japan’s need.
The Government shall establish a basic plan for food, agriculture and rural area for the promotion of the comprehensive and systematic implementation of policies on food, agriculture and rural areas. The basic plan shall be reviewed every five years. The target for the food self-sufficiency ratio shall be established in view of improving the ratio.
WTO Doha round negotiation begun in 2000, and reduction of the tariff rate of agricultural commodity was on the agenda. Basic Plan on Food, Agriculture, and Rural Areas in 2000, concentrated measures on establishing efficient and stable farm management in which main agriculture workers can earn a lifetime income on the equivalent level of a person who works in other industry. It was aimed to establish an agricultural structure in which the farm management takes a considerable part of total agricultural production.
The Basic Plan on Food, Agriculture and Rural Areas 2000 set up a specific target of 45% for the food self-sufficiency ratio to be achieved by 2010. This target was expected to have been achieved based on efforts of related parties including producers, consumers, and food industries. However, agriculture and rural areas faced tough conditions including a substantial decline in agricultural income and serious shortages of motivated farmers. The Japanese agricultural sector and related industries could not fully meet the needs of consumers and the food industry. The food self-sufficiency ratio has stayed at 40 % during the period 1999-2005.
Direct Payment Program for Paddy-and Upland-Field Farming
On the basis of the failure in achieving the target, the New Basic Plan on Food, Agriculture and Rural Areas was enacted in 2005, and set up a new target for raising the food self-sufficiency ratio to 45% by 2015. As an attempt to achieve this policy goal, the Food Self-Sufficiency Ratio Improvement Council was established in 2005, and has formulated action plans to steadily improve the food self-sufficiency ratio.
Rice production costs per 10 are have declined by 18% from 1998 to 2007 while, producer's rice price index declined by 25% during the same period. Decreasing rice output is added to collapse the producer's income from rice production. As a result farm income decreased by one-third during the ten years. However, there was no support program to compensate for a large part of the loss. As a countermeasure to such situation, the Direct Payment Program for Paddy-and Upland-Field Farming was introduced in 2007. The major objective of this program is to establish a strong agricultural structure, which can bear international competition under the WTO regime. Policy measures are concentrated on certified individual farm management with more than or equal to 4 ha of farm size, and community-based agricultural cooperatives with more than or equal to 20 ha of farm size. This program aimed to strengthen farm management of land use type agriculture such as rice, wheat and soybeans. Subsidy was paid to compensate for the differential of production conditions with foreign countries, and to reduce the influence of income reduction.
Regardless of the introduction of The New Program, food self-sufficiency ratio did not improve at all as shown in Fig.4. It was 40% in 2009. Later it was pointed out that limiting the object of the Direct Payment Program to large farm managements is not appropriate, and the amount of compensation was not large enough to support farm management.
The Basic Plan for Food, Agriculture and Rural Areas 2010 was introduced in 2010. This Basic Plan puts forward following agriculture policy principles.
Pilot Income Support Direct Payment Program
Aiming at solution for the problems of Programs of Direct Payment for Paddy-and Upland-Field Farming introduced in 2007, Pilot Income Support Direct Payment Program (PISDP program for short) was introduced in 2010. The object of the program is to secure sustainability and create an environment where all motivated farmers can continue practicing agriculture and tackle their business development. PISDP program removed the constraint on the policy object based on farm size, which was introduced by Direct Payment for Paddy-and Upland-Field Farming Program.
For the sake of maintaining regulation of demand and supply of rice, and support management of paddy farming, a net total of fixed payment and variable payment are paid to the participants of the PISDP program, as shown in Figure 5. Standard production cost of rice is defined as operating cost + 80% of the family labor costs, and is calculated as the moderation of five years among the past seven years. Standard selling price is the average price of the past three years. Standard production cost (US$156.4/60 kg) was about 81% of full production cost (operation cost + family labor costs + own land rent + own capital interest: US$192.8 /60kg) in Fiscal Year 2010.
Fixed payments (US$19.9/60kg) is the difference between the standard selling price (US$156.4/60kg)and the standard production cost (US$136.5/60kg). Variable payment is the difference between the standard selling price and the current selling price.
When converted into 10 are, a net total of fixed payment of US$170.9 and variable payment of US$172.0 was paid to participants of PISDP program. Entry area was 1.08 million ha and the amount of fixed payments was US$184.6million in FY2010.
Effects of Pilot Income Support Direct Payment Program for rice farming
The nationwide number of recipients under the PISDP Program for rice farming totaled 1.16 million (including 1.15 million independent farms, 6,000 incorporated farms and 7,000 community-based farm cooperatives). The percentage of the applicants for entry to the PISDP program is high, 75.8% of 1,755,763 object farms, and 75.6% of 1,430,000 entry area at the end of August 2010.
A breakdown of the recipients under the program by rice planted area shows that those with rice acreage at five ha or more accounted for 36% of the total (Japan MAFF, 2011). The implementation of the PISDP Program for Farmers has made some contribution toward improving farming business performance, promoting the adjustment of rice supply and expanding production of rice for new uses.
Paddy farms’ agricultural income in 2010 expanded by 37% from the previous year, due to subsidies provided under the PISDP Program for rice farmers, despite a 4% drop in rice price. As a result of the introduction of the PISDP Program in FY2010 excessive rice planted area compared with the target volume of rice production, declined by 19,000 ha to 22,000 ha.
The program did not only help to stabilize farmers’ business but also achieved some progress in organizing community-based farm cooperatives, increasing farmland liquidity and expanding production of feed uses. The number of community-based farm cooperatives has increased year by year, standing at approximately 15,000, as of February 2012.
PISDP program’s structural improvement effect in rice farming
There exist differences in the production cost of rice along the scale of rice production. The average rice production cost of all scale classes is US$156.1 per 60 kg, but an average rice production cost of less than 0.5 ha class is US$231.0, which is US$74.9 higher than the total average in 2010. On the other hand, the average rice production cost of 5~10 ha class is US$112, which is US$44.1 lower than total average (Fig. 6). Merit of the large-scale class is the foundation of investment for the expansion of rice farming or diversification of farm management.
Rice growers participated in PISDP program received direct payments of US$342.9 per 10 are on average in 2010. Since larger-scale class farmers received more direct payment, agricultural income of large-scale class farmers increased more as shown in Fig. 6. Differences of farmer’s income between income from rice production without direct payment and with PISDP direct payment are bigger for larger-scale class farmers. Table 1 shows the amount of the direct payment by scale of rice planted area in 2011. Largest scale rice producers who cultivate more than or equal to five ha of rice received 12.2 times of the direct payment of the average size class farmers. Bigger increase in agricultural income of large-scale class farmers is the foundation of investment for the expansion of rice farming or diversification of farm management. This will help to increase the number of large scale rice farm management.
From the standpoint of raising the utilization rate of cultivated land, which contributes to the increase in the food self-sufficiency ratio, a subsidy of US$170.9 per 10 are was paid for the introduction of twice-a-year crop rotation such as combination of staple rice and strategic crop (wheat, soybean, buckwheat, rice for feed, rice for bio-energy, rice for WCS, rice for processing) or the combination of strategic crops together.
Income Support Direct Payment Program for Farmers
Income Support Direct Payment Program for Farmers was carried out for paddy farming as well as dry field farming in 2011. Direct payments are paid to paddy farmers as well as dry field farmers who participated in ISDP program. The difference between the standard production cost and the standard selling price of dry field agricultural products such as wheat, soybeans, sugar beet was paid as fixed payment. This program has made some contributions to improve farm business performance, promoting the adjustment of supply and demand of rice, and expanding production of rice for new uses.
Development of Japonica rice production in Heilongjiang China
Heilongjiang is the largest japonica rice producing province in China. Japonica rice production was 20.62 million tons (paddy rice) in 2011, which is about 1.84 times of the rice production in Japan. Rice production in Heilongjiang increased by 37 times during the 30 years from 1981 to 2011 (Fig. 7).
This rapid increase in rice production is mainly attributable to the expansion of the rice planted area, which increased 15.4 times during the 30 years. Investment in land improvement such as riparian work and irrigation work, as well as the diffusion of rice transplanting technology and cold-resistant high yielding varieties transferred from Japan contributed to rapid expansion of rice planted area.
Rice export from Heilongjiang has been mainly carried out by Heilongjiang Beidahuang Reclamation Group. Rice export started at the end of the 1990s and 50,000 tons of Japonica rice was exported in 1999. Rice export increased smoothly afterwards, and expanded to 310,000 tons in 2007. Global grain price soared from 2008, and the Chinese Government restrained rice exports. Rice exports by Heilongjiang Beidahuang Reclamation Group decreased to 130,000 tons, which is less than half of the previous year. Rice export in 2010 was confined to the level of a little less than 50 thousand tons, too.
Japanese rice wholesalers evaluated imported SBS rice from Heilongjiang to be fairy good, and there was no problem with quality and price. Rice imported from China had the largest share in Japan's SBS rice import for most of the years until 2009. However, China’s SBS rice export to Japan declined sharply since the introduction of the Traceability Act in 2010.
The retail rice price in a department store in Harbin was 49.9-88.9 Yuan per 10 kg at the beginning of October 2011. In terms of Japanese yen it was ¥599~1,067 per 10 kg, about 1/6~1/4 of retail price in Japan. Handling of the rice will be important item of negotiation in the Japan, China and Korea Free Trade Agreement (FTA for short) negotiation. Since Heilongjiang has long experience of SBS rice export to Japan, the possibility of increasing rice export to Japan from Heilongjiang is suitable, if Japan's import tariff rate of rice is reduced.
EPA, TPP and Rice Problem
Trans-Pacific-Partnership negotiation
Japan participated in Trans-Pacific-Partnership (TPP for short) negotiation, which is said to be a Free-trade arrangement of high quality aiming at custom duty abolition in July, 2013. Japan's simple average tariff rate of all items is 4.9% in 2010, which is located approximately midway among the TPP negotiation participating 12 countries. On the other hand, the average tariff rate of agricultural commodity is 21% (World Trade Organization, 2010). It is highest among the TPP negotiation participating countries. This high average tariff rate of agricultural product is due to the high tariff rates of some commodities, such as rice (778%), wheat (252%), butter (360%), and sugar (328%). Tariff rates of agricultural commodities except those sensitive five items are low. Japanese Government aims to exclude five items (rice, wheat, beef and pork, dairy produce, and sugar) from tariff abolition at the TPP negotiation.
Tariff abolition rate of the Economic Partnership Agreement (EPA) that Japan concluded up to now is from the middle of 80% to latter half of 80%. If tariff rates of the five sensitive agricultural products are to be protected, abolition rate is 93.5%. The target that the U.S.A., which is the leader country in TPP negotiation, pursues is over 95%. Selection of which items to protect among five sensitive items, will start from now on.
Rice imports and reduction of food self-sufficiency ratio
Rice is crucially important commodity to maintain Japan’s food self-sufficiency ratio. It is expected that if the tariff rate of rice is largely reduced, Japonica rice import will increase from California, Heilongjiang, and Australia. Table 1 shows rice production cost per 60 kg and retail rice price per 1 kg of Japan, USA, and Heilongjiang. Japan’s production cost is more than 8 times higher than that of California and Heilongjiang. Japan’s Rice retail price is 3.9 times and 5.3 times higher compared to that of California and Heilongjiang, respectively.
If current tariff rate of rice (i.e. 778 %) is reduced considerably, the possibility of increase in imports of Japonica rice outside the import quota from California, Australia and Heilongjiang will increase. This will reduce the rice production and the food self-sufficiency ratio of Japan sharply. As shown in Table 1, 59% of domestically supplied calorie is provided by domestically produced rice. If domestic rice production decreases in half due to import increase, food self-sufficiency ratio will decline by 12% point, and food self-sufficiency rate will decline to 27%. This will cause the issue of food insecurity, prostration of rural community, and the deterioration in the multi-functionality of agriculture.
Future problems and countermeasures
According to the projection by the Policy Research Institute, Japan MAFF, demand for agricultural products for food, feeds and biofuel uses in the world is expected to expand in line with population and income growth. Grain and soybean nominal prices in 2020 are estimated to be 24~35% higher than the 2007~2009 average (Policy Research Institute, 2011).
The majority of the Japanese are feeling anxious about the future of food supply. According to the results of “The Public Opinion Poll about the Role of Food, Agriculture, and Rural Areas” carried out by the Cabinet Office in 2010, 75% of respondents replied that Japan’s food self-sufficiency ratio of 40% is too low. The major reasons for anxiety about future food security are, first, the food self-sufficiency ratio has declined continuously for more than 45 years to 39% in 2010, which was the lowest among the countries with a population of more than 100 million. Second, domestic agricultural production has been decreasing since 1985 despite continuous policy efforts at enhancing agricultural production. Third, over 86% of respondents are feeling anxious about the future food imports, partly because many countries regulated and/or banned exports of foods during the World Food Crisis of 2007~2008. Riots and protest movements took place in about 20 developing countries that depended heavily on food imports.
The objective of The Basic Plan on Food, Agriculture and Rural Areas enacted in 2010 is to raise the food self-sufficiency rate to 50% by 2020. The content of the Plan is to raise wheat production from 880,000 tons in 2008 to 1.8 million tons in 2020, soybeans from 260,000 tons to 600,000 tons, rice for flour from 0.1 tons to 500,000 tons, and rice for feed from 0.9 tons to 700,000 tons, respectively.
CONCLUSION
Japan entered TPP negotiation on July 2013, the same year when the Japan, China, Korea FTA negotiations also started. The issue of further market-opening measures of Japanese agriculture attracts attention.
It is important to promote structural reform of paddy agriculture, and to pursue economies of scale in rice production. This will help to reduce the rice price difference between domestic and foreign markets. It is also necessary to make full use of paddy fields; producing not only staple rice, but also rice for feeds, whole crop silage, wheat, soybeans, feed crop, etc.
The Income Support Direct Payment program, which was introduced since 2010, contributed to promote agricultural reform. This program brought more increase in income to large-scale farmers than to small-scale farmers. Continuation and repletion of this policy will help to accelerate structural reform in rice farming. Large scale farmers seem to take a larger share of rice production, and therefore, average rice production cost will decline. Income Support Direct Payment program will also contribute to accelerate the full use of paddy fields and improve the food self-sufficiency ratio.
Even if such agricultural structural improvement in paddy farming advances smoothly, it is still not possible to compete with rice production in California and Heilongjiang. It is indispensable to maintain an appropriate tariff rate to compensate for the differences in land endowment, farm size, and agricultural input prices. Without appropriate tariff rates, Japanese paddy farming will be severely damaged, and the food self-sufficiency ratio will decline further.
Retention of food, military, and energy security are three important major affairs of national sustainability. Maintaining appropriate tariff rates in order to maintain food security is necessary for Japan to continue to exist as an independent country.
Japan pursues a food security policy by itself, as well as constructing a joint reserve of rice with ASEAN+ three countries (Japan and China, Korea). It is also desirable to promote an export strategy to help promote the consumption of delicious and healthy Japanese foods and other agricultural products to wealthy peoples in the world.
REFERENCES
Ministry of Agriculture, Forestry and Fisheries, Japan. 2009. Report on Minimum Access Rice.
Ministry of Agriculture, Forestry and Fisheries, Japan. 2011. FY2010 Annual Report on Food, Agriculture and Rural Areas in Japan.
Policy Research Institute, Ministry of Agriculture, Forestry and Fisheries, Japan. 2011. Outlook of Supply and Demand for Food in the World in 2020.
Shoichi Ito. 2013. Japan’s Rice Policy and its Role in the World Rice Market: Japan Should Act as a Watchdog. 299-312 in: David Dawe ed., The Rice Crisis; Markets, Policies and Food Security. Earthscan.
The Cabinet Office of Japan. 2010. The Public Opinion Poll about the Role of Food, Agriculture, and Rural Areas.
World Trade Organization. 2010. World Tariff Profiles 2010.