ABSTRACT
Sustainable intensification is vital to ensuring food security in Japan in view of the low food self-sufficiency rate (37% on a calorie basis, 66% on a price basis in 2020). As a result, the Ministry of Agriculture, Forestry and Fisheries (MAFF) launched the initiative known as “Strategy for Sustainable Food Systems.” However, data on the application of nitrogen (N), phosphorus (P) and potassium (K) for different crops are insufficient. In this study, NPK production and application rate were estimated from statistical data and national scale surveys conducted by MAFF from 1989 to 2012, and the NPK balance and use efficiency were evaluated. Chemical NPK fertilizers were the main nutrient resource for paddy rice, Upland crops, vegetables, orchards, and tea plantations, while manure was the main nutrient resource for forages and fodders. Crop NPK yields were higher on forages and fodders compared to the others, attributed to high productivity. As a result of the large N application, the N balance on teas was the largest among the crops, followed by vegetables. For the P balance, vegetables and tea tended to be higher compared to the others. The K balance had a relatively narrow range of distribution (around 100 kg ha-1). The use efficiency of N and P was higher on paddy rice, forages, and fodders than the others. As the K yield on paddy rice and orchard crops was low among crops, the K use efficiency was low on these crops. A reduction in K input for paddy rice, optimal NP application for vegetables, and equilibrium fertilization for orchards are regarded as approaches for the reduction of fertilizer resource consumption and potential negative environmental impacts. Fertilization for Upland crop might provide a framework for vegetable fertilization. Nitrogen fertilization is strongly related to tea quality; however, ongoing optimization of fertilization is needed. Additional N input using chemical fertilizers might be required for forage and fodder due to N deficiency. The application of these results would aid in increasing the sustainability of Japanese crop production.
Keywords: Crop production, Chemical fertilizer, Manure, National scale survey, Strategy for Sustainable Food Systems
INTRODUCTION
In light of the limited possibility for farmland expansion and the low food self-sufficiency rate (37% on a calorie basis, 66% on a price basis in 2020), sustainable intensification of Japanese food production is needed. The Ministry of Agriculture, Forestry and Fisheries (MAFF), Japan launched an initiative, “Strategy for Sustainable Food Systems” (MAFF 2021), to ensure a robust and sustainable food system. The conceptual approach of this initiative highlights the interconnectedness of four components, “input”, “production”, “processing”, and “consumption.” Through the linkage of these four components, MAFF aims to foster a socioeconomic and environmentally sustainable food system. The goals of this initiative include a 30% reduction in the use of chemical fertilizers and a 25% increase in organic farming area by 2050.
However, this initiative needs the support of diverse resources and information, such as genetic and fertilizer resources, and biodiversity and soil fertility data, etc. Additionally, present and past trends in the Japanese food system should be taken into consideration before implementation of this initiative.
In this study, I focused on the “input” and “production” components mentioned above. Then, nitrogen (N), phosphorus (P), and potassium (K) application by chemical fertilizers and manures for various crops was assessed by original estimations from national scale surveys of real-world soil fertilization and management in Japan. Past fertilization and production were assessed using 2 indices, apparent NPK balance and apparent NPK use efficiency. Finally, future requirements for the “Strategy for Sustainable Food Systems” are discussed from the viewpoint of NPK management.
MATERIALS AND METHODS
Data source for estimating crop fertilization and production
The data source for estimating application rates of various kinds of manure application for crops and chemical NPK fertilizers is based on real-world data. MAFF’s nationwide surveys “Basic Soil Environment Monitoring Project, Stationary Monitoring” and “Assessment and Extension of Technologies for Mitigating Greenhouse Gas Emissions from Agricultural Soil” were used. “Basic Soil Environment Monitoring Project, Stationary Monitoring” was performed 5 times, every 5 years, from 1979 to 2003. The number of surveys were > 20,000 fixed points on the 1st to 4th survey and >5,000 fixed points on the 5th survey. Each survey was adopted to the year 1980, 1985, 1990, 1995, and 2000, respectively. “Assessment and Extension of Technologies for Mitigating Greenhouse Gas Emissions from Agricultural Soil” was conducted from 2008 to 2012. More than 3,000 fixed points were set, then monitored once per year for 5 years in this survey. Thus, this survey consisted of >15,000 individual documents. The survey date was set as 2010. The setting of fixed monitoring points was dependent on specialists in local agricultural experimental stations.
Estimation method
The estimation method was according to Mishima et al. (2007) with modifications. Individual documents of the questionnaire in each survey were divided into 8 districts, 7 crops (paddy rice, Upland crops, vegetables, orchards, teas, forages, and fodders), and 4 farm households (fulltime farms with or without livestock, part-time farms with or without livestock). In each cluster, the numerical average was calculated for 3 kinds of manure (cattle, swine, and poultry for 1980 to 2000) or 4 (3 plus mixed only for 2010). The area planted corresponding to each cluster was estimated as follows: firstly, the area planted was summarized within the 8 districts and 7 crops. Secondly, the number of farms with livestock in 8 districts was multiplied with the planted area of crops listed in the “Cost of Livestock Production” (MAFF 1982a, 1987a, 1992a, 1997a, 2002a, 2012a), then the planted area by farms with livestock was calculated. Thirdly, the planted area by farms without livestock was calculated as planted area of 7 crops in 8 districts minus the corresponding planted area by farms with livestock. Lastly, the ratio of the number of fulltime farms to part-time farms was multiplied by each planted area by farms with or without livestock. The numerical average of manure application and 4 farm households by kinds of crops in 8 districts was weighted by the corresponding planted area of the 4 farm households. Then, the estimated average of the amount of manure type for 7 crops in 8 districts was weighted by planted area in 8 districts, then the national average was calculated.
Validation of estimates
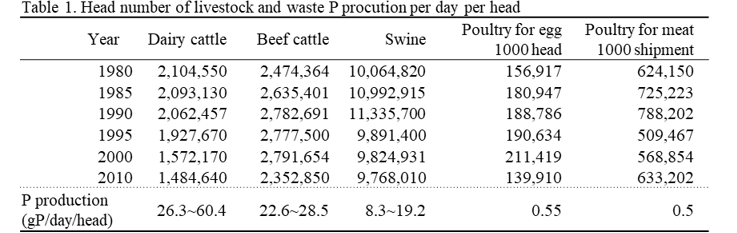
Livestock waste P production was estimated from the head number of livestock, and waste P production per head per day was estimated according to Kohyama et al. (2012) for dairy cattle, beef cattle, and pig and Ogino et al. (2015) for poultry for egg and poultry for meat (Table 1).
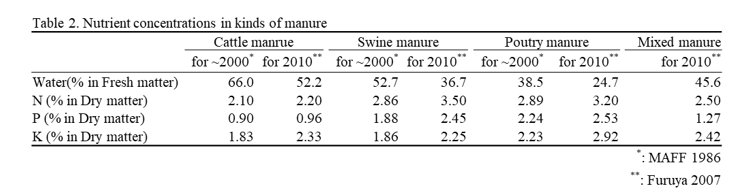
P concentration in kinds of livestock manure was according to MAFF (1982) for the years 1980, 1985, 1990, 1995, and 2000 and Furuya (2006) for the year 2010 (Table 2). These factors were also used for converting the amount of manure to the amount of manure N and K for other analyses.
The demand for chemical NPK fertilizers and the application of chemical NPK fertilizers for paddy rice in Japan is according to the Pocket Fertilizer Handbook (MAFF 1982c, 1987c, 1992c, 1997c, 2002c, 2012c).
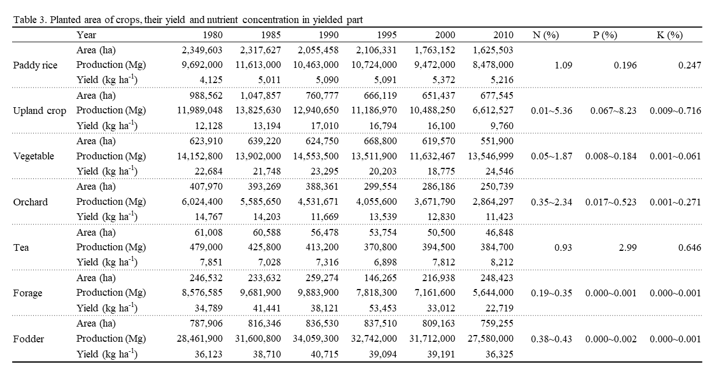
Crop NPK production was calculated by crop yield multiplied with NPK concentration indicated by Food Nutrition Standard (Ministry of Education, Culture, Sports, Science and Technology 2017) as shown in Table 3.
Definition of apparent NPK balance and apparent NPK use efficiency
The apparent nutrient balance of NPK is defined as follows:

The apparent nutrient use efficiency is defined as follows:

Here, denitrification in paddy rice fields and N fixation by legume crops are not considered.
RESULTS AND DISCUSSION
Validation of estimated values
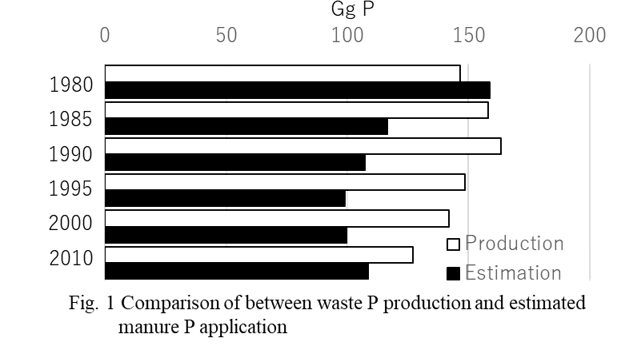
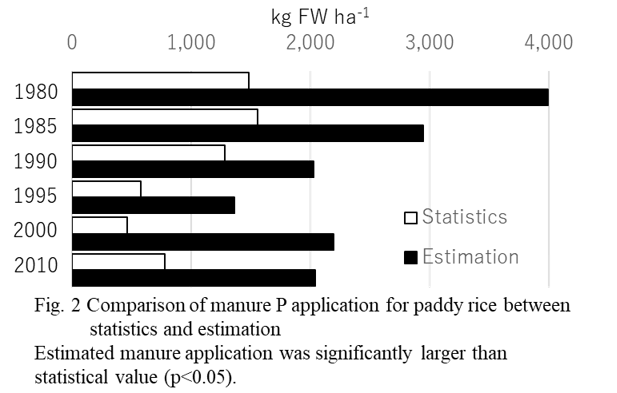
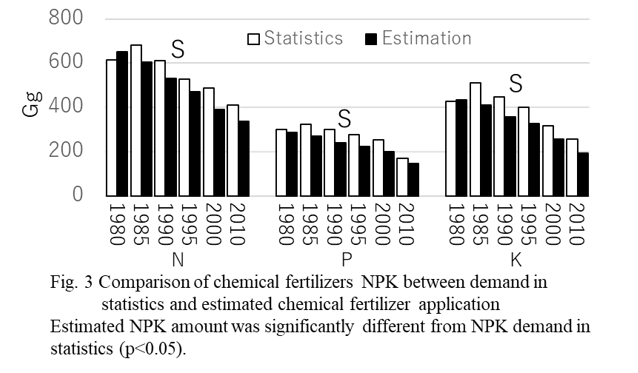
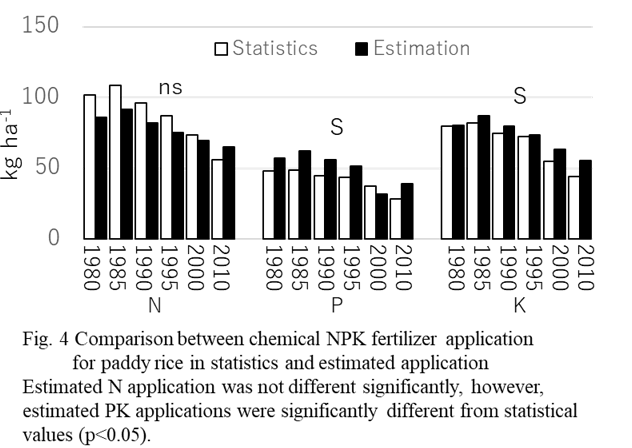
The majority of P remains after composting (Matsumoto et al. 2006); thus, I compared the amount of livestock waste P production and the P content in the applied manure. Although the amount of applied manure P was overestimated in 1980, livestock waste P production was larger than applied manure P in the other years on a national scale (Fig. 1). Here, the difference between the produced and applied P might be sent to sewage treatment and/or burned, and not utilized as manure. When estimated manure applications are compared with the values in the “Paddy Rice and Wheat Variety Production Cost” (MAFF 1982b, 1987b, 1992b, 1997b, 2002b, 2012b), the estimated values were larger than the values listed in the production cost statistics (Fig. 2). Therefore, it is possible that the estimated values were over-estimated. According to the statistics, the demand for NPK chemical fertilizers peaked in 1985, then declined to 2010 (Fig. 3). The estimated chemical NPK fertilizer application was the largest in 1980, then declined to 2010. Although the estimated chemical P fertilizer application in 1980 was lower than the chemical fertilizer P demand, this value also might be an over-estimation, as for the chemical N and K fertilizers. In the other years, the estimated values are under-estimations. The estimated chemical NPK fertilizer applications for paddy rice were lower than the statistics (Fig. 4). This difference could be attributed to farmers taking into account NPK levels in manure and then reducing the application of chemical NPK fertilizers. It is possible that the same phenomenon might occur in the other crops.
Notably, there are few reports on crop NPK yields on a national scale.
Trends in NPK fertilization by manure and chemical fertilizers and crop production NPK yields
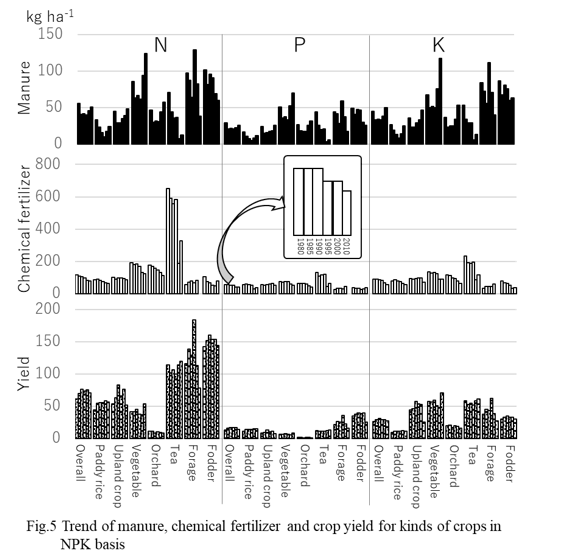
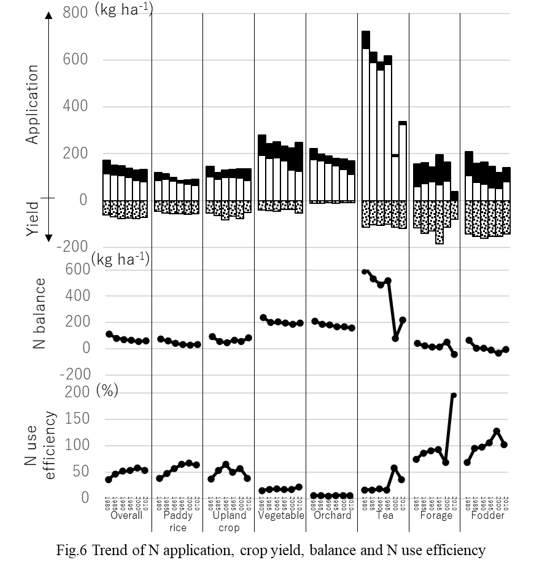
Trends in manure NPK application indicated that levels were the highest in 1980, reduced in 1985, and then increased to 2010 in most crops (Fig. 5). However, trends in manure NPK application for the various crops revealed complex differences according to the kind of crop. Manure NPK application for Upland crops, vegetables, and orchards indicated a similar trend overall, while that for paddy rice was the least in 1995, and then increased to 2010, and applications to teas, forages, and fodders demonstrated a general decline from 1980 to 2010 (Fig. 5).
Vegetables, forages, and fodders received greater amounts of manure NPK than the others. Japan is experiencing a severe labor shortage; however, vegetables are an important cash crop. Therefore, the cost of manure application would meet to pay the cost of labor. Cattle manure is an affordable fertilizer resource for dairy and beef cattle farms and the NPK productivity of these crops is high. Therefore, large applications of manure are reasonable and appropriate for the recurrent use of such fertilizer resources.
Chemical NPK fertilizer applications have declined from 1980 to 2010 in crops overall. In general, a decline in chemical NPK fertilizer application was observed for all crops except forage (Fig. 5). Tea received the highest chemical NPK fertilizer application, especially N (Fig. 5), as tea is thought to require a large N input for increased quality (Matsuzaka and Kurihara 1998). However, Yano et al. (2010) reported that application of 200 kg N ha-1 was sufficient for tea. The 2nd and 3rd highest chemical NPK fertilizer applications were in vegetables and orchard crops, respectively (Fig. 5). Vegetables and orchard products are cash crops and fertilizer applications increase the appearance of vegetables. The decline in chemical NPK application to paddy rice (Fig. 5) is attributed to the change in variety from high yield to high quality (low protein concentration, Mishima 2001) and improved fertilization method, i.e., from mixing fertilizer into the soil plow layer to setting fertilizer at the side row of transplanted rice. The increased fertilizer application to forage might compensate for the decrease in manure application.
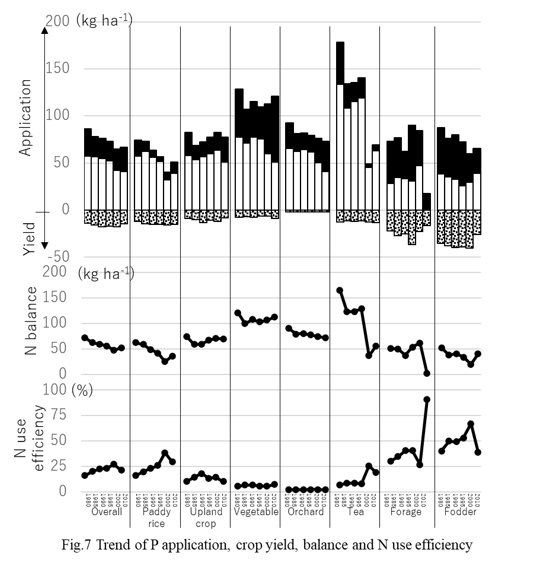
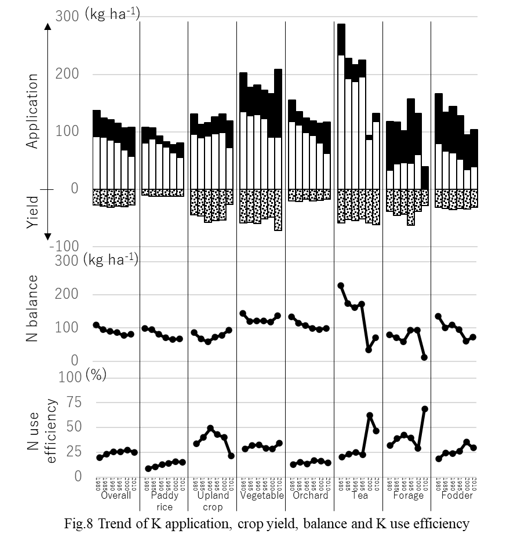
Crop NPK yield in overall crops peaked from 1990 to 2000 as the result of large yields in paddy rice, upland crop, forage, and fodder (Fig. 5). High N production was observed for forage and fodder, followed by tea (Fig. 5). P production was also the highest in forage and fodder, followed by paddy rice. For K, upland crop, vegetable, and tea showed high yields (Fig. 5). These are attributed to the high yield in fresh weight and the high N or P concentration of yields. The high K levels in Upland crop, vegetable, and tea were a result of the high K concentration of yields. The relatively low K yield in forage and fodder was due to the low K concentration in products, which prevents hypomagnesemia (grass tetany) in dairy and beef cattle (Fig. 5).
Trends in apparent NPK balance and apparent NPK use efficiency
The overall values of apparent NPK balance diminished and the overall apparent NPK use efficiency increased along with the decline in chemical NPK fertilizer input (Figs. 6, 7, 8). For N, a large apparent N balance was observed in vegetable, orchards, and teas, which was attributed to the high input of chemical N fertilizer for these 3 crops in addition to high manure N input in vegetables (Fig. 6). Paddy rice, Upland crops, forages, and fodders showed a small apparent N balance, attributed to the low N input in paddy rice and high N yields in forages and fodders (Fig. 6). However, fodders occasionally showed a negative apparent N balance (Fig. 6). To compensate for N deficiency, additional N would be needed to ensure sustainable fodder production. Apparent N use efficiency was high in paddy rice, Upland crops, forages, and fodders but low in vegetables and orchard crops (Fig. 6). For forages, > 200% of apparent N use efficiency was attributed to the lack of chemical N fertilizer application in the survey (Fig. 6).
A large P balance was observed in vegetables and teas because of the high chemical P fertilizer input in these crops and the large manure-derived P in vegetables (Fig. 7). Paddy rice, forages, and fodders showed a relatively small apparent P balance, attributed to the low chemical P fertilizer for these crops (Fig. 7). However, the large manure-derived P in forages and fodders, and their high P yields reduced the apparent P balance in these crops. Forages and fodders showed high apparent P use efficiency, followed by paddy rice. As with the apparent P balance, high P yields in foragses and fodders resulted in high P use efficiency. Paddy rice also showed a relatively high P yield, in which the water-logged conditions enabled higher P availability compared to upland field condition. Mishima et al. (2003) reported an overall P use efficiency of 18% in 1997, while Takahashi and Nakano (2011) reported a value of 28% in 2009. Although the P use efficiency calculated in this study was intermediate of these values, the estimated total chemical P fertilizer was 78 to 98% of P fertilizer demand; therefore, the apparent P use efficiency might have been overestimated. Estimated total chemical P fertilizer was 78 to 98% of P fertilizer demand; therefore, the apparent P use efficiency might have been overestimated.
The apparent K balance was around 100 kg ha-1 and large differences were not observed for crops, except for teas and forages in 2010 (Fig. 8). For teas, a rapid reduction in K input resulted in a small apparent K balance (Fig. 8). The lack of chemical fertilizer application on forage resulted in a balance approaching zero in 2010 (Fig. 8). Although the K balance was distributed in a relatively narrow range, the apparent K use efficiency was the lowest in paddy rice, followed by orchards (Fig. 8). These results were attributed to the low K yields in these crops (Fig. 8). The apparent K balance was higher in vegetables than upland crops; however, because of high vegetable K yields, the apparent K use efficiency did not obviously differ between these crops (Fig. 8).
The need for future sustainable intensification of Japanese crop production
The large apparent N and P balances mean low apparent N and P use efficiencies, though the differences in N or P application rate by manure and chemical fertilizers between crops were not obviously different for P compared to N. However, management of N or P fertilizer application should follow different approaches.
Nitrogen induces quick responses in crops. For example, growth, yield, and quality of paddy rice and fruit vegetables, such as tomatoes, are controlled by N (Nishio 2001). Fertilization management during the yielding season is conducted in reference to the N concentration in the leaf sap (Yamamoto and Matsumaru 2007) for fruit vegetables, thereby reducing N application and minimizing fertilizer costs. Therefore, N fertilization can be conducted using a logical approach and systematic method. Expanding the range of systematic N application would aid in reducing excessive or unnecessary N use.
The effect of P is sometimes difficult to assess from crop responses such as growth and yield or other physiological conditions. Guidelines for P management involve determination of the available soil P concentration by the Truog method for upland cultivation (MAFF, 2006) and the Bray II method for paddy cultivation (Hokkaido 2020). In Japan, andosol, which exhibits strong P fixation activity, represents about half of the upland soil. Therefore, it has been reported that Japanese upland field crop production, especially upland crops and vegetables in this study, required large inputs of P fertilizers in the past (Obara and Nakai 2004). As a result, accumulation of P in farmland soils in both available and non-available forms have been observed, and excess available P has been reported in upland fields and in fields covered by plastic film (Obara and Nakai 2004), namely the upland crops and vegetables in this study. It is necessary that the management of P in agricultural production takes into account legacy P that comes by past huge input of P fertilizers. Through ongoing soil fertility monitoring, maintenance of legacy P concentrations in an appropriate range and revised P inputs for crop needs, such as P equilibrium fertilization (Verloop et al. 2010), using soil testing have future applicability for P resource management and reduction of excess P.
The K balance and use efficiency are complex. Although a larger K balance was observed in vegetables and orchard crops than paddy rice, the K use efficiency in these crops was higher than paddy rice (Fig. 8) than the other crops. There are various challenges in the evaluation of K application and management. The approaches to K management would conform to those for P management, namely, set the application rate according to the K availability in farmland soils. Kubotera (2022) generated a guideline for K management on paddy rice using soil K availability. As a high K balance and low K use efficiency were observed in this study, such a method would be reasonable.
CONCLUSION
There continues to be insufficient information and suitable fertilizer use methods for N application, and P and K management for maintaining appropriate concentrations in farmland soils. Technological countermeasures for the overuse of fertilizer resources, such as excessive N application for teas and vegetables, are being developed. Past approaches have been a result of socioeconomic factors to minimize production costs. Future progress will address conservation of soil, water, and air, and improved health of crops in both agricultural and natural environments.
At present, a reduction in chemical NPK fertilizer use in Japan with minimal impacts on crop yield according to the goals of “Strategy for Sustainable Food Systems” have not been realized. It is possible that manure applications in this study are over-estimated; however, livestock manure is in short supply in Japan on a national scale. Notably, the impact of organic farming on managing soil nutrients is not addressed in this work, and there has generally been not sufficient scientific research on crop production and fertilization by means of organic agriculture.
Regardless, under the “Strategy for Sustainable Food Systems,”, diverse information and technologies are anticipated to be generated through various research efforts. Research has been conducted on reducing negative environmental effects; however, fertilizer resource management strategies should incorporate further sustainability and intensification of agricultural production.
ACKNOWLEDGEMENT
I am deeply grateful to the staff of the agricultural experimental stations in 47 prefectures for the data collection for “Basic Soil Environment Monitoring Project, Stationary Monitoring” and “Assessment and Extension of Technologies for Mitigating Greenhouse Gas Emissions from Agricultural Soil”. The information and viewpoints regarding fertilizer resources are supported by the Phosphorus Industry Development Organization, Japan.
REFERENCES
Furuya O. (2006) Survey of Livestock Manure at Compost Center in Japan. Livestock Science,59, 1181-1183. (In Japanese)
Hokkaido (2020) Hokkaido Fertilization Guide. PDF at https://www.harp.lg.jp/opendata/dataset/1056/resource/4481/source-url (in Japanese)
Kohyama K., M Hojito,H. Sasaki and S. Matsuura. (2006) Estimation of the Amount of Nutrients in Livestock Manure Jpn. J. Soil Sci. Plant Nutr.:77, 283-291. (In Japanese with English summary)
Kubotera H. (2022) Guidelines for proper application of potash in paddy rice based on the potash balance of soil for lowland paddy fields Standard work procedure manual. https://www.naro.go.jp/publicity_report/publication/laboratory/naro/sop/... (In Japanese)
Ministry of Agriculture, Forestry and Fisheries (MAFF) (1982a) Livestock Production Cost. MAFF, Tokyo (In Japanese)
MAFF (1982b) Paddy Rice and Wheat Variety Production Cost. MAFF, Tokyo (In Japanese)
MAFF (1982c) Pocket Fertilizer Handbook. MAFF, Tokyo (In Japanese)
MAFF (1982d) Quality of Organic Fertilizers and Manures in Japan. MAFF, Tokyo (In Japanese)
MAFF (1987a) Livestock Production Cost. MAFF, Tokyo (In Japanese)
MAFF (1987b) Paddy Rice and Wheat Variety Production Cost. MAFF, Tokyo (In Japanese)
MAFF (1987c) Pocket Fertilizer Handbook. MAFF, Tokyo (In Japanese)
MAFF (1992a) Livestock Production Cost. MAFF, Tokyo (In Japanese)
MAFF (1992b) Paddy Rice and Wheat Variety Production Cost. MAFF, Tokyo (In Japanese)
MAFF (1992c) Pocket Fertilizer Handbook. MAFF, Tokyo (In Japanese)
MAFF (1997a) Livestock Production Cost. MAFF, Tokyo (In Japanese)
MAFF (1997b) Paddy Rice and Wheat Variety Production Cost. MAFF, Tokyo (In Japanese)
MAFF (1997c) Pocket Fertilizer Handbook. MAFF, Tokyo (In Japanese)
MAFF (2002a) Livestock Production Cost. MAFF, Tokyo (In Japanese)
MAFF (2002b) Paddy Rice and Wheat Variety Production Cost. MAFF, Tokyo (In Japanese)
MAFF (2002c) Pocket Fertilizer Handbook. MAFF, Tokyo (In Japanese)
MAFF (2006) Basic Direction of Soil Fertility Improvement. PDF at https://www.maff.go.jp /pdf/dojo_tiryoku-2 (In Japanese)
MAFF (2012a) Livestock Production Cost. MAFF, Tokyo (In Japanese)
MAFF (2012b) Paddy Rice and Wheat Variety Production Cost. MAFF, Tokyo (In Japanese)
MAFF (2012c) Pocket Fertilizer Handbook. MAFF, Tokyo (In Japanese)
MAFF (2021) Strategy for Sustainable Food Systems. https://www.maff.go.jp/e/policies/env/env_policy/meadri.html
MAFF (2022) Real Time Diagnosis on Crops Need Additional Fertilizer http://www.maff.go.jp/hozen_type/pdf/siryo8
Ministry of Education, Culture, Sports, Science and Technology (2017) Food Nutrition Standard. Kanpo Kyodo Publishing, Tokyo (in Japanese)
Matsumoto T., Y. Kimurra, K. Takahashi and M. Hojito (2006) The Behavior of the Fertilizer Nutrients of Barnyard Manure Covered with a Sheet. Jpn.J.Soil Sci,Plant Nutr.: 77, 395-400 (In Japanese with English summary)
Matsuzaka H. and J. Kurihara (1998) Soil, Plan Nutrition and Environment, Hakuyusha, Tokyo (In Japan)
Mishima S. (2001) Recent trend of nitrogen flow associated with agricultural production in Japan. Soil Sci. Plant Nutri: 47, 157-166.
Mishima S., A. Leon, S. Eguchi and Y. Shirato (2017) Livestock Waste, Potential Manure Production and Its Use in Japan in 1980 and 2010. Compost Science and Utilization: 25, 543-552.
Mishima S., S. Itahashi, R. Kimura, and T. Inoue (2003) Trends of phosphate fertilizer demand and phosphate balance in farmland soils in Japan. Soil Sci Plant Nutri: 49, 39-45.
Nishio M. (2001) Analysis of the Actual State of Nitrogen Application in Arable Farming in Japan. Jpn. J. Soil Sci. Plant Nutr.: 72. 513-521 (In Japanese with English summary)
Obara H. and M. Nakai (2004) Changes of Soil Characteristic in Japanese Arable Lands (II). Jpn. J. Soil Sci. Plant Ntri.: 75, 59-67. (In Japanese with English summary)
Ogino A., H. Murakami, T. Yamashita, M. Furuya, H. Kawahara, T. Ohkubo and T. Osada (2017) Estimation of nutrient excretion factors of broiler and layer chickens in Japan. Animal Science Journal: 88, 659-668.
Sotome T., M. Fujita, N. Gunji, Y. Ogawa, A. Shiraishi, S. Kobayashi, Y. Takahashi and T.Yoshida (2010) Present Problems and Future Improvement of Malting Barley Production in Nasu, Tochigi Prefecture. Jpn. J. Crop Sci.: 79, 528―535 (In Japanese with English summary)
Takahashi T. and A. Nakano (2011) Research topics on roots for improving Japan's food self-sufficiency rate and environmental conservation. Root Research 20: 49-59 (In Japanese with English summary)
Verloop J, J. Oenema, S. L. G. Burgers, H. F. M. Aarts and H. van Keulen (2010) P-equilibrium fertilization in an intensive dairy farming system: effects on soil-P status, crop yield and P leaching. Nutrient Cycling in Agroecosystems volume 87: 369–382
Yamamoto F and T Matusmaru (2007) Reduction of Top Dressed Nitrogen Based on Nitrate Diagnosis of Tomato (Solanun lycopersicum L .) Petiole Sap Grown in Graft Culture. Jpn Soil Sci Plant Nutri. 78, 391-294. (In Japanese with English summary)
Yano K., H. Ikeuchi and K. Kawata (2010) Influence of the Kind of Soil at Tea Field and Amount of Nitrogen Fertilizer on Yield and Quality of Tea, and on Utilization Rate of Applied Nitrogen Fertilizer. Kagawa Agricultural Research Station Research Reprot: 61, 63-70. (In Japanese with English summary)


Recent Trends In Nutrient Use, Balance And Use Efficiency For Sustainable Intensification In Japan
ABSTRACT
Sustainable intensification is vital to ensuring food security in Japan in view of the low food self-sufficiency rate (37% on a calorie basis, 66% on a price basis in 2020). As a result, the Ministry of Agriculture, Forestry and Fisheries (MAFF) launched the initiative known as “Strategy for Sustainable Food Systems.” However, data on the application of nitrogen (N), phosphorus (P) and potassium (K) for different crops are insufficient. In this study, NPK production and application rate were estimated from statistical data and national scale surveys conducted by MAFF from 1989 to 2012, and the NPK balance and use efficiency were evaluated. Chemical NPK fertilizers were the main nutrient resource for paddy rice, Upland crops, vegetables, orchards, and tea plantations, while manure was the main nutrient resource for forages and fodders. Crop NPK yields were higher on forages and fodders compared to the others, attributed to high productivity. As a result of the large N application, the N balance on teas was the largest among the crops, followed by vegetables. For the P balance, vegetables and tea tended to be higher compared to the others. The K balance had a relatively narrow range of distribution (around 100 kg ha-1). The use efficiency of N and P was higher on paddy rice, forages, and fodders than the others. As the K yield on paddy rice and orchard crops was low among crops, the K use efficiency was low on these crops. A reduction in K input for paddy rice, optimal NP application for vegetables, and equilibrium fertilization for orchards are regarded as approaches for the reduction of fertilizer resource consumption and potential negative environmental impacts. Fertilization for Upland crop might provide a framework for vegetable fertilization. Nitrogen fertilization is strongly related to tea quality; however, ongoing optimization of fertilization is needed. Additional N input using chemical fertilizers might be required for forage and fodder due to N deficiency. The application of these results would aid in increasing the sustainability of Japanese crop production.
Keywords: Crop production, Chemical fertilizer, Manure, National scale survey, Strategy for Sustainable Food Systems
INTRODUCTION
In light of the limited possibility for farmland expansion and the low food self-sufficiency rate (37% on a calorie basis, 66% on a price basis in 2020), sustainable intensification of Japanese food production is needed. The Ministry of Agriculture, Forestry and Fisheries (MAFF), Japan launched an initiative, “Strategy for Sustainable Food Systems” (MAFF 2021), to ensure a robust and sustainable food system. The conceptual approach of this initiative highlights the interconnectedness of four components, “input”, “production”, “processing”, and “consumption.” Through the linkage of these four components, MAFF aims to foster a socioeconomic and environmentally sustainable food system. The goals of this initiative include a 30% reduction in the use of chemical fertilizers and a 25% increase in organic farming area by 2050.
However, this initiative needs the support of diverse resources and information, such as genetic and fertilizer resources, and biodiversity and soil fertility data, etc. Additionally, present and past trends in the Japanese food system should be taken into consideration before implementation of this initiative.
In this study, I focused on the “input” and “production” components mentioned above. Then, nitrogen (N), phosphorus (P), and potassium (K) application by chemical fertilizers and manures for various crops was assessed by original estimations from national scale surveys of real-world soil fertilization and management in Japan. Past fertilization and production were assessed using 2 indices, apparent NPK balance and apparent NPK use efficiency. Finally, future requirements for the “Strategy for Sustainable Food Systems” are discussed from the viewpoint of NPK management.
MATERIALS AND METHODS
Data source for estimating crop fertilization and production
The data source for estimating application rates of various kinds of manure application for crops and chemical NPK fertilizers is based on real-world data. MAFF’s nationwide surveys “Basic Soil Environment Monitoring Project, Stationary Monitoring” and “Assessment and Extension of Technologies for Mitigating Greenhouse Gas Emissions from Agricultural Soil” were used. “Basic Soil Environment Monitoring Project, Stationary Monitoring” was performed 5 times, every 5 years, from 1979 to 2003. The number of surveys were > 20,000 fixed points on the 1st to 4th survey and >5,000 fixed points on the 5th survey. Each survey was adopted to the year 1980, 1985, 1990, 1995, and 2000, respectively. “Assessment and Extension of Technologies for Mitigating Greenhouse Gas Emissions from Agricultural Soil” was conducted from 2008 to 2012. More than 3,000 fixed points were set, then monitored once per year for 5 years in this survey. Thus, this survey consisted of >15,000 individual documents. The survey date was set as 2010. The setting of fixed monitoring points was dependent on specialists in local agricultural experimental stations.
Estimation method
The estimation method was according to Mishima et al. (2007) with modifications. Individual documents of the questionnaire in each survey were divided into 8 districts, 7 crops (paddy rice, Upland crops, vegetables, orchards, teas, forages, and fodders), and 4 farm households (fulltime farms with or without livestock, part-time farms with or without livestock). In each cluster, the numerical average was calculated for 3 kinds of manure (cattle, swine, and poultry for 1980 to 2000) or 4 (3 plus mixed only for 2010). The area planted corresponding to each cluster was estimated as follows: firstly, the area planted was summarized within the 8 districts and 7 crops. Secondly, the number of farms with livestock in 8 districts was multiplied with the planted area of crops listed in the “Cost of Livestock Production” (MAFF 1982a, 1987a, 1992a, 1997a, 2002a, 2012a), then the planted area by farms with livestock was calculated. Thirdly, the planted area by farms without livestock was calculated as planted area of 7 crops in 8 districts minus the corresponding planted area by farms with livestock. Lastly, the ratio of the number of fulltime farms to part-time farms was multiplied by each planted area by farms with or without livestock. The numerical average of manure application and 4 farm households by kinds of crops in 8 districts was weighted by the corresponding planted area of the 4 farm households. Then, the estimated average of the amount of manure type for 7 crops in 8 districts was weighted by planted area in 8 districts, then the national average was calculated.
Validation of estimates
Livestock waste P production was estimated from the head number of livestock, and waste P production per head per day was estimated according to Kohyama et al. (2012) for dairy cattle, beef cattle, and pig and Ogino et al. (2015) for poultry for egg and poultry for meat (Table 1).
P concentration in kinds of livestock manure was according to MAFF (1982) for the years 1980, 1985, 1990, 1995, and 2000 and Furuya (2006) for the year 2010 (Table 2). These factors were also used for converting the amount of manure to the amount of manure N and K for other analyses.
The demand for chemical NPK fertilizers and the application of chemical NPK fertilizers for paddy rice in Japan is according to the Pocket Fertilizer Handbook (MAFF 1982c, 1987c, 1992c, 1997c, 2002c, 2012c).
Crop NPK production was calculated by crop yield multiplied with NPK concentration indicated by Food Nutrition Standard (Ministry of Education, Culture, Sports, Science and Technology 2017) as shown in Table 3.
Definition of apparent NPK balance and apparent NPK use efficiency
The apparent nutrient balance of NPK is defined as follows:
The apparent nutrient use efficiency is defined as follows:
Here, denitrification in paddy rice fields and N fixation by legume crops are not considered.
RESULTS AND DISCUSSION
Validation of estimated values
The majority of P remains after composting (Matsumoto et al. 2006); thus, I compared the amount of livestock waste P production and the P content in the applied manure. Although the amount of applied manure P was overestimated in 1980, livestock waste P production was larger than applied manure P in the other years on a national scale (Fig. 1). Here, the difference between the produced and applied P might be sent to sewage treatment and/or burned, and not utilized as manure. When estimated manure applications are compared with the values in the “Paddy Rice and Wheat Variety Production Cost” (MAFF 1982b, 1987b, 1992b, 1997b, 2002b, 2012b), the estimated values were larger than the values listed in the production cost statistics (Fig. 2). Therefore, it is possible that the estimated values were over-estimated. According to the statistics, the demand for NPK chemical fertilizers peaked in 1985, then declined to 2010 (Fig. 3). The estimated chemical NPK fertilizer application was the largest in 1980, then declined to 2010. Although the estimated chemical P fertilizer application in 1980 was lower than the chemical fertilizer P demand, this value also might be an over-estimation, as for the chemical N and K fertilizers. In the other years, the estimated values are under-estimations. The estimated chemical NPK fertilizer applications for paddy rice were lower than the statistics (Fig. 4). This difference could be attributed to farmers taking into account NPK levels in manure and then reducing the application of chemical NPK fertilizers. It is possible that the same phenomenon might occur in the other crops.
Notably, there are few reports on crop NPK yields on a national scale.
Trends in NPK fertilization by manure and chemical fertilizers and crop production NPK yields
Trends in manure NPK application indicated that levels were the highest in 1980, reduced in 1985, and then increased to 2010 in most crops (Fig. 5). However, trends in manure NPK application for the various crops revealed complex differences according to the kind of crop. Manure NPK application for Upland crops, vegetables, and orchards indicated a similar trend overall, while that for paddy rice was the least in 1995, and then increased to 2010, and applications to teas, forages, and fodders demonstrated a general decline from 1980 to 2010 (Fig. 5).
Vegetables, forages, and fodders received greater amounts of manure NPK than the others. Japan is experiencing a severe labor shortage; however, vegetables are an important cash crop. Therefore, the cost of manure application would meet to pay the cost of labor. Cattle manure is an affordable fertilizer resource for dairy and beef cattle farms and the NPK productivity of these crops is high. Therefore, large applications of manure are reasonable and appropriate for the recurrent use of such fertilizer resources.
Chemical NPK fertilizer applications have declined from 1980 to 2010 in crops overall. In general, a decline in chemical NPK fertilizer application was observed for all crops except forage (Fig. 5). Tea received the highest chemical NPK fertilizer application, especially N (Fig. 5), as tea is thought to require a large N input for increased quality (Matsuzaka and Kurihara 1998). However, Yano et al. (2010) reported that application of 200 kg N ha-1 was sufficient for tea. The 2nd and 3rd highest chemical NPK fertilizer applications were in vegetables and orchard crops, respectively (Fig. 5). Vegetables and orchard products are cash crops and fertilizer applications increase the appearance of vegetables. The decline in chemical NPK application to paddy rice (Fig. 5) is attributed to the change in variety from high yield to high quality (low protein concentration, Mishima 2001) and improved fertilization method, i.e., from mixing fertilizer into the soil plow layer to setting fertilizer at the side row of transplanted rice. The increased fertilizer application to forage might compensate for the decrease in manure application.
Crop NPK yield in overall crops peaked from 1990 to 2000 as the result of large yields in paddy rice, upland crop, forage, and fodder (Fig. 5). High N production was observed for forage and fodder, followed by tea (Fig. 5). P production was also the highest in forage and fodder, followed by paddy rice. For K, upland crop, vegetable, and tea showed high yields (Fig. 5). These are attributed to the high yield in fresh weight and the high N or P concentration of yields. The high K levels in Upland crop, vegetable, and tea were a result of the high K concentration of yields. The relatively low K yield in forage and fodder was due to the low K concentration in products, which prevents hypomagnesemia (grass tetany) in dairy and beef cattle (Fig. 5).
Trends in apparent NPK balance and apparent NPK use efficiency
The overall values of apparent NPK balance diminished and the overall apparent NPK use efficiency increased along with the decline in chemical NPK fertilizer input (Figs. 6, 7, 8). For N, a large apparent N balance was observed in vegetable, orchards, and teas, which was attributed to the high input of chemical N fertilizer for these 3 crops in addition to high manure N input in vegetables (Fig. 6). Paddy rice, Upland crops, forages, and fodders showed a small apparent N balance, attributed to the low N input in paddy rice and high N yields in forages and fodders (Fig. 6). However, fodders occasionally showed a negative apparent N balance (Fig. 6). To compensate for N deficiency, additional N would be needed to ensure sustainable fodder production. Apparent N use efficiency was high in paddy rice, Upland crops, forages, and fodders but low in vegetables and orchard crops (Fig. 6). For forages, > 200% of apparent N use efficiency was attributed to the lack of chemical N fertilizer application in the survey (Fig. 6).
A large P balance was observed in vegetables and teas because of the high chemical P fertilizer input in these crops and the large manure-derived P in vegetables (Fig. 7). Paddy rice, forages, and fodders showed a relatively small apparent P balance, attributed to the low chemical P fertilizer for these crops (Fig. 7). However, the large manure-derived P in forages and fodders, and their high P yields reduced the apparent P balance in these crops. Forages and fodders showed high apparent P use efficiency, followed by paddy rice. As with the apparent P balance, high P yields in foragses and fodders resulted in high P use efficiency. Paddy rice also showed a relatively high P yield, in which the water-logged conditions enabled higher P availability compared to upland field condition. Mishima et al. (2003) reported an overall P use efficiency of 18% in 1997, while Takahashi and Nakano (2011) reported a value of 28% in 2009. Although the P use efficiency calculated in this study was intermediate of these values, the estimated total chemical P fertilizer was 78 to 98% of P fertilizer demand; therefore, the apparent P use efficiency might have been overestimated. Estimated total chemical P fertilizer was 78 to 98% of P fertilizer demand; therefore, the apparent P use efficiency might have been overestimated.
The apparent K balance was around 100 kg ha-1 and large differences were not observed for crops, except for teas and forages in 2010 (Fig. 8). For teas, a rapid reduction in K input resulted in a small apparent K balance (Fig. 8). The lack of chemical fertilizer application on forage resulted in a balance approaching zero in 2010 (Fig. 8). Although the K balance was distributed in a relatively narrow range, the apparent K use efficiency was the lowest in paddy rice, followed by orchards (Fig. 8). These results were attributed to the low K yields in these crops (Fig. 8). The apparent K balance was higher in vegetables than upland crops; however, because of high vegetable K yields, the apparent K use efficiency did not obviously differ between these crops (Fig. 8).
The need for future sustainable intensification of Japanese crop production
The large apparent N and P balances mean low apparent N and P use efficiencies, though the differences in N or P application rate by manure and chemical fertilizers between crops were not obviously different for P compared to N. However, management of N or P fertilizer application should follow different approaches.
Nitrogen induces quick responses in crops. For example, growth, yield, and quality of paddy rice and fruit vegetables, such as tomatoes, are controlled by N (Nishio 2001). Fertilization management during the yielding season is conducted in reference to the N concentration in the leaf sap (Yamamoto and Matsumaru 2007) for fruit vegetables, thereby reducing N application and minimizing fertilizer costs. Therefore, N fertilization can be conducted using a logical approach and systematic method. Expanding the range of systematic N application would aid in reducing excessive or unnecessary N use.
The effect of P is sometimes difficult to assess from crop responses such as growth and yield or other physiological conditions. Guidelines for P management involve determination of the available soil P concentration by the Truog method for upland cultivation (MAFF, 2006) and the Bray II method for paddy cultivation (Hokkaido 2020). In Japan, andosol, which exhibits strong P fixation activity, represents about half of the upland soil. Therefore, it has been reported that Japanese upland field crop production, especially upland crops and vegetables in this study, required large inputs of P fertilizers in the past (Obara and Nakai 2004). As a result, accumulation of P in farmland soils in both available and non-available forms have been observed, and excess available P has been reported in upland fields and in fields covered by plastic film (Obara and Nakai 2004), namely the upland crops and vegetables in this study. It is necessary that the management of P in agricultural production takes into account legacy P that comes by past huge input of P fertilizers. Through ongoing soil fertility monitoring, maintenance of legacy P concentrations in an appropriate range and revised P inputs for crop needs, such as P equilibrium fertilization (Verloop et al. 2010), using soil testing have future applicability for P resource management and reduction of excess P.
The K balance and use efficiency are complex. Although a larger K balance was observed in vegetables and orchard crops than paddy rice, the K use efficiency in these crops was higher than paddy rice (Fig. 8) than the other crops. There are various challenges in the evaluation of K application and management. The approaches to K management would conform to those for P management, namely, set the application rate according to the K availability in farmland soils. Kubotera (2022) generated a guideline for K management on paddy rice using soil K availability. As a high K balance and low K use efficiency were observed in this study, such a method would be reasonable.
CONCLUSION
There continues to be insufficient information and suitable fertilizer use methods for N application, and P and K management for maintaining appropriate concentrations in farmland soils. Technological countermeasures for the overuse of fertilizer resources, such as excessive N application for teas and vegetables, are being developed. Past approaches have been a result of socioeconomic factors to minimize production costs. Future progress will address conservation of soil, water, and air, and improved health of crops in both agricultural and natural environments.
At present, a reduction in chemical NPK fertilizer use in Japan with minimal impacts on crop yield according to the goals of “Strategy for Sustainable Food Systems” have not been realized. It is possible that manure applications in this study are over-estimated; however, livestock manure is in short supply in Japan on a national scale. Notably, the impact of organic farming on managing soil nutrients is not addressed in this work, and there has generally been not sufficient scientific research on crop production and fertilization by means of organic agriculture.
Regardless, under the “Strategy for Sustainable Food Systems,”, diverse information and technologies are anticipated to be generated through various research efforts. Research has been conducted on reducing negative environmental effects; however, fertilizer resource management strategies should incorporate further sustainability and intensification of agricultural production.
ACKNOWLEDGEMENT
I am deeply grateful to the staff of the agricultural experimental stations in 47 prefectures for the data collection for “Basic Soil Environment Monitoring Project, Stationary Monitoring” and “Assessment and Extension of Technologies for Mitigating Greenhouse Gas Emissions from Agricultural Soil”. The information and viewpoints regarding fertilizer resources are supported by the Phosphorus Industry Development Organization, Japan.
REFERENCES
Furuya O. (2006) Survey of Livestock Manure at Compost Center in Japan. Livestock Science,59, 1181-1183. (In Japanese)
Hokkaido (2020) Hokkaido Fertilization Guide. PDF at https://www.harp.lg.jp/opendata/dataset/1056/resource/4481/source-url (in Japanese)
Kohyama K., M Hojito,H. Sasaki and S. Matsuura. (2006) Estimation of the Amount of Nutrients in Livestock Manure Jpn. J. Soil Sci. Plant Nutr.:77, 283-291. (In Japanese with English summary)
Kubotera H. (2022) Guidelines for proper application of potash in paddy rice based on the potash balance of soil for lowland paddy fields Standard work procedure manual. https://www.naro.go.jp/publicity_report/publication/laboratory/naro/sop/... (In Japanese)
Ministry of Agriculture, Forestry and Fisheries (MAFF) (1982a) Livestock Production Cost. MAFF, Tokyo (In Japanese)
MAFF (1982b) Paddy Rice and Wheat Variety Production Cost. MAFF, Tokyo (In Japanese)
MAFF (1982c) Pocket Fertilizer Handbook. MAFF, Tokyo (In Japanese)
MAFF (1982d) Quality of Organic Fertilizers and Manures in Japan. MAFF, Tokyo (In Japanese)
MAFF (1987a) Livestock Production Cost. MAFF, Tokyo (In Japanese)
MAFF (1987b) Paddy Rice and Wheat Variety Production Cost. MAFF, Tokyo (In Japanese)
MAFF (1987c) Pocket Fertilizer Handbook. MAFF, Tokyo (In Japanese)
MAFF (1992a) Livestock Production Cost. MAFF, Tokyo (In Japanese)
MAFF (1992b) Paddy Rice and Wheat Variety Production Cost. MAFF, Tokyo (In Japanese)
MAFF (1992c) Pocket Fertilizer Handbook. MAFF, Tokyo (In Japanese)
MAFF (1997a) Livestock Production Cost. MAFF, Tokyo (In Japanese)
MAFF (1997b) Paddy Rice and Wheat Variety Production Cost. MAFF, Tokyo (In Japanese)
MAFF (1997c) Pocket Fertilizer Handbook. MAFF, Tokyo (In Japanese)
MAFF (2002a) Livestock Production Cost. MAFF, Tokyo (In Japanese)
MAFF (2002b) Paddy Rice and Wheat Variety Production Cost. MAFF, Tokyo (In Japanese)
MAFF (2002c) Pocket Fertilizer Handbook. MAFF, Tokyo (In Japanese)
MAFF (2006) Basic Direction of Soil Fertility Improvement. PDF at https://www.maff.go.jp /pdf/dojo_tiryoku-2 (In Japanese)
MAFF (2012a) Livestock Production Cost. MAFF, Tokyo (In Japanese)
MAFF (2012b) Paddy Rice and Wheat Variety Production Cost. MAFF, Tokyo (In Japanese)
MAFF (2012c) Pocket Fertilizer Handbook. MAFF, Tokyo (In Japanese)
MAFF (2021) Strategy for Sustainable Food Systems. https://www.maff.go.jp/e/policies/env/env_policy/meadri.html
MAFF (2022) Real Time Diagnosis on Crops Need Additional Fertilizer http://www.maff.go.jp/hozen_type/pdf/siryo8
Ministry of Education, Culture, Sports, Science and Technology (2017) Food Nutrition Standard. Kanpo Kyodo Publishing, Tokyo (in Japanese)
Matsumoto T., Y. Kimurra, K. Takahashi and M. Hojito (2006) The Behavior of the Fertilizer Nutrients of Barnyard Manure Covered with a Sheet. Jpn.J.Soil Sci,Plant Nutr.: 77, 395-400 (In Japanese with English summary)
Matsuzaka H. and J. Kurihara (1998) Soil, Plan Nutrition and Environment, Hakuyusha, Tokyo (In Japan)
Mishima S. (2001) Recent trend of nitrogen flow associated with agricultural production in Japan. Soil Sci. Plant Nutri: 47, 157-166.
Mishima S., A. Leon, S. Eguchi and Y. Shirato (2017) Livestock Waste, Potential Manure Production and Its Use in Japan in 1980 and 2010. Compost Science and Utilization: 25, 543-552.
Mishima S., S. Itahashi, R. Kimura, and T. Inoue (2003) Trends of phosphate fertilizer demand and phosphate balance in farmland soils in Japan. Soil Sci Plant Nutri: 49, 39-45.
Nishio M. (2001) Analysis of the Actual State of Nitrogen Application in Arable Farming in Japan. Jpn. J. Soil Sci. Plant Nutr.: 72. 513-521 (In Japanese with English summary)
Obara H. and M. Nakai (2004) Changes of Soil Characteristic in Japanese Arable Lands (II). Jpn. J. Soil Sci. Plant Ntri.: 75, 59-67. (In Japanese with English summary)
Ogino A., H. Murakami, T. Yamashita, M. Furuya, H. Kawahara, T. Ohkubo and T. Osada (2017) Estimation of nutrient excretion factors of broiler and layer chickens in Japan. Animal Science Journal: 88, 659-668.
Sotome T., M. Fujita, N. Gunji, Y. Ogawa, A. Shiraishi, S. Kobayashi, Y. Takahashi and T.Yoshida (2010) Present Problems and Future Improvement of Malting Barley Production in Nasu, Tochigi Prefecture. Jpn. J. Crop Sci.: 79, 528―535 (In Japanese with English summary)
Takahashi T. and A. Nakano (2011) Research topics on roots for improving Japan's food self-sufficiency rate and environmental conservation. Root Research 20: 49-59 (In Japanese with English summary)
Verloop J, J. Oenema, S. L. G. Burgers, H. F. M. Aarts and H. van Keulen (2010) P-equilibrium fertilization in an intensive dairy farming system: effects on soil-P status, crop yield and P leaching. Nutrient Cycling in Agroecosystems volume 87: 369–382
Yamamoto F and T Matusmaru (2007) Reduction of Top Dressed Nitrogen Based on Nitrate Diagnosis of Tomato (Solanun lycopersicum L .) Petiole Sap Grown in Graft Culture. Jpn Soil Sci Plant Nutri. 78, 391-294. (In Japanese with English summary)
Yano K., H. Ikeuchi and K. Kawata (2010) Influence of the Kind of Soil at Tea Field and Amount of Nitrogen Fertilizer on Yield and Quality of Tea, and on Utilization Rate of Applied Nitrogen Fertilizer. Kagawa Agricultural Research Station Research Reprot: 61, 63-70. (In Japanese with English summary)