ABSTRACT
This study aimed to find out the socio-economic status of rice farmers; to determine the knowledge and attitude towards certified rice seeds and to analyze the financial profitability of rice production. A total of 133 sample farmers were selected from 5 villages in Lewe Township by using the random sampling method, in which 68 adopters and 65 non-adopters were conducted personal interview with a set of structured interview schedule. The collected data included personal, socio-economic, psychological, institutional factors and input and output factors of current rice production. The institutional and psychological factors were measured by 3-points and 5-points Likert scale. The data were analyzed by mean statistics, descriptive statistics, cost and return analysis using Stata version 14. According to the cost and return analysis, in the adopters, the return above total variable cash cost US$469.04, the return above total variable cost US$428.01, return per unit of cash expensed (2.1) and the return per unit of capital invested (1.9) were observed; whereas, in the non-adopters, the return above total variable cash cost US$218.15, the return above total variable cost US$135.83, return per unit on cash expensed (1.6) and the return per unit on capital invested (1.3) were observed. According to the results of knowledge index, most adopters have medium and high knowledge levels. The t-test showed that there were highly significant differences in the average knowledge index value between two groups at 1% level. In investigating the attitude index, most adopters have medium and high attitude levels. The t-test showed that there were highly significant differences in the average attitude index value between two groups at 1% level. It can be concluded that knowledge may influence adoption: farmers who have adequate knowledge of use of certified rice seeds are likely to adopt it and increase their income. Therefore, by promoting greater knowledge of certified rice seeds, the better grain quality, higher yield and lower seed rate technology can contribute to the farmers to perceive higher gross benefit.
Keywords: certified rice seeds, knowledge, attitude, adoption, cost and returns, Myanmar
INTRODUCTION
Rice is a major food source for the growing world population. Because of its adaptability, rice can be grown almost anywhere and can easily be distributed to any part of the world (Miah et al. 2004). Myanmar has a basic rice cultivation system which most farmers are familiar with. The main source of income in rural areas is rice production (Lwin, 2017). Rice yield in Myanmar (3.97 ton/ha) is very low compared to China (6.95 ton/ha), Japan (6.94 ton/ha) and Vietnam (5.84 ton/ha) (FAOSTAT, 2019). This may be caused by many factors. One of the reasons is due to low quality seeds and inadequate supply of seeds. Seeds often play an important role in the local agricultural systems, in which seeds are re-used, exchanged and bartered. Approximately 80–90% of all planting materials used are largely sourced from farmers’ own-saved seeds or the informal seeds sector which involves saving seeds from its own harvest, and using seeds for re-sowing, sharing, exchanging, bartering and selling (MOALI, 2016).
Agricultural productivity growth will not be possible without the development and dissemination of low-cost and yield-enhancing technologies, as it will no longer be possible to meet the needs of a growing number of people through acreage expansion (Ravallion and Datt, 1996). Most notable of all the various efforts to increase rice productivity is the development and diffusion of quality seeds for improved rice varieties. Because the seeds are the most important input factor in agriculture and the yield and the quality of the harvest depend to a large extent on the quality of the seeds sown (Adekoya and Babaleye, 2009).
The uses of new seed varieties are important and beneficial to the productivity of rice. Therefore, farmers should have the right knowledge, attitude and skills when introducing new varieties of seeds to ensure that the seeds' potential contributes to their productivity. Knowledge influences adoption; farmers with sufficient knowledge of technology are likely to adopt it (Abebaw and Belay, 2001). Adoption of quality seeds is important because the properties of seeds obtained by the farmer degenerate over several seasons of use. Sustained benefits from variety adoption therefore require the farmer to know about and adopt quality seeds in order to receive these benefits (Rogers, 2005).
In addition, many farmers still do not see significant price differences between rice produced from uncertified and certified seeds, while certified seeds generally have higher seed price. This has become the main constraint for the acceptance of quality seeds. Accordingly, a thorough evaluation of seed quality is essential to identify the likely reasons for limiting the overall performance of rice production and marketing, and to find concrete workable solutions. For this very critical reason, the study attempted to; 1) identify the socio-economic characteristics of farmers; 2) examine knowledge about and attitude towards certified rice seeds, and 3) analyze the profitability of rice production in the study area.
RESEARCH METHODOLOGY
Description of the study area
The study area, Lewe Township is located in Dekkhinathiri district, Nay Pyi Taw Union Territory area, Myanmar. This research area was purposively selected on the basis of rice cultivating area. It is one of the major rice producing Townships in Nay Pyi Taw Union Territory area. In the study area, rice cultivation covered about 15,001 hectares during the 2019-2020 rainy seasons (DoA, 2019). There are only about 31 seed producing farmers who deal with a seed grower association. In addition, cultivated cropping systems are based on rice cultivation, whereas farmers can only use quality seeds in some varieties of rice.
Data collection
Both primary and secondary sources of data were used in this study. The primary information was gathered by household interview technique by using a set of structured questionnaires in January 2020. The sample size was determined by using the formula which was developed by Yamane (1967) as follows:
n = N / (1 + Ne2) = 974 / [1+974(0.1)2] = 91
Where, n = sample size
N =Population of rice farmers
e = level of precision which is 0.1
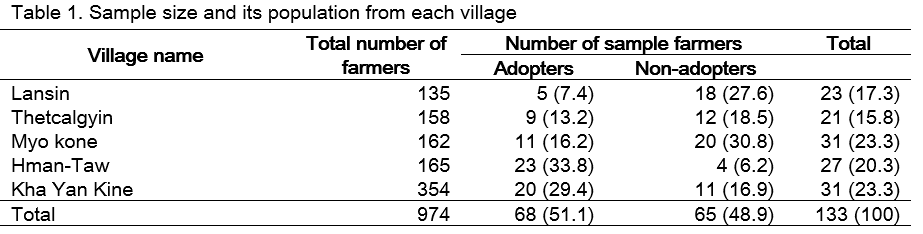
According to this formula, the study needed only samples of 91 but 133 respondents were surveyed. As shown in Table 1, a total of 133 sampled farmers were selected by using random sampling technique from five villages, namely: Lansin, Thetcalkyin, Myokone, Hmantaw and Khayankine villages in Lewe Township. Among the sampled farmers, 68 adopters and 65 non-adopters were interviewed with a set of structured interview schedule. Detailed socio-economic data such as gender, farmers' age, education level, number of family members, number of farm family labor, farm size, farming materials assets and the extension access, cost and returns and credit availability were inquired.
The secondary data were collected from the local Township and village level government and non-government organizations related to agriculture and administration. Secondary data sources were published and they were sourced from the official records of the Ministry of Agriculture, Livestock and Irrigation (MoALI), the Department of Planning (DoP), Department of Agricultural Research (DAR), Department of Agriculture (DoA, Lewe Township Office), Food and Agriculture Organization (FAO), Central Statistical Organization (CSO) and the other related publications.
Data analysis
The data were analyzed by using frequency distribution, enterprise budgeting, knowledge index and attitude index with the help of Microsoft office excel using Statistical Package for Social Science (SPSS) versions 25 and stata version 14. Mean, standard deviation, minimum, maximum, frequency and percentage were also used to reveal the knowledge and attitude of farmers towards adoption of certified rice seeds.
Index for knowledge towards rice production technology and certified rice seeds
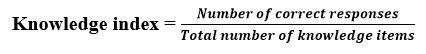
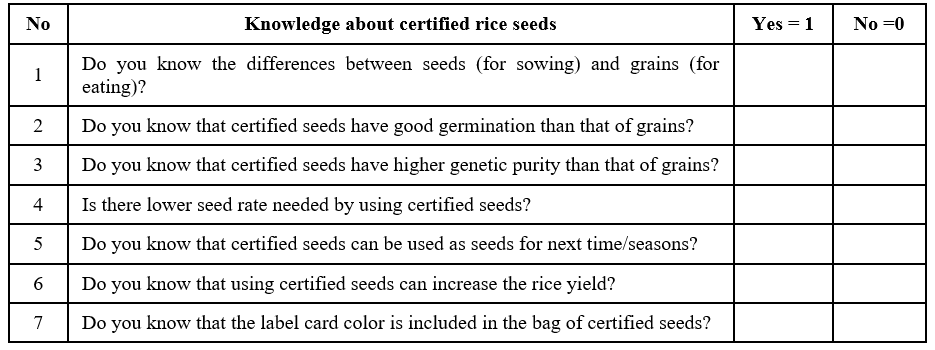
Knowledge is operationally defined as those behaviors and test situations which emphasized the recall of ideas and material on some phenomenon (Bloom, 1956). The knowledge of the respondents regarding the recommended technology was measured by using structured schedule for rice production farmers, consisting of questions which were prepared after thorough references from the recommended practices, information and discussions with experts in the respective fields. A total of seven knowledge items relating to rice production were selected for the purpose and each practice and information was put in the question form to the respondents to obtain their responses. The answers elicited from the respondents were quantified by assigning one score if “Yes” and zero if “No”. The score of all the individual items which were answered correctly by the respondents were summed up to get the knowledge score of the respondents. The maximum score a respondent could obtain is 7 and the minimum score is 0 with respect to knowledge items. The raw knowledge score of each individual respondent was converted into knowledge index by using the formula, which was formulated by (Savitha 1999).
Based on the index, the respondents were categorized into low, medium and high knowledge levels by considering mean and standard deviation as a check measure. The collected knowledge items were described as follows:
Index for Attitude towards Certified Rice Seeds
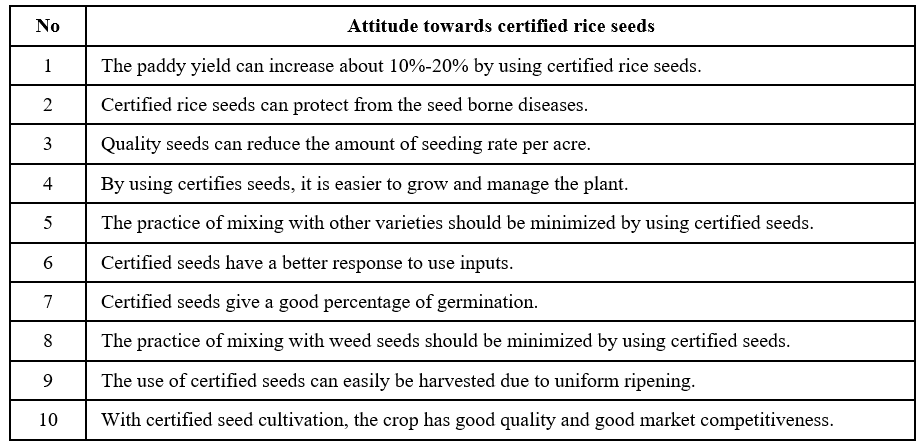
Attitude towards certified rice seeds were calculated as index score by using a set of questionnaires based on farmer's responses along with statements. The level of attitude on each given statement was scored accordingly to the orientation of the questions.
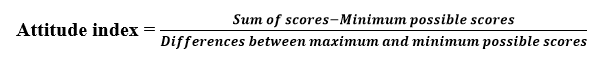
For instance, the options were shown, “Strongly Agree” was scored as “5 point”, “Agree” was scored as “4 point”, “3 point” for “Undecided”, “2 point” for “Disagree” “1 point” for “Strongly Disagree”. Then the respondents‟ actual scores were summed and attitude index were calculated by using the following formula (Hubert and Schultz, 1976).
Based on the index value, the respondents were categorized into low, medium and high attitude levels by considering mean and standard deviation as a measure of check. The collected attitude items were described as follows:
Cost and return analysis
The cost and return analysis was used to assess the profitability of rice production in the study area on an average basis. In order to estimate gross return for respective crops, average yield and average price were used. Benefit cost ratio was used as profitability measures for each crop enterprise by computing total gross margin or return above variable cost and return above cash costs. Input quantities and values used in production process (costs) and output quantities and values (benefits) are the basic data required for budgets. Hired labor costs were valued by market wage rates and man days used in all farming practices. The interest was normally charged on cash expense in the growing season.
In this analysis, the variable cost of the rice production was divided into five categories as follows:
- Material cost (owned),
- Material cost (cashed),
- Hired labor cost,
- Family labor cost and
- Interest on cash cost.
The first measurement was the difference between the total gross benefits or total returns and total variable cash costs; excluding opportunity costs. This value was referred to as “return above variable cash cost”. The second measurement was deduction of the opportunity cost and total variable cash cost from gross benefit. This return was referred to as “return above variable cost” or “gross margin”. The “return per unit of capital invested” was calculated by gross benefit per total variable cost. The “return per unit of cash cost expensed” was calculated by gross benefit per total cash cost (Olson, 2004).
These measurements could be expressed with equations as:
Measurement (1)
Return above variable cash cost = Total gross benefit – Total variable cash cost
Measurement (2)
Return above variable cost (Gross margin) = Total gross benefit – Total variable cost
Measurement (3)
Return per unit of capital invested = Total gross benefit/ Total variable cost
Measurement (4)
Return per unit cash cost = Total gross benefit/ Total cash cost
RESULTS AND DISCUSSIONS
Socio-economic characteristics of the sample farmers in the study area
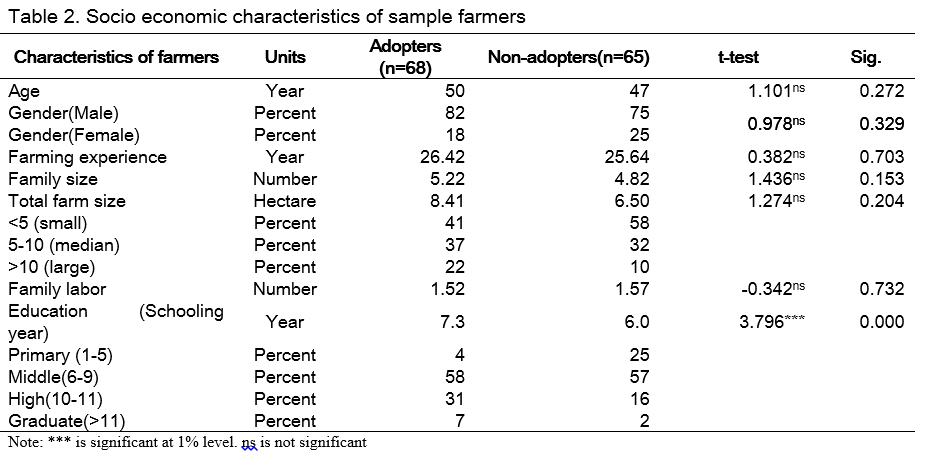
Socio-economic factors have several implications on the adoption of new agricultural technologies and practices. The socio-economic characteristics of sample farmers play a role as the main factors that influence the adoption of certified rice seeds. As shown in Table 2, the average age of non-adopters was 47 and that of adopters was 50. The t-test showed that there was no significant difference in the average age of these two groups. In the gender composition of sample farmers in the study area, the majority of sample farmers were male but included only a few female farmers. Among total sample farmers, 82% of adopters and 75% of non-adopters were male and 18% of adopters and 25% of non-adopters were female. Therefore, the average gender ratios are similar in both groups. It was also found that the non-adopter’s farm experience in agriculture was an average of 25.64 years while adopters were 26.42 years. The t-test showed that there was no significant difference in the average numbers of farming experience between two groups.
The average family size of adopters was 5.22 and non-adopters’ sample farmers was 4.82 members. The t-test showed that there was no significant difference in the average numbers of family members of these two groups. The average family labor of adopters and non-adopters were 1.52 and 1.57 respectively. The t-test showed that there was no significant difference in the average numbers of family labor force between two groups. In this study, the average farm size owned by adopters was 8.41 hectares and non-adopters were 6.50 hectares. The t-test showed that there was no significant difference in the average area of farm size owned between two groups.
The level of education of the farmers is one of the important factors for decision making of adoption of improved varieties. In this study, education level was considered with schooling years. Education level of the sample farmers was categorized into four groups: "Primary level" referred to formal schooling from 1 to 5 years; "Secondary level" intended formal schooling from 6 to 9 years; "High school level" referred to the formal schooling from 10 to 11 years; and “University level and Graduate” referred to formal schooling above 11 years. The schooling year (education) is the number of years which was attended to formal schooling. The adopters' schooling years were a mean of 7.3 years while a non-adopters' schooling year was a mean of 6.0 years. The means of schooling years were significantly different between the adopters and non-adopters at 1% level. Both 4% of adopters and 25% of non-adopters were in the primary education, while 58% adopters and 57% non-adopters were having middle education. Also 31% adopters and 16% non-adopters had high education while 7% adopters and 2% non-adopters were graduated persons, respectively. According to the results, the study revealed that majority of adopter and non-adopter farmers were having educated with secondary and high school education level (6-11 years of education level), respectively.
Knowledge index
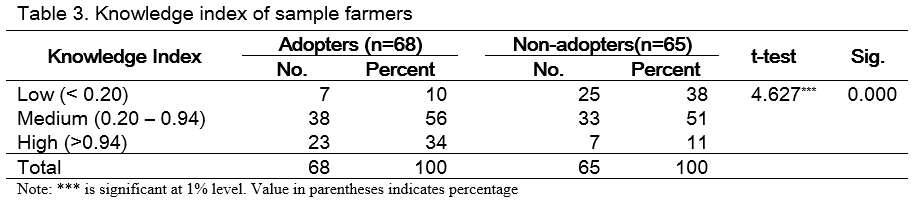
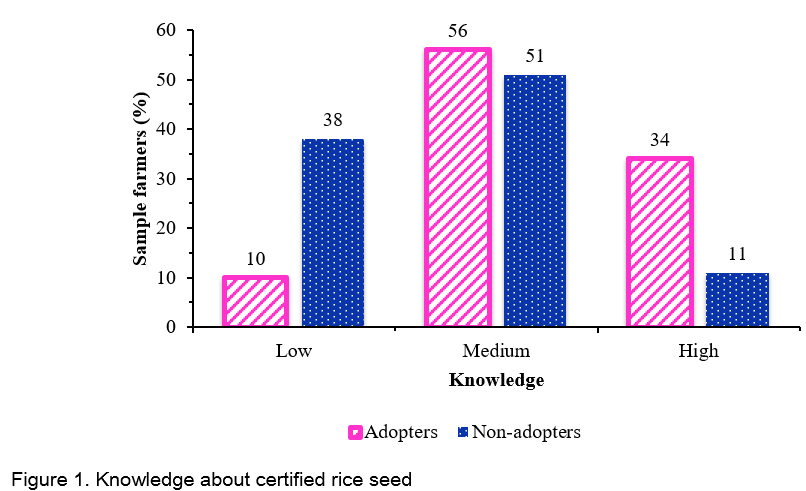
Farmers must be equipped with knowledge related to certain technologies in order to be effective in agricultural production. Knowledge is examined as a body of understanding in farmers' information possessed by an individual about certified rice seeds. A set of 7 items was included in the interview schedule to test the knowledge level of respondents. Level of knowledge of farmers was measured with the help of knowledge index developed through certified rice seeds of actual score perceived and 7 maximum score allotted. After obtaining the knowledge score for each of the farmers, they were differentiated into three categories taking minimum and maximum scores as the points of discrimination. From Table 3, it could be found that 34% of adopters had high level of knowledge about certified rice seeds followed by 56% medium and 10% low level of knowledge about certified rice seeds. On the other hand, 11% of non-adopters had high level of knowledge about certified rice seeds whereas medium and low knowledge level had 51% and 38% respectively. The t-test showed that there were highly significant differences in the average knowledge index value between two groups at 1% level. This finding is in line with the result of (Nazuri et al. 2018) and confirmed that knowledge contributes a significant value and a positive strength of towards adoption on new paddy seed varieties.
Attitude index
Attitude is defined as the degree of positive or negative impact associated with a psychological object. The emotional reactions normally expressed to the cultivation of certified rice seeds. In this study, attitudes are the degrees of positive or negative attitudes of farmers towards the certified seed cultivation.
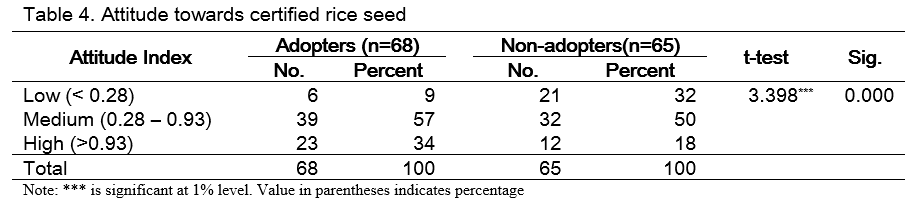
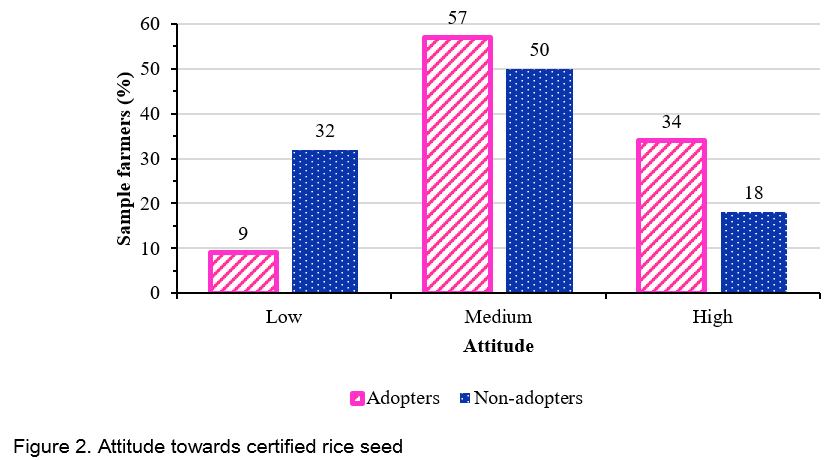
With respect to attitude of the farmers it was observed from Table 4 indicates that, 34% of the adopters' sample farmers had high attitude towards certified seed cultivation. Whereas; 57% and 9% of the adopters' farmers towards certified seed cultivation had median and low attitude, respectively. On the other hand, 18% of non-adopters' farmers had high attitude on certified rice seeds while 50% and 32% of non-adopters' sample farmers were median and low attitude towards certified rice seed cultivation. The t-test showed that there were highly significant differences in the average attitude index value between two groups at 1% level. This finding is compared with the result of (Chilonda and Huylenbroeck, 2001) and confirmed that farmers' attitudes determine adoption of improved technology.
Enterprise budget for certified rice seed cultivation of adopters and non-adopters in the study area
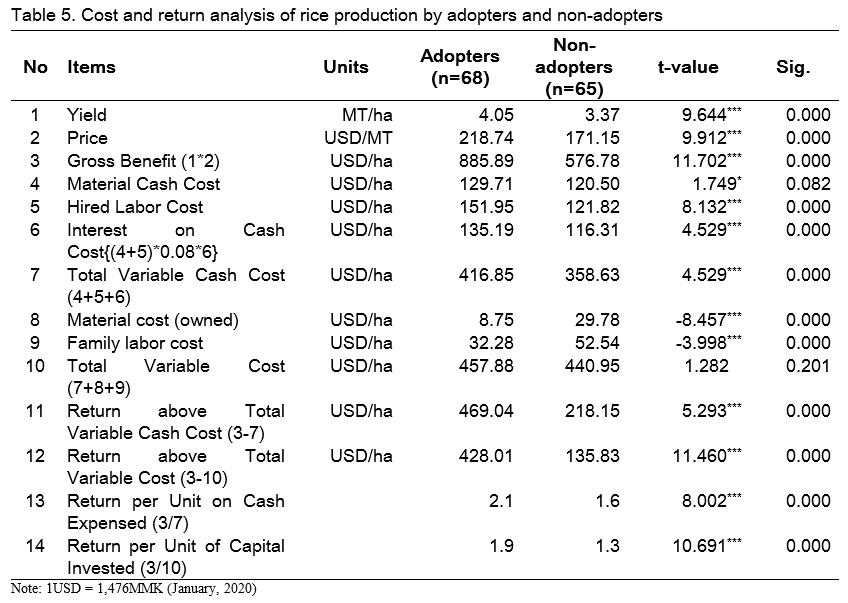
The cost and return analyses of certified rice seed cultivation by adopters and non-adopters are indicated in Table 5. Total variable costs were US$457.88 /ha in adopters and US$440.95/ha in non-adopters. Adopters' expensed hired labor cost of US$151.95 /ha while non-adopters expensed hired labor cost of US$121.82 /ha. Among total variable cash costs, total material cash cost was US$129.71/ha in adopters and US$120.50 /ha in non-adopters.
In addition, the average rice yield in non-adopters 3.37 MT/ha was apparently lower than that of adopters 4.05 MT/ha. The average number of price in non-adopters US$171.15 /MT was obviously lower than that of adopters US$218.74 /MT. Therefore, total gross benefit of non-adopters US$576.78 /ha was significantly lower than that of adopters US$885.89 /ha. Return per unit of cash expensed for non-adopters and adopters were 1.6 and 2.1 respectively. The benefit and cost ratio of non-adopters and adopters were 1.3 and 1.9 respectively. It means that the adopters earned more profit from certified rice seed cultivation and they could get higher profit compared to the non-adopters if they invested a unit capital.
CONCLUSIONS
According to the results of knowledge index of sample farmers, the majority of adopters had adequate knowledge about certified rice seeds compared with non-adopters. In investigating the attitude index, most of adopters had medium and high attitude levels. These results revealed that adopters have positively attitude towards certified rice seed compared with non-adopters. In regarding to the results of cost and return analysis, adopters had higher profit in rice cultivation because of higher yield and price. It can be concluded that farmers could increase their income by adopting certified rice seeds that are superior in terms of yield and increasing their sales potential in seed/grain markets. Despite the advantage of adopting certified rice seed to increase revenue, the requirement for more labour input did stop those non-adopters from using certified seed. Therefore, extension officers also would find the necessary information for wide use of certified seeds by upgrading extension programs with labor saving technology.
On the basis of the survey results, the government should organize on-farm demonstrations to increase farmers' exposure to certified seeds. They should also sensitize farmers to the need for regular seed exchanges through extension and training programs. Raising the awareness and knowledge of farmers on the importance of certified seeds is a necessary step to increase farmers' demand for certified seeds. And also, agricultural seed producers (i.e., seed entrepreneurs) can have a competitive advantage in supplying seeds to their communities due to lower costs. To strengthen this semi-formal seed sector, additional efforts from the government, private seed companies and NGOs are needed to increase the capacities of small and medium seed producers (SMEs) and a corresponding quality assurance system for seeds. Ultimately, for these SMEs to play a larger role in the seed sector, they must have access to high quality, early generation seeds to reproduce and produce commercial seeds.
REFERENCES
Abebaw D, Belay K. 2001. Factors influencing adoption of high yielding maize varieties in Southwestern Ethiopia: An application of logit. QJ of Int Agric, 40, 149-167.
Adekoya A E, Babaleye T. 2009. Consistency of technology adoption among farmers in Northern Nigeria. Journal of Food, Agriculture & Environment, 7(3/4), 457-460.
Bloom B S. 1956. Taxonomy of educational objectives: The classification of educational goals. D. McKay.
Chilonda P, Van Huylenbroeck G. 2001. Attitude towards and uptake of veterinary services by small-scale cattle farmers in Eastern province, Zambia. Outlook on Agriculture, 30(3), 213-218. Retrieved from https://doi.org/10.1016/j.rsci.2017.10.003
FAO (Food and Agriculture Organization) 2019. Rice and water: along and diversified story [online]. International year of rice 2004. FAO, Rome, Italy. Retrieved from: http://www.fao.org/rice2004/en/fsheet/factsheet1.pdf.
Hubert L, Schultz J. 1976. Quadratic assignment as a general data analysis strategy. British journal of mathematical and statistical psychology, 29(2), 190-241.
Likert R. 1932. A techiques for the measurement of attitudes. Archives of psychology.
Lwin C M. 2017. Profitability and labor use efficiency of Different Rice Varieties with Different Crop Establishment Methods in Maubin and Daik U Townships (Master Thesis, Yezin Agricultural University, Myanmar).
Miah M N H, Talukder S, Sarkar M A R, Ansari T H. 2004. Effect of number of seedling per hill and urea super granules on growth and yield of the rice cv. BINA dhan4. J. Biol. Sci, 4(2), 122-129.
Ministry of Agriculture and Irrigation (MoAI). 2013. Activities of Department of Agriculture, Republic of the Union of Myanmar.
MOALI. (Ministry of Agriculture, Livestock and Irrigation) 2016. Myanmar Agriculture in Brief. Ministry of Agriculture, Livestock and Irrigation, Nay Pyi Taw, Union of Myanmar.
MOALI. (Ministry of Agriculture, Livestock and Irrigation) 2017. Road map for Myanmar's seed sector (2017-2020). Ministry of Agriculture, Livestock and Irrigation, Nay Pyi Taw, Union of Myanmar. Retrieved from http://www.myanmarseedportal.gov.mm/en/publications/road-map-action-agenda
MOALI. (Ministry of Agriculture, Livestock and Irrigation) 2019. Myanmar Agriculture in Brief. Ministry of Agriculture, Livestock and Irrigation, Nay Pyi Taw, Union of Myanmar.
Nazuri N, Man N, Saufe A, Nazuri S. 2018. Knowledge, attitude and skills of farmers on adoption of new paddy seed varieties in Muda Area, Kedah. IOSR Journal of Humanities and Social Science, 23(8), 64-69.
Olson K D. 2004. Farm Management: Principles and Strategy. The textbook of Farm Management: Principles and Strategies. (1st ed.) Iwa State Press.
Ravallion M, Datt G. 1996. How important to India's poor is the sectoral composition of economic growth? The World Bank Economic Review, 10(1), 1-25.
Rogers A. 2005. Non-formal education. Springer science and Business media. Inc.
Rogers E M. 1983. Diffusion of innovations (3rd ed). New York : London: Free Press ; Collier Macmillan.
Rogers E M. 2003. Diffusion of innovations (5th ed). Simon and Schuster.
Rogers E M. 2010. Diffusion of Innovations, (4th ed). Simon and Schuster.
Savitha C M. 1999. Impact of training on knowledge, attitude and symbolic adoption of value added products of ragi by farm women (Doctoral dissertation, University Of Agricultural Sciences Gkvk Bangalore).
Yamane T. 1967. Problems to accompany" Statistics, an introductory analysis". Harper & Row.


Knowledge and Attitude of Farmers towards Adoption of Certified Rice Seeds in Lewe Township, Nay Pyi Taw, Myanmar
ABSTRACT
This study aimed to find out the socio-economic status of rice farmers; to determine the knowledge and attitude towards certified rice seeds and to analyze the financial profitability of rice production. A total of 133 sample farmers were selected from 5 villages in Lewe Township by using the random sampling method, in which 68 adopters and 65 non-adopters were conducted personal interview with a set of structured interview schedule. The collected data included personal, socio-economic, psychological, institutional factors and input and output factors of current rice production. The institutional and psychological factors were measured by 3-points and 5-points Likert scale. The data were analyzed by mean statistics, descriptive statistics, cost and return analysis using Stata version 14. According to the cost and return analysis, in the adopters, the return above total variable cash cost US$469.04, the return above total variable cost US$428.01, return per unit of cash expensed (2.1) and the return per unit of capital invested (1.9) were observed; whereas, in the non-adopters, the return above total variable cash cost US$218.15, the return above total variable cost US$135.83, return per unit on cash expensed (1.6) and the return per unit on capital invested (1.3) were observed. According to the results of knowledge index, most adopters have medium and high knowledge levels. The t-test showed that there were highly significant differences in the average knowledge index value between two groups at 1% level. In investigating the attitude index, most adopters have medium and high attitude levels. The t-test showed that there were highly significant differences in the average attitude index value between two groups at 1% level. It can be concluded that knowledge may influence adoption: farmers who have adequate knowledge of use of certified rice seeds are likely to adopt it and increase their income. Therefore, by promoting greater knowledge of certified rice seeds, the better grain quality, higher yield and lower seed rate technology can contribute to the farmers to perceive higher gross benefit.
Keywords: certified rice seeds, knowledge, attitude, adoption, cost and returns, Myanmar
INTRODUCTION
Rice is a major food source for the growing world population. Because of its adaptability, rice can be grown almost anywhere and can easily be distributed to any part of the world (Miah et al. 2004). Myanmar has a basic rice cultivation system which most farmers are familiar with. The main source of income in rural areas is rice production (Lwin, 2017). Rice yield in Myanmar (3.97 ton/ha) is very low compared to China (6.95 ton/ha), Japan (6.94 ton/ha) and Vietnam (5.84 ton/ha) (FAOSTAT, 2019). This may be caused by many factors. One of the reasons is due to low quality seeds and inadequate supply of seeds. Seeds often play an important role in the local agricultural systems, in which seeds are re-used, exchanged and bartered. Approximately 80–90% of all planting materials used are largely sourced from farmers’ own-saved seeds or the informal seeds sector which involves saving seeds from its own harvest, and using seeds for re-sowing, sharing, exchanging, bartering and selling (MOALI, 2016).
Agricultural productivity growth will not be possible without the development and dissemination of low-cost and yield-enhancing technologies, as it will no longer be possible to meet the needs of a growing number of people through acreage expansion (Ravallion and Datt, 1996). Most notable of all the various efforts to increase rice productivity is the development and diffusion of quality seeds for improved rice varieties. Because the seeds are the most important input factor in agriculture and the yield and the quality of the harvest depend to a large extent on the quality of the seeds sown (Adekoya and Babaleye, 2009).
The uses of new seed varieties are important and beneficial to the productivity of rice. Therefore, farmers should have the right knowledge, attitude and skills when introducing new varieties of seeds to ensure that the seeds' potential contributes to their productivity. Knowledge influences adoption; farmers with sufficient knowledge of technology are likely to adopt it (Abebaw and Belay, 2001). Adoption of quality seeds is important because the properties of seeds obtained by the farmer degenerate over several seasons of use. Sustained benefits from variety adoption therefore require the farmer to know about and adopt quality seeds in order to receive these benefits (Rogers, 2005).
In addition, many farmers still do not see significant price differences between rice produced from uncertified and certified seeds, while certified seeds generally have higher seed price. This has become the main constraint for the acceptance of quality seeds. Accordingly, a thorough evaluation of seed quality is essential to identify the likely reasons for limiting the overall performance of rice production and marketing, and to find concrete workable solutions. For this very critical reason, the study attempted to; 1) identify the socio-economic characteristics of farmers; 2) examine knowledge about and attitude towards certified rice seeds, and 3) analyze the profitability of rice production in the study area.
RESEARCH METHODOLOGY
Description of the study area
The study area, Lewe Township is located in Dekkhinathiri district, Nay Pyi Taw Union Territory area, Myanmar. This research area was purposively selected on the basis of rice cultivating area. It is one of the major rice producing Townships in Nay Pyi Taw Union Territory area. In the study area, rice cultivation covered about 15,001 hectares during the 2019-2020 rainy seasons (DoA, 2019). There are only about 31 seed producing farmers who deal with a seed grower association. In addition, cultivated cropping systems are based on rice cultivation, whereas farmers can only use quality seeds in some varieties of rice.
Data collection
Both primary and secondary sources of data were used in this study. The primary information was gathered by household interview technique by using a set of structured questionnaires in January 2020. The sample size was determined by using the formula which was developed by Yamane (1967) as follows:
n = N / (1 + Ne2) = 974 / [1+974(0.1)2] = 91
Where, n = sample size
N =Population of rice farmers
e = level of precision which is 0.1
According to this formula, the study needed only samples of 91 but 133 respondents were surveyed. As shown in Table 1, a total of 133 sampled farmers were selected by using random sampling technique from five villages, namely: Lansin, Thetcalkyin, Myokone, Hmantaw and Khayankine villages in Lewe Township. Among the sampled farmers, 68 adopters and 65 non-adopters were interviewed with a set of structured interview schedule. Detailed socio-economic data such as gender, farmers' age, education level, number of family members, number of farm family labor, farm size, farming materials assets and the extension access, cost and returns and credit availability were inquired.
The secondary data were collected from the local Township and village level government and non-government organizations related to agriculture and administration. Secondary data sources were published and they were sourced from the official records of the Ministry of Agriculture, Livestock and Irrigation (MoALI), the Department of Planning (DoP), Department of Agricultural Research (DAR), Department of Agriculture (DoA, Lewe Township Office), Food and Agriculture Organization (FAO), Central Statistical Organization (CSO) and the other related publications.
Data analysis
The data were analyzed by using frequency distribution, enterprise budgeting, knowledge index and attitude index with the help of Microsoft office excel using Statistical Package for Social Science (SPSS) versions 25 and stata version 14. Mean, standard deviation, minimum, maximum, frequency and percentage were also used to reveal the knowledge and attitude of farmers towards adoption of certified rice seeds.
Index for knowledge towards rice production technology and certified rice seeds
Knowledge is operationally defined as those behaviors and test situations which emphasized the recall of ideas and material on some phenomenon (Bloom, 1956). The knowledge of the respondents regarding the recommended technology was measured by using structured schedule for rice production farmers, consisting of questions which were prepared after thorough references from the recommended practices, information and discussions with experts in the respective fields. A total of seven knowledge items relating to rice production were selected for the purpose and each practice and information was put in the question form to the respondents to obtain their responses. The answers elicited from the respondents were quantified by assigning one score if “Yes” and zero if “No”. The score of all the individual items which were answered correctly by the respondents were summed up to get the knowledge score of the respondents. The maximum score a respondent could obtain is 7 and the minimum score is 0 with respect to knowledge items. The raw knowledge score of each individual respondent was converted into knowledge index by using the formula, which was formulated by (Savitha 1999).
Based on the index, the respondents were categorized into low, medium and high knowledge levels by considering mean and standard deviation as a check measure. The collected knowledge items were described as follows:
Index for Attitude towards Certified Rice Seeds
Attitude towards certified rice seeds were calculated as index score by using a set of questionnaires based on farmer's responses along with statements. The level of attitude on each given statement was scored accordingly to the orientation of the questions.
For instance, the options were shown, “Strongly Agree” was scored as “5 point”, “Agree” was scored as “4 point”, “3 point” for “Undecided”, “2 point” for “Disagree” “1 point” for “Strongly Disagree”. Then the respondents‟ actual scores were summed and attitude index were calculated by using the following formula (Hubert and Schultz, 1976).
Based on the index value, the respondents were categorized into low, medium and high attitude levels by considering mean and standard deviation as a measure of check. The collected attitude items were described as follows:
Cost and return analysis
The cost and return analysis was used to assess the profitability of rice production in the study area on an average basis. In order to estimate gross return for respective crops, average yield and average price were used. Benefit cost ratio was used as profitability measures for each crop enterprise by computing total gross margin or return above variable cost and return above cash costs. Input quantities and values used in production process (costs) and output quantities and values (benefits) are the basic data required for budgets. Hired labor costs were valued by market wage rates and man days used in all farming practices. The interest was normally charged on cash expense in the growing season.
In this analysis, the variable cost of the rice production was divided into five categories as follows:
The first measurement was the difference between the total gross benefits or total returns and total variable cash costs; excluding opportunity costs. This value was referred to as “return above variable cash cost”. The second measurement was deduction of the opportunity cost and total variable cash cost from gross benefit. This return was referred to as “return above variable cost” or “gross margin”. The “return per unit of capital invested” was calculated by gross benefit per total variable cost. The “return per unit of cash cost expensed” was calculated by gross benefit per total cash cost (Olson, 2004).
These measurements could be expressed with equations as:
Measurement (1)
Return above variable cash cost = Total gross benefit – Total variable cash cost
Measurement (2)
Return above variable cost (Gross margin) = Total gross benefit – Total variable cost
Measurement (3)
Return per unit of capital invested = Total gross benefit/ Total variable cost
Measurement (4)
Return per unit cash cost = Total gross benefit/ Total cash cost
RESULTS AND DISCUSSIONS
Socio-economic characteristics of the sample farmers in the study area
Socio-economic factors have several implications on the adoption of new agricultural technologies and practices. The socio-economic characteristics of sample farmers play a role as the main factors that influence the adoption of certified rice seeds. As shown in Table 2, the average age of non-adopters was 47 and that of adopters was 50. The t-test showed that there was no significant difference in the average age of these two groups. In the gender composition of sample farmers in the study area, the majority of sample farmers were male but included only a few female farmers. Among total sample farmers, 82% of adopters and 75% of non-adopters were male and 18% of adopters and 25% of non-adopters were female. Therefore, the average gender ratios are similar in both groups. It was also found that the non-adopter’s farm experience in agriculture was an average of 25.64 years while adopters were 26.42 years. The t-test showed that there was no significant difference in the average numbers of farming experience between two groups.
The average family size of adopters was 5.22 and non-adopters’ sample farmers was 4.82 members. The t-test showed that there was no significant difference in the average numbers of family members of these two groups. The average family labor of adopters and non-adopters were 1.52 and 1.57 respectively. The t-test showed that there was no significant difference in the average numbers of family labor force between two groups. In this study, the average farm size owned by adopters was 8.41 hectares and non-adopters were 6.50 hectares. The t-test showed that there was no significant difference in the average area of farm size owned between two groups.
The level of education of the farmers is one of the important factors for decision making of adoption of improved varieties. In this study, education level was considered with schooling years. Education level of the sample farmers was categorized into four groups: "Primary level" referred to formal schooling from 1 to 5 years; "Secondary level" intended formal schooling from 6 to 9 years; "High school level" referred to the formal schooling from 10 to 11 years; and “University level and Graduate” referred to formal schooling above 11 years. The schooling year (education) is the number of years which was attended to formal schooling. The adopters' schooling years were a mean of 7.3 years while a non-adopters' schooling year was a mean of 6.0 years. The means of schooling years were significantly different between the adopters and non-adopters at 1% level. Both 4% of adopters and 25% of non-adopters were in the primary education, while 58% adopters and 57% non-adopters were having middle education. Also 31% adopters and 16% non-adopters had high education while 7% adopters and 2% non-adopters were graduated persons, respectively. According to the results, the study revealed that majority of adopter and non-adopter farmers were having educated with secondary and high school education level (6-11 years of education level), respectively.
Knowledge index
Farmers must be equipped with knowledge related to certain technologies in order to be effective in agricultural production. Knowledge is examined as a body of understanding in farmers' information possessed by an individual about certified rice seeds. A set of 7 items was included in the interview schedule to test the knowledge level of respondents. Level of knowledge of farmers was measured with the help of knowledge index developed through certified rice seeds of actual score perceived and 7 maximum score allotted. After obtaining the knowledge score for each of the farmers, they were differentiated into three categories taking minimum and maximum scores as the points of discrimination. From Table 3, it could be found that 34% of adopters had high level of knowledge about certified rice seeds followed by 56% medium and 10% low level of knowledge about certified rice seeds. On the other hand, 11% of non-adopters had high level of knowledge about certified rice seeds whereas medium and low knowledge level had 51% and 38% respectively. The t-test showed that there were highly significant differences in the average knowledge index value between two groups at 1% level. This finding is in line with the result of (Nazuri et al. 2018) and confirmed that knowledge contributes a significant value and a positive strength of towards adoption on new paddy seed varieties.
Attitude index
Attitude is defined as the degree of positive or negative impact associated with a psychological object. The emotional reactions normally expressed to the cultivation of certified rice seeds. In this study, attitudes are the degrees of positive or negative attitudes of farmers towards the certified seed cultivation.
With respect to attitude of the farmers it was observed from Table 4 indicates that, 34% of the adopters' sample farmers had high attitude towards certified seed cultivation. Whereas; 57% and 9% of the adopters' farmers towards certified seed cultivation had median and low attitude, respectively. On the other hand, 18% of non-adopters' farmers had high attitude on certified rice seeds while 50% and 32% of non-adopters' sample farmers were median and low attitude towards certified rice seed cultivation. The t-test showed that there were highly significant differences in the average attitude index value between two groups at 1% level. This finding is compared with the result of (Chilonda and Huylenbroeck, 2001) and confirmed that farmers' attitudes determine adoption of improved technology.
Enterprise budget for certified rice seed cultivation of adopters and non-adopters in the study area
The cost and return analyses of certified rice seed cultivation by adopters and non-adopters are indicated in Table 5. Total variable costs were US$457.88 /ha in adopters and US$440.95/ha in non-adopters. Adopters' expensed hired labor cost of US$151.95 /ha while non-adopters expensed hired labor cost of US$121.82 /ha. Among total variable cash costs, total material cash cost was US$129.71/ha in adopters and US$120.50 /ha in non-adopters.
In addition, the average rice yield in non-adopters 3.37 MT/ha was apparently lower than that of adopters 4.05 MT/ha. The average number of price in non-adopters US$171.15 /MT was obviously lower than that of adopters US$218.74 /MT. Therefore, total gross benefit of non-adopters US$576.78 /ha was significantly lower than that of adopters US$885.89 /ha. Return per unit of cash expensed for non-adopters and adopters were 1.6 and 2.1 respectively. The benefit and cost ratio of non-adopters and adopters were 1.3 and 1.9 respectively. It means that the adopters earned more profit from certified rice seed cultivation and they could get higher profit compared to the non-adopters if they invested a unit capital.
CONCLUSIONS
According to the results of knowledge index of sample farmers, the majority of adopters had adequate knowledge about certified rice seeds compared with non-adopters. In investigating the attitude index, most of adopters had medium and high attitude levels. These results revealed that adopters have positively attitude towards certified rice seed compared with non-adopters. In regarding to the results of cost and return analysis, adopters had higher profit in rice cultivation because of higher yield and price. It can be concluded that farmers could increase their income by adopting certified rice seeds that are superior in terms of yield and increasing their sales potential in seed/grain markets. Despite the advantage of adopting certified rice seed to increase revenue, the requirement for more labour input did stop those non-adopters from using certified seed. Therefore, extension officers also would find the necessary information for wide use of certified seeds by upgrading extension programs with labor saving technology.
On the basis of the survey results, the government should organize on-farm demonstrations to increase farmers' exposure to certified seeds. They should also sensitize farmers to the need for regular seed exchanges through extension and training programs. Raising the awareness and knowledge of farmers on the importance of certified seeds is a necessary step to increase farmers' demand for certified seeds. And also, agricultural seed producers (i.e., seed entrepreneurs) can have a competitive advantage in supplying seeds to their communities due to lower costs. To strengthen this semi-formal seed sector, additional efforts from the government, private seed companies and NGOs are needed to increase the capacities of small and medium seed producers (SMEs) and a corresponding quality assurance system for seeds. Ultimately, for these SMEs to play a larger role in the seed sector, they must have access to high quality, early generation seeds to reproduce and produce commercial seeds.
REFERENCES
Abebaw D, Belay K. 2001. Factors influencing adoption of high yielding maize varieties in Southwestern Ethiopia: An application of logit. QJ of Int Agric, 40, 149-167.
Adekoya A E, Babaleye T. 2009. Consistency of technology adoption among farmers in Northern Nigeria. Journal of Food, Agriculture & Environment, 7(3/4), 457-460.
Bloom B S. 1956. Taxonomy of educational objectives: The classification of educational goals. D. McKay.
Chilonda P, Van Huylenbroeck G. 2001. Attitude towards and uptake of veterinary services by small-scale cattle farmers in Eastern province, Zambia. Outlook on Agriculture, 30(3), 213-218. Retrieved from https://doi.org/10.1016/j.rsci.2017.10.003
FAO (Food and Agriculture Organization) 2019. Rice and water: along and diversified story [online]. International year of rice 2004. FAO, Rome, Italy. Retrieved from: http://www.fao.org/rice2004/en/fsheet/factsheet1.pdf.
Hubert L, Schultz J. 1976. Quadratic assignment as a general data analysis strategy. British journal of mathematical and statistical psychology, 29(2), 190-241.
Likert R. 1932. A techiques for the measurement of attitudes. Archives of psychology.
Lwin C M. 2017. Profitability and labor use efficiency of Different Rice Varieties with Different Crop Establishment Methods in Maubin and Daik U Townships (Master Thesis, Yezin Agricultural University, Myanmar).
Miah M N H, Talukder S, Sarkar M A R, Ansari T H. 2004. Effect of number of seedling per hill and urea super granules on growth and yield of the rice cv. BINA dhan4. J. Biol. Sci, 4(2), 122-129.
Ministry of Agriculture and Irrigation (MoAI). 2013. Activities of Department of Agriculture, Republic of the Union of Myanmar.
MOALI. (Ministry of Agriculture, Livestock and Irrigation) 2016. Myanmar Agriculture in Brief. Ministry of Agriculture, Livestock and Irrigation, Nay Pyi Taw, Union of Myanmar.
MOALI. (Ministry of Agriculture, Livestock and Irrigation) 2017. Road map for Myanmar's seed sector (2017-2020). Ministry of Agriculture, Livestock and Irrigation, Nay Pyi Taw, Union of Myanmar. Retrieved from http://www.myanmarseedportal.gov.mm/en/publications/road-map-action-agenda
MOALI. (Ministry of Agriculture, Livestock and Irrigation) 2019. Myanmar Agriculture in Brief. Ministry of Agriculture, Livestock and Irrigation, Nay Pyi Taw, Union of Myanmar.
Nazuri N, Man N, Saufe A, Nazuri S. 2018. Knowledge, attitude and skills of farmers on adoption of new paddy seed varieties in Muda Area, Kedah. IOSR Journal of Humanities and Social Science, 23(8), 64-69.
Olson K D. 2004. Farm Management: Principles and Strategy. The textbook of Farm Management: Principles and Strategies. (1st ed.) Iwa State Press.
Ravallion M, Datt G. 1996. How important to India's poor is the sectoral composition of economic growth? The World Bank Economic Review, 10(1), 1-25.
Rogers A. 2005. Non-formal education. Springer science and Business media. Inc.
Rogers E M. 1983. Diffusion of innovations (3rd ed). New York : London: Free Press ; Collier Macmillan.
Rogers E M. 2003. Diffusion of innovations (5th ed). Simon and Schuster.
Rogers E M. 2010. Diffusion of Innovations, (4th ed). Simon and Schuster.
Savitha C M. 1999. Impact of training on knowledge, attitude and symbolic adoption of value added products of ragi by farm women (Doctoral dissertation, University Of Agricultural Sciences Gkvk Bangalore).
Yamane T. 1967. Problems to accompany" Statistics, an introductory analysis". Harper & Row.