ABSTRACT
Results of a survey on 50 agricultural cooperatives of different types of production and business in agro-ecological regions in Vietnam showed that production-scale diversity was high. The highest production-scale and production area was observed in the rice cooperative group with average area of 453 hectares per cooperative and an average count of 1,064 members per cooperative. Meanwhile, the highest total assets were observed in the coffee cooperative group with an average of USD 1.59 million. The agricultural cooperative groups have ineffective production and business performance with the profit-to-revenue ratio of cooperatives only reached 10% in recent years. Regarding the status of the application of digital traceability technology was low with 13 out of 50 cooperatives investigated applying traceability, which accounts for 26 %. The percentage of the cooperative members knowing the traceability ranged from 55 to 78% depending on the type of cooperative, in which the highest percentage was observed in the coffee cooperative group. The status of the application of traceability technology was low because this technology has been relatively new and the major component of cooperative are farmers. In addition, poor facilities and out-of-date equipment were also barriers to the application of traceability technology in the future. It was also showed that the potential of applying traceability technology in cooperatives was high and played a vital role in promoting the sustainable development of agricultural cooperatives in the future.
Keywords: agricultural cooperative, digital technology, traceability
INTRODUCTION
Humankind has experienced three industrial revolution relationships that fundamentally changed economy and social aspects of life over the past 100 years. The Fourth Industrial Revolution is inevitable that is inherited from the previous results but is happening at a faster pace. The core leading technology of the Fourth Industrial Revolution will be digital technology where the physical, digital, and biological worlds continue to converge. Digital technologies, include digital traceability technology as one of its popular applications.
In developed countries, product traceability labeling is mandatory for products that are circulating in the market. In Vietnam, implementing digital technology for traceability has been focused and widely used in recent years. Traceability is the solution for consumers to trace the origin of the product, find out the information of items they purchased, review all stages from production, processing to distribution. Thereby, traceability system helps to minimize the purchase of unsafe or poor-quality products, particularly those products that directly affect health such as food, pharmaceuticals or garments. On the side of manufacturers (enterprises; cooperatives; production, processing and business facilities), traceability helps to control risks arising from monitoring, verifying the entire path of goods, establishing transparency for products, winning the trust of those customers, and protecting the reputation of products and manufacturers. Through traceability, production units can be deeply integrated in the value chains. In general, the National Assembly (2012) promulgated the Law on Food Safety regulated the basic principles such as chain management, division of responsibilities for ministries to ensure the traceability. The Minister of Agriculture and Rural Development promulgated Circular No. 74/2011/TT-BNNPTNT of 31 October 2011, on voluntary traceability, recall and handling of unsafe agricultural and forest food. This policy has lacked of guideline on how to realize the conventional traceability system with book records. Even with the benefit of traceabilty in term of improving the quality of goods, increasing competitiveness and export of domestic products to the foreign markets, there were very few enterprises have realized the traceability because a lot of information recorded was not treated.
In recent years, with the digital technology applying in traceability system, the feasibility of treacability work is more evident. Many enterprises are interested in applying traceability as a powerful tool to enhance consumer trust about food safety and prevent the sale of counterfeit and/or poor-quality goods. In this context, Governement have issued Decision No. 100/QD-TTg dated 19 January 2019 of the Prime Minister, approving the Scheme on deployment, application and management of tracking and traceability systems, promoting digital treacability. The Decision 1322/QD-TTg approving the national program to support businesses to improve productivity and quality of products and goods in the 2021-30 period has consider the digital traceability system is one of major solution (Prime Minister, 2020). For longterm, the Govement is planning to build a National digital traceability platform managing by the Quality and Measurment Office.
In the short term, the special attention of the State will help the status of the application of digital traceability technologies, which has certainly changed positively in recent years. But the digital traceability system is requiring investment in informatic technology infrastructure and designing the solfware adapted to divers’ products and standards, while the investment mostly came from private sector. The Government is willing to support the private sector in the field of digital traceability but the knowledge gap is problematic. However, there is little research to assess the issue. Therefore, we have carried out the study to investigate and assess the status of the application of digital traceability technologies at the cooperative level in Vietnam. Assessment data can be based on data from collecting information on scale, effieciency of production and business, status of application of digital traceability by cooperatives across the country; therefore, it will be the foundation for planners and decision-makers and cooperatives in promoting the application of traceability technology and digital technology in production and business of cooperatives.
METHOD AND DATA
Data, study site and timing
Data collected from 50 cooperatives across Vietnam distributed over ecological zones, including the representative provinces, in which typical cooperative has thrived and a variety of business activites, focused on producing the types of production that region has advantages. Specifically, there are two provinces covering the Northern midland and mountainous region: Son La and Ha Giang. The Red River Delta region has 4 provinces: Ha noi, Hung Yen, Thai Binh, and Nam Dinh. The North Central region has 2 provinces: Ha Tinh, and Thua Thien Hue. The South-Central Coast region has 2 provinces: Binh Thuan and Ninh Thuan. The Central Highlands region has 2 provinces: Dak lak and Kon Tum. The Southeast region has 2 provinces: Dong Nai and Ba Ria - Vung Tau. The Mekong River Delta region has 2 provinces: Long An and Dong Thap. This study was carried out in 2020, in which a survey was carried out from September to November 2020.
Method
Primary data
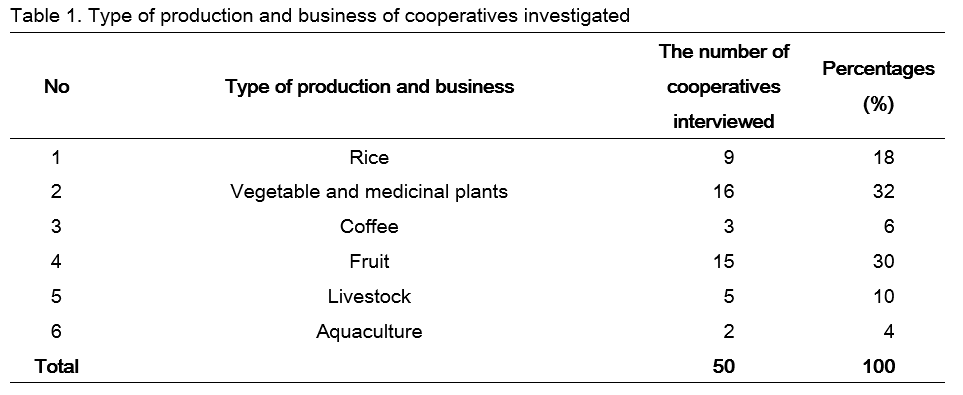
Direct investigation method: 50 agri-cooperatives including crops, livestock and fisheries (Table 1) were surveyed using a semi-structured questionnaire. To protect the validity, reliability, and accuracy of data, information was gathered from 3 groups of members of the cooperative, including: 1) one (01) member of the board of director; 2) one (01) technical officer; 3) twenty (20) members of the cooperative.
Secondary data
The list of cooperatives operating in the provinces is collected from the Provincial Sub-Department of Rural Development. The agricultural cooperatives in the study were randomly selected from the above list and obtained from consultation from the Provincial Department of Rural Development to ensure the objectivity of the assessment and meet the objectives set by the study.
Data analysis
Data were processed by using Microsoft Excel.
Statistical criteria such as frequency, percentage, mean, variance in the study were used to describe the production and business situation and status of the application of digital traceability technologies of cooperatives investigated.
SWOT analysis was used to assess the strengths, weaknesses, opportunities and threats of cooperatives when applying and replicating the application of digital traceability technologies
RESULTS AND DISCUSSION
Characteristic of types of agricultural cooperatives and production and business situation
The results of the investigation found the number of members of the rice cooperative group was the first with an average count of 1,064 members per cooperative, followed by the vegetable group with an average of 481, aquaculture group with an average of 130, fruit trees group with an average of 70, coffee group with an average of 62; and the lowest number of members (23) was observed in the livestock cooperative. The highest production area (453 ha) was observed in the rice cooperative, followed by the group of coffee (137 ha), vegetables (121 ha), fruit trees (116 ha), aquaculture (70 ha), and the lowest production area (12.3 ha) was observed in the livestock cooperative.
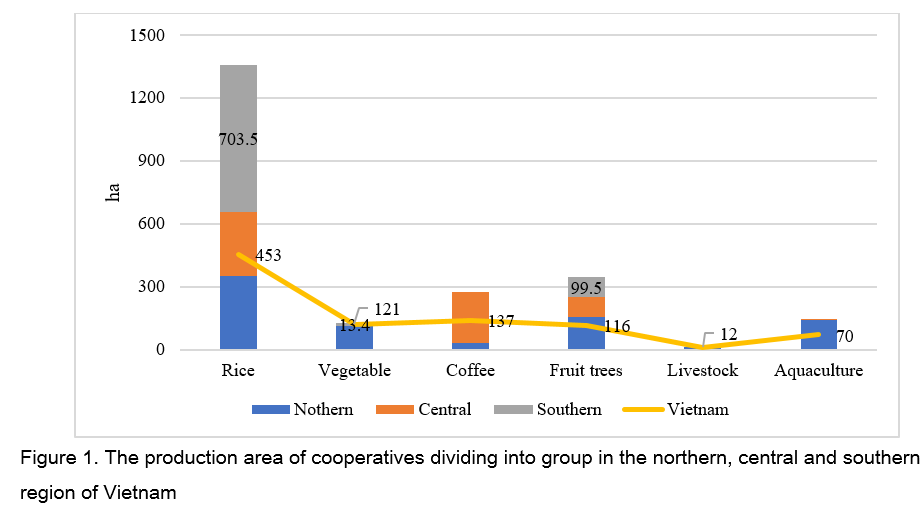
Figure 1 showed that the production area of the rice cooperative group in the southern region (average of 703 hectares per cooperative) was twice as high as that in the northern and the central regions. Meanwhile, the production area of the vegetable cooperative group in the northern and the central region (113 ha and 235 ha) was much higher than that in the southern region (13.4 ha). The production area of the coffee cooperative group in central region (243 ha) was much higher than that in the northern region (30 ha). Cooperatives in the northern region that both exploit and preserve aquatic products differ from cooperatives in the central region that purchase and have mass production. The production area in the northern region was 140 ha and that in the central region was 0.3 ha. Average production area of each household member in the rice cooperatives (0.42 ha), vegetable (0.25 ha), coffee (2.21 ha), fruit (1.66 ha), livestock (0.52 ha), and aquacultural cooperatives (0.54 ha) was observed.
It was found that all agricultural sub-sectors have fixed assets such as machineries, buildings, land, seedlings, is much higher than the movable assets that is mainly the annual sum that was received in cash. The highest average total assets of the coffee group reached USD 1.59 million (in which fixed assets was USD 1.53 million, movable assets was USD 0.06 million), followed by the group of fruit reached USD 0.42 million (in which fixed assets was USD 0.35 million, movable assets was USD 0.07 million), rice cooperatives reached USD 0.36 million (in which fixed assets was USD 0.23 million, movable assets was USD 0.13 million), vegetables reached USD 0.20 million (in which fixed assets was USD 0.15 million, movable assets was USD 0.05 million), aquaculture reached USD 0.17 million (in which fixed assets was USD 0.13 million, movable assets was USD 0.04 million), and the lowest average total assets was observed in the livestock cooperatives reached USD 163,793 (in which fixed assets was USD 159,482, movable assets was USD 4,311.
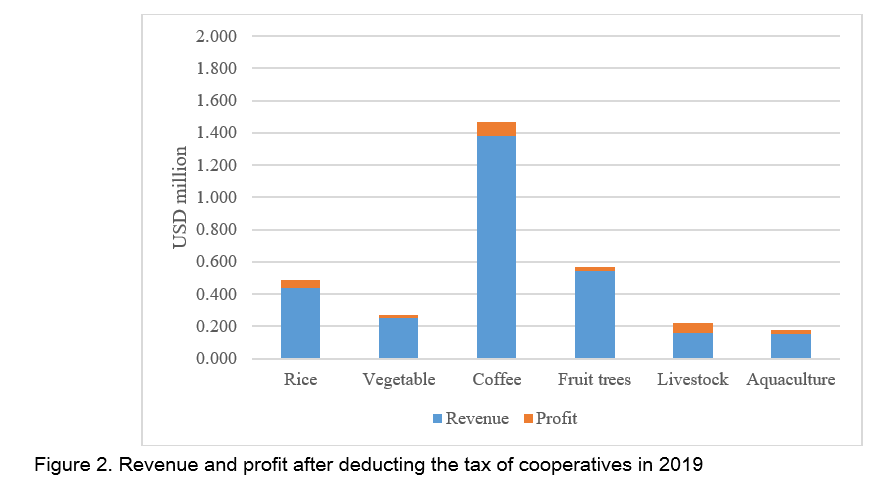
Results of production and business of the investigating cooperatives showed that relatively high annual revenue but relatively low profit remaining after deducting the tax (Figure 2). The highest revenue (USD 1.37 million) was observed in the coffee cooperatives, followed by the fruit cooperatives (USD 0.54 million), rice (USD 0.44 million), vegetable (USD 0.25 million), livestock (USD 0.159 million), and the lowest revenue (USD 0.156 million) was observed in the aquaculture cooperatives. Profits after deducting the tax were 6.3%, 4.4%, 11.3%, 7.2%, 38.0% and 15.5%, respectively, compared to the revenue. It was found that the revenues of cooperatives were at higher level compared to the results of survey being 3.9% (Vo Hong Tu and Nguyen Thuy Trang, 2020).
It was found that income from agriculture accounted for a very high proportion, which accounts for 70-90% of the total household income. The highest proportion of income was observed in the aqualculture group and the lowest proportion of income was observed in the rice cooperative. There was a slight difference in proportion of income within cooperative groups derived from production characteristics, nature of work and regional peculiarities.
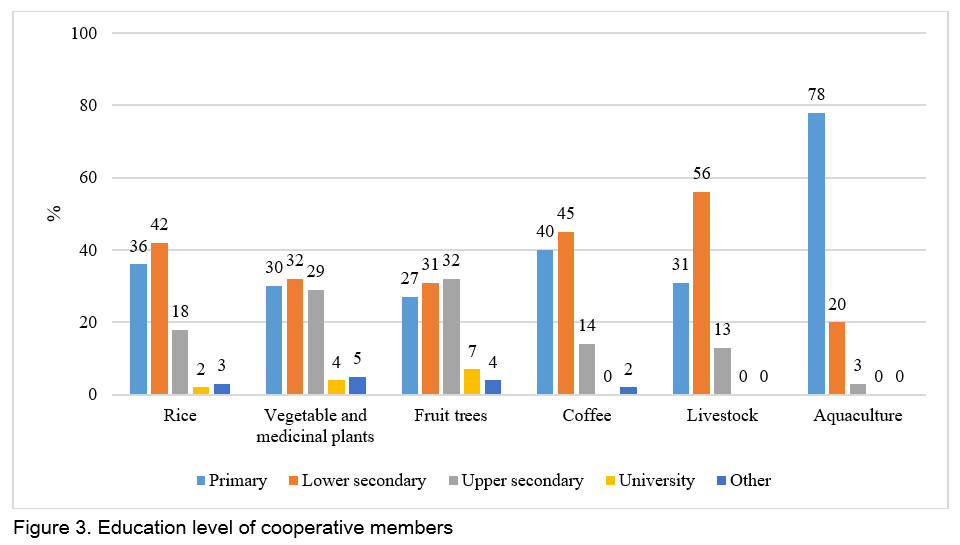
The survey also revealed that there was low human resource quality. The education level of cooperatives members at the primary and lower secondary level accounts for the majority (Figure 3). Some cooperatives have a relatively high number of members with upper secondary education, including fruit cooperatives, vegetables and medicinal plants cooperative, and rice cooperatives. The percentages of members having bachelor’s degree was very low, not exceeding 6.6% of the total number of members of the cooperative, including fruit cooperatives, vegetables and medicinal plants cooperative, and rice cooperatives. Results of Mai Van Nam (2005) and Nguyen Cong Binh (2007) also showed that the education level of cooperative staff was mainly at the lower and upper secondary level. The percentage of cooperative staff having bachelor’s degree only reached 2.4% (Mai Cong Binh, 2007).
Status of the application of digital traceability technologies of cooperatives investigated
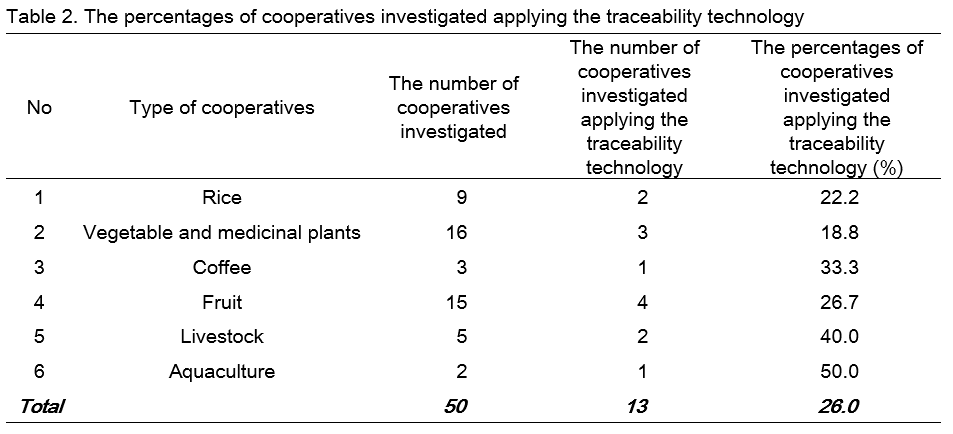
The results of the survey among cooperative managers showed that proportion of traceability technology application was low, which accounts for 26 % of 50 cooperatives (Table 2). The survey also revealed traceability in cooperatives which means applied traceability technologies was the approach used for information retrievel and not for tracebility.
Information retrievel was incomplete in the total chain, and information at the household level, information on inputs management such as fertilizer and pesticide application, watering, information on production household, production lot, raw material areas, associtated units, and distribution units was not traced. Traceability management of cooperative is assigned to the agencies at the provincial level and partner supplying software to supervise and operate the system. There is no cooperative managing and operating the entire system. There are no unified standards. However, the cooperatives applying traceability technology showed the ability to integrate into the large retail chains such as Big C, Vinmart, Co-opmart and SATRA.
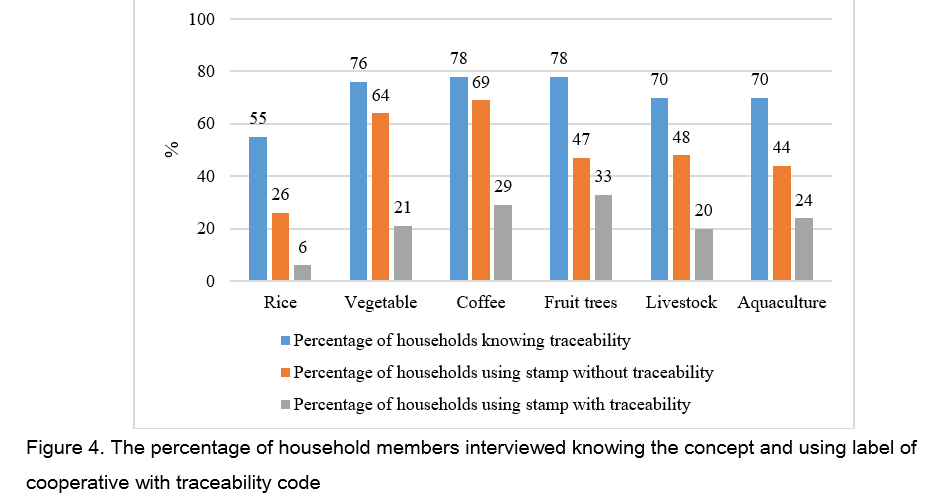
Of the household members interviewed, it showed that there were relatively large percentages of persons who know the concept of traceability (Figure 4). The fruit and vegetable cooperatives, medicinal plant cooperatives, coffee cooperatives, livestock cooperatives, and aquacultural cooperatives have over 70% of the household members interviewed who know this concept. The rice cooperatives have 50% of the household members interviewed who know this concept. The difference derived from peculiarities of goods and products of cooperatives. The percentage of household members using label of cooperative (without traceability code) for products varies from 25.8% to 69.2%. The highest percentage was observed in the fruit cooperatives. The percentage of household members using label of cooperative with traceability code ranges from 5.8% to 33.3%. The highest percentage was observed in the coffee cooperatives with 33.3% household interviewed, followed by fruit and vegetable and medicinal plants cooperatives. These products are within the wide food and beverages market; therefore, it is necessary to focus on using traceability stamps.
Availability of the application of traceability technology in agricultural cooperatives
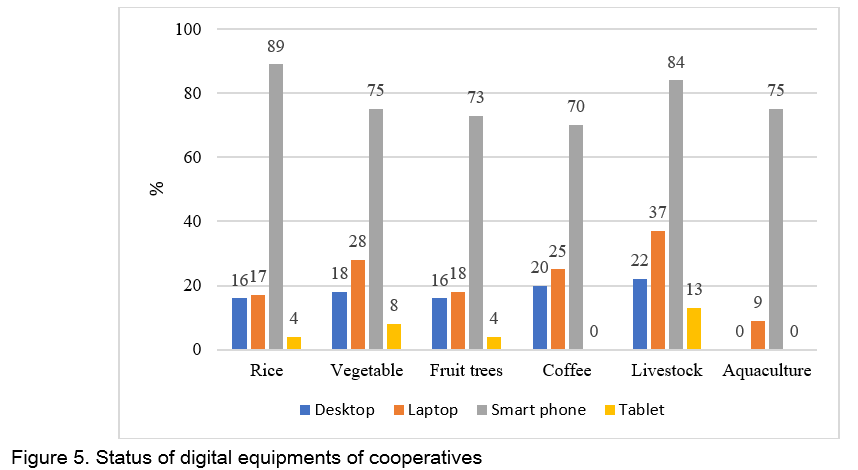
Regarding information technology equipment and internet infrastructure, the survey showed that cooperatives are equipped with equipment such as desktops, laptops, smartphones, and tablets (Figure 5). Each cooperative is equipped with an average 2-3 desktops and laptops. Most of cooperatives had internet access and were equipped with computers to apply data management software and traceability.
Among household members of cooperative, the survey revealed the level of internet access at the household level was high, which ranged from 70.5 % to 81% of household interviewed. However, the level of smartphone used in households for production purpose was relatively low, fluctuated and varied from 34 % to 60%. The percentage of households who had difficulty in using smartphones ranged from 24 to 35 % depending on the type of cooperative. The highest percentage was observed in the aquaculture cooperatives, and the lowest percentage was observed in the coffee cooperatives. The percentage of housholds knowing how to download appliances was relatively low, which varied from 34 to 61 % of the households interviewed. It is therefore essential to enhance the information technology skills of households to apply digital traceability technologies in the future.
Recording the production at the household level plays a vital role in observing, monitoring the quality of products and managing problems. Most of the members of cooperatives interviewed have high percentages of households implementing the recording of the production. The percentage of household members who implement and recorded the production in the vegetable and medicinal plants cooperatives, fruit cooperatives, and coffee cooperatives was over 95% percent of the household- members interviewed. The lowest percentage was observed in the aquaculture cooperatives with 41.5% of households interviewed.
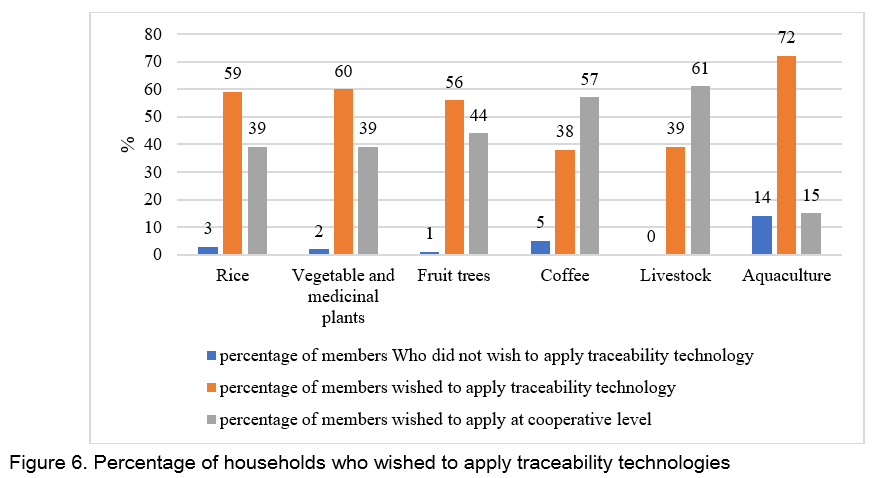
The survey showed that most of household members interviewed wished to apply traceability in production acitivites at the cooperative and household level (Figure 6). 13.5% who did not wish to apply had the highest percentage of housholds observed in the aquaculture cooperatives. It ranges from 0.6 to 5% of household members who were interviewed in the remaining cooperative groups.
CONCLUSIONS AND RECOMMENDATIONS
Conclusions
- The highest production area (453 ha) was observed in the rice cooperative, followed by the group of coffee (137 ha), vegetable (121 ha), fruit trees (116 ha), aquaculture (70 ha), and the lowest production area (12.3 ha) was observed in the livestock cooperative. The number of members of the rice cooperative group was with an average count of 1,064 members per cooperative, followed by the vegetable group with an average of 481, aquaculture group with an average 130, fruit trees group with an average 70, coffee group with an average 62; and the lowest number of members (23) was observed in the livestock cooperative. Therefore, average production area of each household member in the rice cooperatives (0.42 ha), vegetable (0.25 ha), coffee (2.21 ha), fruit (1.66 ha), livestock (0.52 ha), and aquacultural cooperatives (0.54 ha) was observed.
- The highest revenue (USD 1.37 million) was observed in the coffee cooperatives, followed by the fruit cooperatives (USD 0.54 million), rice (USD 0.44 million), vegetable (USD 0.25 million), livestock (USD 0.159 million), and the lowest revenue (USD 0.156 million) was observed in the aquaculture cooperatives. Profits after deducting the tax were 6.3%, 4.4%, 11.3%, 7.2%, 38.0% and 15.5%, respectively compared to the revenue.
- Regarding the status of the application of digital traceability technologies of cooperatives investigated, the results of survey among cooperative managers showed that proportion of traceability technology application was low, which accounts for 26 % of 50 cooperatives. The level of internet access at household level was also high, ranged from 70.5 % to 81.0% of household interviewed. However, the application of such technology presents barriers. The majority of cooperative groups are elderly people who are not used to interacting with computerized devices and many encounter great difficultires in operating a system to implement production and marketing. The level of smartphone usage at household for production purpose was also relatively low, fluctuated and varied from 34% to 60%. It was showed that most of household members know the concept of traceability. The percentage of household members using label of cooperative with traceability code ranges from 5.8 % to 33.3 %. The highest percentage was observed in the coffee cooperatives. The survey showed that most of hosehold members interviewed wished to apply traceability in production acitivites at the cooperative and household levels.
Recommendations
Some solutions are given based on analysis and assessment of the status of the application of digital traceability technology at the cooperative level to promote the application of traceability technology and digital technology in production and business of cooperatives, including:
- Strengthen to raise awareness about the application of digital traceability technology at cooperative level.
- Enhance training and improve information technology level for cooperative members through technology transfer, short-term training.
- Enhance support on digital equipment for cooperatives.
- Build and complete a system of documents on management, handling of violation on traceability; build national standards, national technical regulations on traceability guiding documents for each specific product group.
- Build, implement and apply a unified system on traceability at the national level; build central database to manange the entire chain and connect information in chains management at the stage level to ensure the connection of the relevant ministries, agencies and solution providers in Vietnam.
REFERENCES
Minister of Agriculture and Rural Development, 2011. Circular No. 74/2011/TT-BNNPTNT on traceability, recall and handling of unsafe agricultural and forest food.
Mai Van Nam, 2005. Cooperative economy and the role of cooperative and cooperative economy for the development of agricultural production in the Mekong River Delta region. Journal of Science - Can Tho University, 3: 128-137.
Nguyen Cong Binh, 2007. Measures to improve the efficiency of agricultural cooperatives in Tien Giang province to 2015. Master's thesis. Ho Chi Minh City University of Economics.
National Assembly, 2010. Law on Food Safety 2010.
Prime Minister, 2019. Decision No. 100/QD-TTg, approving the Scheme on deployment, application and management of tracking and traceability systems.
Prime Minister, 2020. Decision 1322/QD-TTg approving the national program to support businesses to improve productivity and quality of products and goods in the 2021-30 period.
Vo Hong Tu and Nguyen Thuy Trang, 2020. Analyis on the performance of agricultural cooperatives in Vinh Long province. Journal of Science - Can Tho University, 3: 128-137.

Status and Solutions of the Application of Digital Traceability Technologies for the Production and Business of Agricultural Cooperatives in Vietnam
ABSTRACT
Results of a survey on 50 agricultural cooperatives of different types of production and business in agro-ecological regions in Vietnam showed that production-scale diversity was high. The highest production-scale and production area was observed in the rice cooperative group with average area of 453 hectares per cooperative and an average count of 1,064 members per cooperative. Meanwhile, the highest total assets were observed in the coffee cooperative group with an average of USD 1.59 million. The agricultural cooperative groups have ineffective production and business performance with the profit-to-revenue ratio of cooperatives only reached 10% in recent years. Regarding the status of the application of digital traceability technology was low with 13 out of 50 cooperatives investigated applying traceability, which accounts for 26 %. The percentage of the cooperative members knowing the traceability ranged from 55 to 78% depending on the type of cooperative, in which the highest percentage was observed in the coffee cooperative group. The status of the application of traceability technology was low because this technology has been relatively new and the major component of cooperative are farmers. In addition, poor facilities and out-of-date equipment were also barriers to the application of traceability technology in the future. It was also showed that the potential of applying traceability technology in cooperatives was high and played a vital role in promoting the sustainable development of agricultural cooperatives in the future.
Keywords: agricultural cooperative, digital technology, traceability
INTRODUCTION
Humankind has experienced three industrial revolution relationships that fundamentally changed economy and social aspects of life over the past 100 years. The Fourth Industrial Revolution is inevitable that is inherited from the previous results but is happening at a faster pace. The core leading technology of the Fourth Industrial Revolution will be digital technology where the physical, digital, and biological worlds continue to converge. Digital technologies, include digital traceability technology as one of its popular applications.
In developed countries, product traceability labeling is mandatory for products that are circulating in the market. In Vietnam, implementing digital technology for traceability has been focused and widely used in recent years. Traceability is the solution for consumers to trace the origin of the product, find out the information of items they purchased, review all stages from production, processing to distribution. Thereby, traceability system helps to minimize the purchase of unsafe or poor-quality products, particularly those products that directly affect health such as food, pharmaceuticals or garments. On the side of manufacturers (enterprises; cooperatives; production, processing and business facilities), traceability helps to control risks arising from monitoring, verifying the entire path of goods, establishing transparency for products, winning the trust of those customers, and protecting the reputation of products and manufacturers. Through traceability, production units can be deeply integrated in the value chains. In general, the National Assembly (2012) promulgated the Law on Food Safety regulated the basic principles such as chain management, division of responsibilities for ministries to ensure the traceability. The Minister of Agriculture and Rural Development promulgated Circular No. 74/2011/TT-BNNPTNT of 31 October 2011, on voluntary traceability, recall and handling of unsafe agricultural and forest food. This policy has lacked of guideline on how to realize the conventional traceability system with book records. Even with the benefit of traceabilty in term of improving the quality of goods, increasing competitiveness and export of domestic products to the foreign markets, there were very few enterprises have realized the traceability because a lot of information recorded was not treated.
In recent years, with the digital technology applying in traceability system, the feasibility of treacability work is more evident. Many enterprises are interested in applying traceability as a powerful tool to enhance consumer trust about food safety and prevent the sale of counterfeit and/or poor-quality goods. In this context, Governement have issued Decision No. 100/QD-TTg dated 19 January 2019 of the Prime Minister, approving the Scheme on deployment, application and management of tracking and traceability systems, promoting digital treacability. The Decision 1322/QD-TTg approving the national program to support businesses to improve productivity and quality of products and goods in the 2021-30 period has consider the digital traceability system is one of major solution (Prime Minister, 2020). For longterm, the Govement is planning to build a National digital traceability platform managing by the Quality and Measurment Office.
In the short term, the special attention of the State will help the status of the application of digital traceability technologies, which has certainly changed positively in recent years. But the digital traceability system is requiring investment in informatic technology infrastructure and designing the solfware adapted to divers’ products and standards, while the investment mostly came from private sector. The Government is willing to support the private sector in the field of digital traceability but the knowledge gap is problematic. However, there is little research to assess the issue. Therefore, we have carried out the study to investigate and assess the status of the application of digital traceability technologies at the cooperative level in Vietnam. Assessment data can be based on data from collecting information on scale, effieciency of production and business, status of application of digital traceability by cooperatives across the country; therefore, it will be the foundation for planners and decision-makers and cooperatives in promoting the application of traceability technology and digital technology in production and business of cooperatives.
METHOD AND DATA
Data, study site and timing
Data collected from 50 cooperatives across Vietnam distributed over ecological zones, including the representative provinces, in which typical cooperative has thrived and a variety of business activites, focused on producing the types of production that region has advantages. Specifically, there are two provinces covering the Northern midland and mountainous region: Son La and Ha Giang. The Red River Delta region has 4 provinces: Ha noi, Hung Yen, Thai Binh, and Nam Dinh. The North Central region has 2 provinces: Ha Tinh, and Thua Thien Hue. The South-Central Coast region has 2 provinces: Binh Thuan and Ninh Thuan. The Central Highlands region has 2 provinces: Dak lak and Kon Tum. The Southeast region has 2 provinces: Dong Nai and Ba Ria - Vung Tau. The Mekong River Delta region has 2 provinces: Long An and Dong Thap. This study was carried out in 2020, in which a survey was carried out from September to November 2020.
Method
Primary data
Direct investigation method: 50 agri-cooperatives including crops, livestock and fisheries (Table 1) were surveyed using a semi-structured questionnaire. To protect the validity, reliability, and accuracy of data, information was gathered from 3 groups of members of the cooperative, including: 1) one (01) member of the board of director; 2) one (01) technical officer; 3) twenty (20) members of the cooperative.
Secondary data
The list of cooperatives operating in the provinces is collected from the Provincial Sub-Department of Rural Development. The agricultural cooperatives in the study were randomly selected from the above list and obtained from consultation from the Provincial Department of Rural Development to ensure the objectivity of the assessment and meet the objectives set by the study.
Data analysis
Data were processed by using Microsoft Excel.
Statistical criteria such as frequency, percentage, mean, variance in the study were used to describe the production and business situation and status of the application of digital traceability technologies of cooperatives investigated.
SWOT analysis was used to assess the strengths, weaknesses, opportunities and threats of cooperatives when applying and replicating the application of digital traceability technologies
RESULTS AND DISCUSSION
Characteristic of types of agricultural cooperatives and production and business situation
The results of the investigation found the number of members of the rice cooperative group was the first with an average count of 1,064 members per cooperative, followed by the vegetable group with an average of 481, aquaculture group with an average of 130, fruit trees group with an average of 70, coffee group with an average of 62; and the lowest number of members (23) was observed in the livestock cooperative. The highest production area (453 ha) was observed in the rice cooperative, followed by the group of coffee (137 ha), vegetables (121 ha), fruit trees (116 ha), aquaculture (70 ha), and the lowest production area (12.3 ha) was observed in the livestock cooperative.
Figure 1 showed that the production area of the rice cooperative group in the southern region (average of 703 hectares per cooperative) was twice as high as that in the northern and the central regions. Meanwhile, the production area of the vegetable cooperative group in the northern and the central region (113 ha and 235 ha) was much higher than that in the southern region (13.4 ha). The production area of the coffee cooperative group in central region (243 ha) was much higher than that in the northern region (30 ha). Cooperatives in the northern region that both exploit and preserve aquatic products differ from cooperatives in the central region that purchase and have mass production. The production area in the northern region was 140 ha and that in the central region was 0.3 ha. Average production area of each household member in the rice cooperatives (0.42 ha), vegetable (0.25 ha), coffee (2.21 ha), fruit (1.66 ha), livestock (0.52 ha), and aquacultural cooperatives (0.54 ha) was observed.
It was found that all agricultural sub-sectors have fixed assets such as machineries, buildings, land, seedlings, is much higher than the movable assets that is mainly the annual sum that was received in cash. The highest average total assets of the coffee group reached USD 1.59 million (in which fixed assets was USD 1.53 million, movable assets was USD 0.06 million), followed by the group of fruit reached USD 0.42 million (in which fixed assets was USD 0.35 million, movable assets was USD 0.07 million), rice cooperatives reached USD 0.36 million (in which fixed assets was USD 0.23 million, movable assets was USD 0.13 million), vegetables reached USD 0.20 million (in which fixed assets was USD 0.15 million, movable assets was USD 0.05 million), aquaculture reached USD 0.17 million (in which fixed assets was USD 0.13 million, movable assets was USD 0.04 million), and the lowest average total assets was observed in the livestock cooperatives reached USD 163,793 (in which fixed assets was USD 159,482, movable assets was USD 4,311.
Results of production and business of the investigating cooperatives showed that relatively high annual revenue but relatively low profit remaining after deducting the tax (Figure 2). The highest revenue (USD 1.37 million) was observed in the coffee cooperatives, followed by the fruit cooperatives (USD 0.54 million), rice (USD 0.44 million), vegetable (USD 0.25 million), livestock (USD 0.159 million), and the lowest revenue (USD 0.156 million) was observed in the aquaculture cooperatives. Profits after deducting the tax were 6.3%, 4.4%, 11.3%, 7.2%, 38.0% and 15.5%, respectively, compared to the revenue. It was found that the revenues of cooperatives were at higher level compared to the results of survey being 3.9% (Vo Hong Tu and Nguyen Thuy Trang, 2020).
It was found that income from agriculture accounted for a very high proportion, which accounts for 70-90% of the total household income. The highest proportion of income was observed in the aqualculture group and the lowest proportion of income was observed in the rice cooperative. There was a slight difference in proportion of income within cooperative groups derived from production characteristics, nature of work and regional peculiarities.
The survey also revealed that there was low human resource quality. The education level of cooperatives members at the primary and lower secondary level accounts for the majority (Figure 3). Some cooperatives have a relatively high number of members with upper secondary education, including fruit cooperatives, vegetables and medicinal plants cooperative, and rice cooperatives. The percentages of members having bachelor’s degree was very low, not exceeding 6.6% of the total number of members of the cooperative, including fruit cooperatives, vegetables and medicinal plants cooperative, and rice cooperatives. Results of Mai Van Nam (2005) and Nguyen Cong Binh (2007) also showed that the education level of cooperative staff was mainly at the lower and upper secondary level. The percentage of cooperative staff having bachelor’s degree only reached 2.4% (Mai Cong Binh, 2007).
Status of the application of digital traceability technologies of cooperatives investigated
The results of the survey among cooperative managers showed that proportion of traceability technology application was low, which accounts for 26 % of 50 cooperatives (Table 2). The survey also revealed traceability in cooperatives which means applied traceability technologies was the approach used for information retrievel and not for tracebility.
Information retrievel was incomplete in the total chain, and information at the household level, information on inputs management such as fertilizer and pesticide application, watering, information on production household, production lot, raw material areas, associtated units, and distribution units was not traced. Traceability management of cooperative is assigned to the agencies at the provincial level and partner supplying software to supervise and operate the system. There is no cooperative managing and operating the entire system. There are no unified standards. However, the cooperatives applying traceability technology showed the ability to integrate into the large retail chains such as Big C, Vinmart, Co-opmart and SATRA.
Of the household members interviewed, it showed that there were relatively large percentages of persons who know the concept of traceability (Figure 4). The fruit and vegetable cooperatives, medicinal plant cooperatives, coffee cooperatives, livestock cooperatives, and aquacultural cooperatives have over 70% of the household members interviewed who know this concept. The rice cooperatives have 50% of the household members interviewed who know this concept. The difference derived from peculiarities of goods and products of cooperatives. The percentage of household members using label of cooperative (without traceability code) for products varies from 25.8% to 69.2%. The highest percentage was observed in the fruit cooperatives. The percentage of household members using label of cooperative with traceability code ranges from 5.8% to 33.3%. The highest percentage was observed in the coffee cooperatives with 33.3% household interviewed, followed by fruit and vegetable and medicinal plants cooperatives. These products are within the wide food and beverages market; therefore, it is necessary to focus on using traceability stamps.
Availability of the application of traceability technology in agricultural cooperatives
Regarding information technology equipment and internet infrastructure, the survey showed that cooperatives are equipped with equipment such as desktops, laptops, smartphones, and tablets (Figure 5). Each cooperative is equipped with an average 2-3 desktops and laptops. Most of cooperatives had internet access and were equipped with computers to apply data management software and traceability.
Among household members of cooperative, the survey revealed the level of internet access at the household level was high, which ranged from 70.5 % to 81% of household interviewed. However, the level of smartphone used in households for production purpose was relatively low, fluctuated and varied from 34 % to 60%. The percentage of households who had difficulty in using smartphones ranged from 24 to 35 % depending on the type of cooperative. The highest percentage was observed in the aquaculture cooperatives, and the lowest percentage was observed in the coffee cooperatives. The percentage of housholds knowing how to download appliances was relatively low, which varied from 34 to 61 % of the households interviewed. It is therefore essential to enhance the information technology skills of households to apply digital traceability technologies in the future.
Recording the production at the household level plays a vital role in observing, monitoring the quality of products and managing problems. Most of the members of cooperatives interviewed have high percentages of households implementing the recording of the production. The percentage of household members who implement and recorded the production in the vegetable and medicinal plants cooperatives, fruit cooperatives, and coffee cooperatives was over 95% percent of the household- members interviewed. The lowest percentage was observed in the aquaculture cooperatives with 41.5% of households interviewed.
The survey showed that most of household members interviewed wished to apply traceability in production acitivites at the cooperative and household level (Figure 6). 13.5% who did not wish to apply had the highest percentage of housholds observed in the aquaculture cooperatives. It ranges from 0.6 to 5% of household members who were interviewed in the remaining cooperative groups.
CONCLUSIONS AND RECOMMENDATIONS
Conclusions
Recommendations
Some solutions are given based on analysis and assessment of the status of the application of digital traceability technology at the cooperative level to promote the application of traceability technology and digital technology in production and business of cooperatives, including:
REFERENCES
Minister of Agriculture and Rural Development, 2011. Circular No. 74/2011/TT-BNNPTNT on traceability, recall and handling of unsafe agricultural and forest food.
Mai Van Nam, 2005. Cooperative economy and the role of cooperative and cooperative economy for the development of agricultural production in the Mekong River Delta region. Journal of Science - Can Tho University, 3: 128-137.
Nguyen Cong Binh, 2007. Measures to improve the efficiency of agricultural cooperatives in Tien Giang province to 2015. Master's thesis. Ho Chi Minh City University of Economics.
National Assembly, 2010. Law on Food Safety 2010.
Prime Minister, 2019. Decision No. 100/QD-TTg, approving the Scheme on deployment, application and management of tracking and traceability systems.
Prime Minister, 2020. Decision 1322/QD-TTg approving the national program to support businesses to improve productivity and quality of products and goods in the 2021-30 period.
Vo Hong Tu and Nguyen Thuy Trang, 2020. Analyis on the performance of agricultural cooperatives in Vinh Long province. Journal of Science - Can Tho University, 3: 128-137.