ABSTRACT
An arm of the Andaman Sea in the southern part of Myanmar, Gulf of Mottama Region (GoM), is supporting both coastal population and agricultural productivity in Bago Region and Mon State. The livelihoods in the rural sector depend on agriculture, livestock, and fishing and self-employment activities. In the Gulf of Mottama Region, aquaculture is essential to work to create income generation for fisherman. The study investigates the socioeconomic situation and income diversification from different sources of group livelihood activities in Tha Nat Pin Township, Bago Region. Snowball sampling technique was adopted in the collection of 109 rural households using a semi-structured questionnaire and focus group discussion. Both descriptive and one-way ANOVA statistics were employed to verify the objectives of the study. The result of the analysis showed that the majority of sampled households have a mean age of 45 years with an average family size of 5 people. The majority of sampled households completed primary school education (74%) and 41% of the income-earning member is from international migration. The study revealed that above 80% of flooding in these studied areas directly destroyed the farmlands, fish ponds and livestock and housing. The findings showed that agriculture is the highest income shared in these villages where 66% of sampled farmers grew in monsoon and summer seasons. The study found that the highest annual mean income earned from three types of livelihood groups included agriculture, fishery and livestock (US$32,085) in Tha Nat Tan Village (TNT). In Aung Bone Gyi Village, four types of livelihood groups (agriculture, fishery, livestock and small business) earned US$22,427 and only one livelihood group as agricultural crop production (US$5,504) in Kywe Hphyu Chaung Village (KPC). The better-off group was found in Tha Nat Tan Village (above 78%), in Aung Bone Gyi Village and Kywe Hphyu Chaung Village (nearly 60%). One-third of sampled respondents received poor income return from livelihood with less diversification groups. More diversified livelihood options obtained higher income than only one livelihood option. Agriculture plus other livelihood activities can earn better-off level of sampled household in this study. It was recommended that agricultural crop production should be adequately improved with climate-smart agriculture technology and credit access and easy access to input and farm machineries and post-harvest technology in these areas.
Keywords: socioeconomics, livelihood activities, income diversification
INTRODUCTION
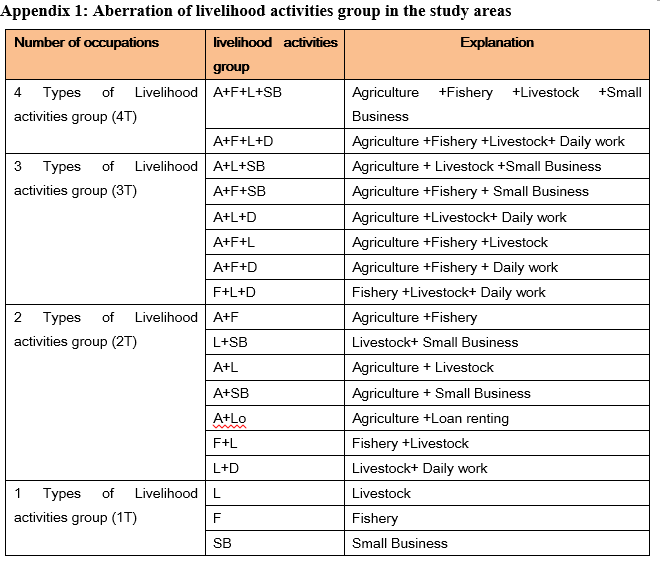
In Myanmar, rural areas are also vulnerable to climate change factors and natural disasters. The consequences of disasters are a serious threat which causes loss of life security and assets, social and economic disruption, injury and disease and the damage to the environment (Twigg J, 2015). Most of people who live in rural areas rely on agriculture as the main source of livelihood which was affected directly by monsoon seasonal floods (ACAPS, 2018). Between 2017 and 2018, the GDP value contribution from the service sector was found to have the highest share of gross domestic product at current prices (40%) and the second-highest sector was the industry sector with 36.3% and the last sector was agriculture sector with 23.3% (Myanmar Statistical Year Book, 2018). According to Sati Vp and Vangchhia L (2017), livelihood is identified as different pathways to distinguish between current assets, livelihood options, coping with the current situation and requirement. According to DFID (2000), livelihood strategies are lying on asset status and policies, institutions and processes. Livelihood approaches seemed to apply for everything: livestock, fisheries, forestry, agriculture, health, urban development and more. Regarding the sources of income, the household size in this region is the main factor determining regarding their work in agriculture (A) holdings and also in non-agriculture activities such as aquaculture (F), livestock rearing (L), small business (SB) and daily work (D). Linking to distress-push, less profitable and market failures in farming production can result in income diversification (Udoh and Nwibo, 2017).
In Demand-pull, households are pulled to off-farm activities which are high or less risk than agricultural crop production. Some studies reported non-farm income with agriculture in total household income was increasing, compared with shared income and agriculture income (Haggblade et.al, 2007). Meanwhile, Southeast of Myanmar, Gulf of Mottama is one of the major intertidal mudflats in the world, and its estuarine section was designated under the Ramsar international wetland convention (GoMp, 2018). This coastal Region’ ecosystem provides a wide range of services such as supporting food, water supply, flood protection, supporting the livelihoods of 1,500,000 people living across the coastal area. Despite all these positive benefits, this region is under threat and pressure by unsustainable use of coastal natural resources, over-fishing, and habitat destruction which become the risk of their lives and livelihood option. Most of the local coastal communities are fisherfolks, farmers, landless and disadvantaged people, relying on diverse livelihoods strategies as fishing, farming, casual labor and migration. In Bago, 13 villages were selected depending on the selection criteria from That Nat Pin Township and Kawa Township in Bago Region. The overall objective is that the unique biodiversity of the Gulf of Mottama is conserved and sustainably developed to benefit human communities that depend on it (GoMp, 2018). In this study, secondary data were taken from the reports of General Administrative Department and Department of Population (Myanmar Population and Housing Census data) which were published in 2017 and calculated by using descriptive statistics. According to the report (Myanmar Population and Housing Census data, 2018), Tha Nat Pin Township is specified as the township developed in terms of economy, in which fishery (43%) is the main livelihood activity, with agriculture (32%), daily workers (9%) and livestock (6.3%). Number of population in this township showed 164,763 people in 2018 which include 27,152 households in rural sector and 3,031 households in urban sector. About 89% of households are in the rural sector and 96% of households are Buddhist in this township.
Rice is the main crop and second crops in this region are groundnut, green gram and black gram. Tha Nat Pin Township has moderately good transportation conditions and work opportunities because it has not only agriculture but also fields such as animal husbandry, several small industries and fishery products, etc. In this township, vegetables and dried fishery products cannot be exported to other townships. Meanwhile, chili, potato, various peas and beans and edible oil products are mainly imported from the dry zone region. According to the impact of seawater level intrusion and land erosion, mud dyke and maintenance for a stream near the Gulf of Mottama Region modified by the plan of environmental conservation from Governmental department. Local fishermen and wild fish pond cannot earn household income during the monsoon season. Individual income is slightly increased year by year and US$1,055 individual income in 2018. Therefore, livelihoods of people who live in Tha Nat Pin Township stand on insecurity in food situation. According to the result of this report, edible oil, meat and dairy products were insufficient for people in Tha Nat Pin Township. Income generation helps to overcome food sufficiency the problem of which is lack of money faced by the vulnerable population. This research paper was carried out through the socio-economic characteristic of sampled households in three villages of Tha Nat Pin Township with the objectives of: (1) investigating the different livelihood activities groups; and (2) determining income diversification of income sources in the selected area.
METHODOLOGY
Data collection and sampling technique
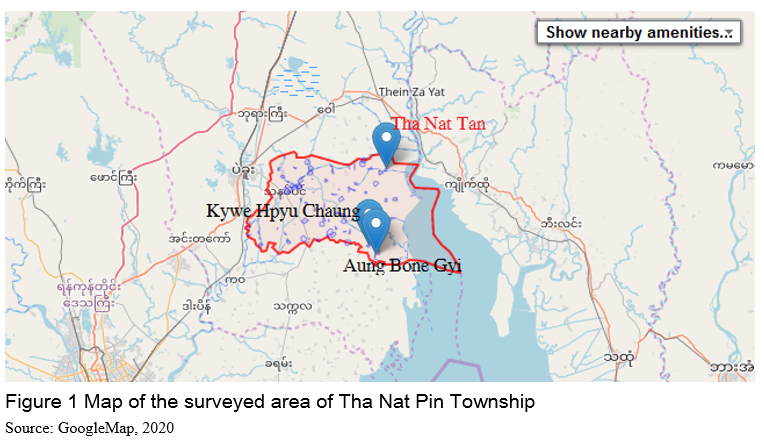
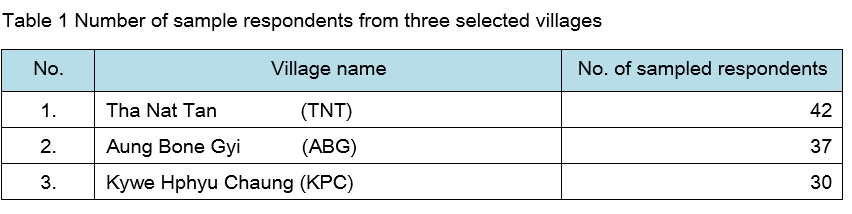
Primary data collection for this research was collected from three villages from Tha Nat Pin Township, Bago Region, namely as Tha Nat Tan (TNT), Aung Bone Gyi (ABG) and Kywe Hphyu Chaung (KPC) village. In this study, both primary and secondary data collection were conducted in the selected area. Primary data collection was carried out in July 2018 in Bago Region. There were 109 sampled households in three selected villages from Tha Nat Pin Township, Bago Region (Figure 1). For data collection, snowball sampling method was used to select the sample households who are working in different livelihood approaches for their sufficiency from these areas with Semi-structure questionnaire, key informant interview and focus group discussion. The snowball sampling (Flick U, 2018) was employed in the selection of respondents. From the (3) villages that were selected to identify the members of the target group to balance for different livelihood activities in selected villages, primary data collection was carried out by 109 respondents for an individual in-depth interview and participatory tools of diagrams in each village last October, 2018. The following Table 1 described the number of respondents per village for an individual in-depth interview.
Both descriptive analysis (i.e mean, frequency, percentage and range) and one-way ANOVA (Kruskal-Wallis test) were employed to analyze the objective of the study with the statistical package as R software (Version 3.4.2) and Microsoft Office Excel.
RESULTS AND DISCUSSION
Sociodemographic characteristics
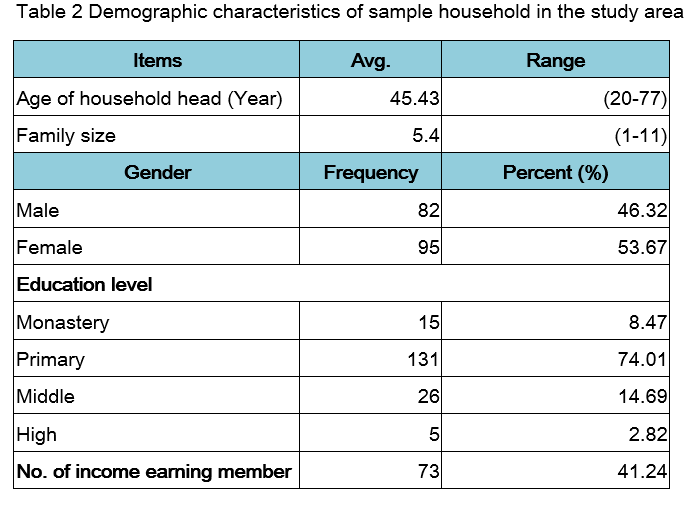
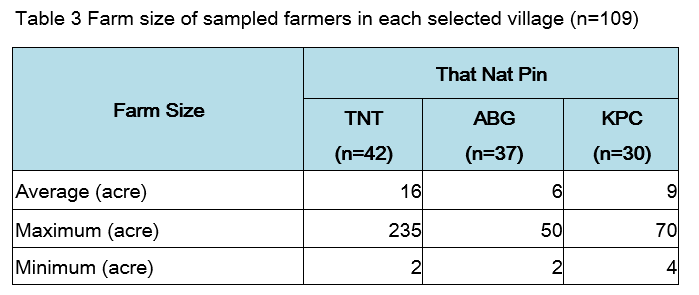
The socioeconomic variables analyzed and discussed are age, gender, farming experiences, household size, farm size, education status, annual household income and the number of income-earning from family members. From the findings, all respondents stated that 100% were married with a maximum of 11 family members but, an average of 5 members per household head. The result showed that the average age of the household head was above 45 years old. Approximately 74% of sampled respondents had attended primary school level. Around 41% of income family members earned a monthly income from international migration. About 95% of female and 82% of male sampled respondents collected with the individual interview in Table 2. The number of household infrastructure assets results in 76% of respondents who had a zinc-roof house in TNT. In these three selected villages, farm size and different types of primary jobs by each selected respondent illustrated in Table 3. Among the total 109 sampled farmers in selected villages, the finding is that sampled farmers had owned farmlands with the average size of 16 acres in TNT, 5.6 acres in ABG and 9.4 acres in KPC village. The majority of respondents stated that 71% of sampled respondents in TNT work in on-farm jobs, 14.28% work in casual worker and the tiny portion work in aquaculture and self-employment. In ABG village, the percentages of sampled respondents work differently: 59% in agriculture, 32% as causal workers, 5% are self-employment and 2.7% work in aquaculture. As the results showed, the majority of the sampled respondents in KPC village work both in agriculture (63%) and are causal workers (36.67%). Therefore, the major occupation showed that agriculture and causal workers are the major pre-occupation in these three selected villages in TNP Township.
Disaster risk situation and losses in the study areas
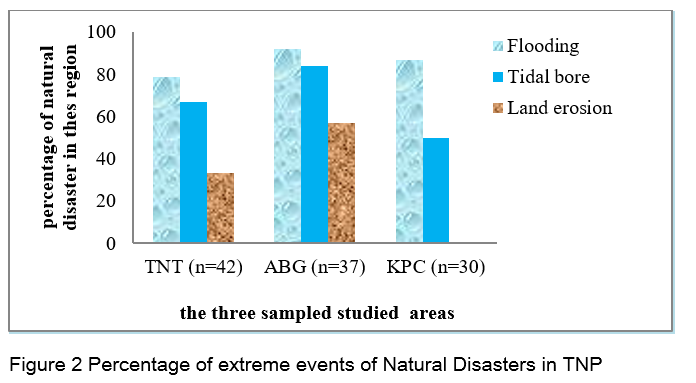
Myanmar had already experienced intense rainfall and the severe cyclones along its coastlines. The Gulf of Mottama Region, in TNP Township, and other selected areas had faced several extreme natural disasters such as flooding, tidal bores and land erosion. Among these disasters, flooding is a major problem. From the result of the authors Aldebert A and Meulle G (2013), the impacts of climate change in Myanmar implied different natural disasters such as the rise of the sea level and saltwater intrusion, a higher incidence of droughts, a loss of biodiversity and ecosystems, and a loss of land resources. In Bago Region, of the number of victims in 2017-2018, 38,110 persons had been affected and/or damaged by flooding, 10,339 people was affected by river banking erosion and 8,089 people were affected by the storm in Bago Region (Myanmar Statistical Year Book, 2018). In Figure 2, the extreme events of climate change in the villages of TNT, ABG and KPC showed that the percentage of natural disasters appeared in these selected villages. The results of the extreme events like flooding intensified by 90% and 80% in the studied areas which destroyed the respondents’ homes and livelihoods. Land erosion was occurred in TNT and ABG villages. The tidal bores affected 50% to 80% of the population in the studied areas. Since 2013, severe flooding and land erosion in TNT and 2015 in ABG and KPC villages have repeatedly wiped out destroyed crops and livestock during the monsoon season in the GoM region.
Land erosion appeared from August to November after flooding duration in every year. According to the results, some respondents described that heavy winds in the TNP village in 2018 destroyed several rural infrastructure and affected the livelihood of residents and farmers. Land erosion destroyed 300 acres planted to rice in farmland areas in the TNT village, 1,060 acres from ABG village, and around about 1,000 acres from KPC village. Another impact of the respondents’ livelihood was home gardens, wild fish ponds and also drinking water, lake, road and infrastructure etc. In ABG village, the result of the respondents mentioned that “in 2018 of August, the foremost time of the flooding of tidal waves appeared at least two or three times per day in two weeks per year.” As a result, the author M.P. de Ridder (January, 2017) found that the flooding and tidal waves acutely affected the food security and work opportunities in the local areas as well as the commercial fishermen in this Region. The facts are that the tidal wave arrived three days after the full/new moon near to the village. Surprisingly, the studied areas have not accessed the weather alert near the villages in the Gulf of Mottama Region. In these three villages, farmlands, livestock, infrastructure were destroyed with low food or basic services halted and affected a lot of destitute.
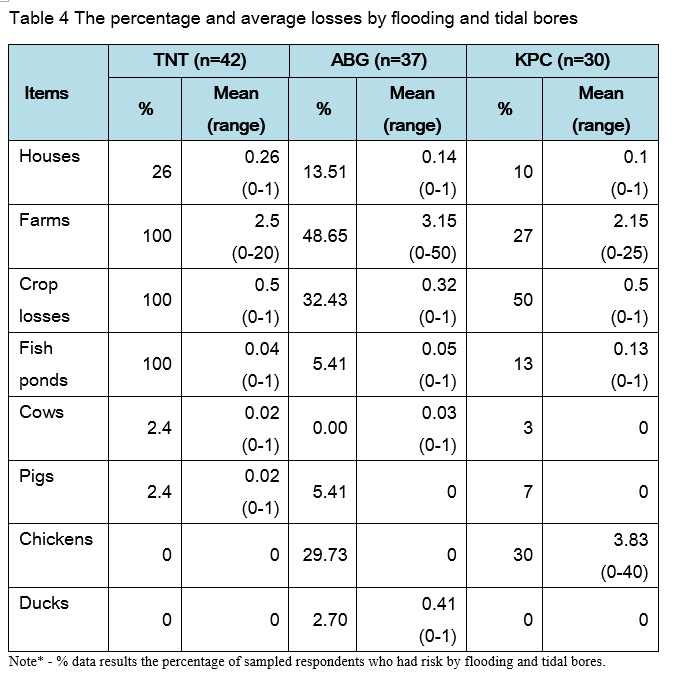
Table 4 showed that the result for the damages of farmlands, fish ponds, livestock and infrastructure took folding beating as well as land erosion in the studied areas in TNP Township. The percentage of sampled respondents from the three villages described in the following table presents the number of risk sampled respondents by flooding and land erosion. The results as summarized in the table, found that the major impact in these three villages were borne by disasters which affected homes, destroyed farmlands, crop yield, fish ponds and livestock. Flooding and tidal bores took the highest total number of destroyed farmlands in these three villages. The second-highest losses found respondents’ homes and fish ponds and crop yield losses as shown in the table. The livestock destroyed had low impact based on the sampled respondents. Chicken rearing faced the highest impact of flooding and tidal bores among other livestock. In the Region, extreme event in monsoon season as high tide and erosion damaged on over-clearing of vegetation and risk in agricultural lands and fish ponds (Wongthong P, 2015). Typically, natural disasters directly impacted the farmland areas of agricultural crop production and livestock rearing.
Livelihood diversification
․ Livelihood activities and shared income
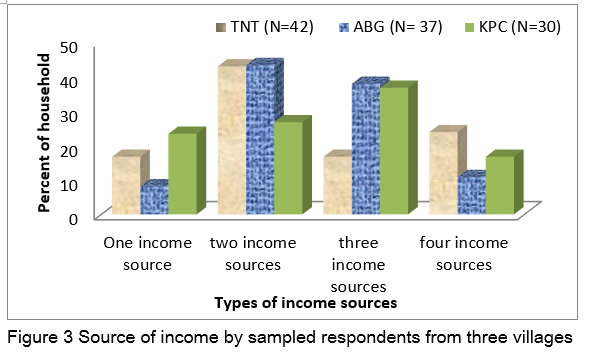
The income source of sample households demonstrated in Figure 3. According to the figure, 17 % of sampled respondents from TNT village, 8% of ABG and 23% of KPC depended on only one income source. About 43% each of sampled respondents from TNT and ABG villages and 27% of KPC village relied on two income sources, which were the highest in the former two villages. And, 17% of sampled respondents from TNT and nearly 40% each of sampled respondents from ABG, and KPC villages had three income sources. Above 20% of TNT’s sampled respondents and 11% of ABG village and 17% of KPC village had four income sources.
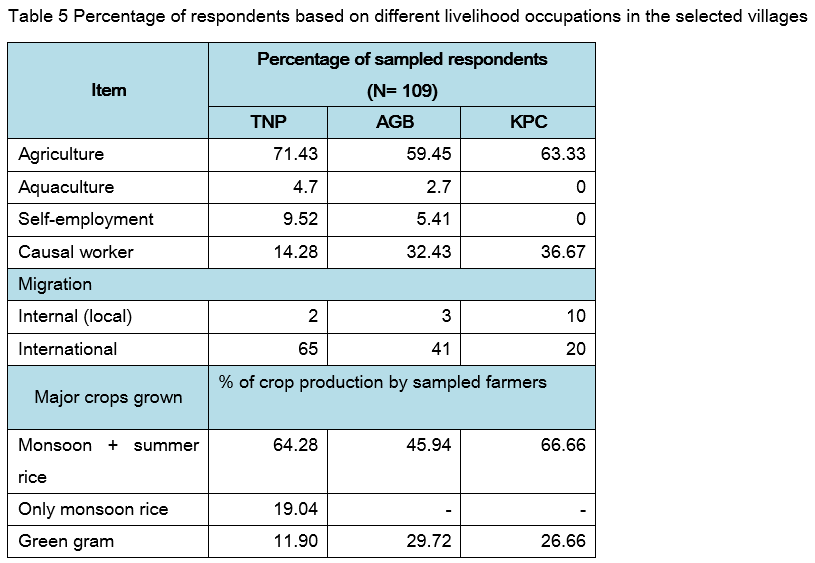
Regarding the primary source of income, 71% of farm households from TNT village and above 60% from ABG and KPC villages earned from farming activities and very few percent in aquaculture and self-employment occupation, as shown in Table 5. As in the sampled households, the primary occupation was agriculture and causal labor. For Migration labor, there are two types of migration--internal (local) and international migration. Landlessness and migration have both negative and positive effects to increase income options for their families (Myint T, 2015). According to the suggestion of author Thet KK (2014), demographic factor and social factor influence international and internal migration in TNP Township.
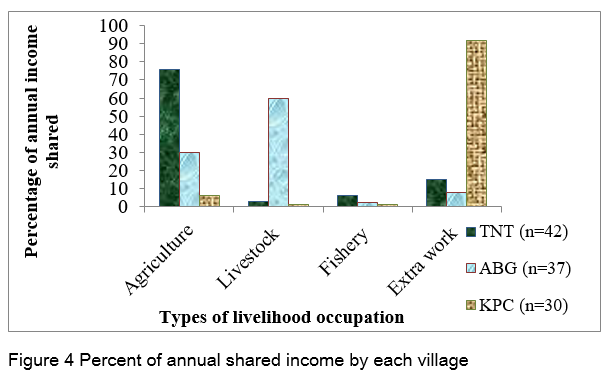
There were very few per cent of internal migration labor from TNT and ABG villages and 10% from KPC were found and 65% of international migration labor from TNT, 41% from ABG and 20% from KPC, respectively. As showed in the monsoon and summer rice production status, it was found that 64.28% of monsoon rice grew in TNT village, and 45.94% in ABG village and 66.66% in KPC were found. And 19.04% from TNT’ farmers grew only monsoon rice in this village. Moreover, 11.90% of green gram grew in TNT, 29.72 % in ABG and 26.66% in KPC village. While emphasizing the income status, as shown in Figure 4, it was stated that 76% of annual income earned from crop production and 15% of extra work activities in TNT and very few per cent belong to the other portion. Moreover, 60% of annual shared income earned came from livestock and half of this shared income came from crop production in ABG village and very few per cent belonged to other portion. Wild fish pond earned high income in this region which received between US$16,846 and US$20,215 on average per 0.5 acre sizes (2,023.43 square meters) of the wild fish pond per year. Fishery activities in the selected areas, local fishing per day received at a range of 3 kg and 163 kg with an average price between US$2.9 and US$3.2 per viss (1 viss = 1.63 kilograms) within terms of poultry livestock rearing, it was mostly found that chicken, ducks and pigs were a common type of livestock rearing owned by respondents for additional income and also as a supplementary source. Chickens and ducks earned US$2.23 per kilogram.
In KPC village, 92% got extra work activities income and very few portions earned from others. Normally, the villagers sell pig with prices ranging from US$699 to US$744. Besides, other off-farm activities mentioned were small businesses and other occupations like drivers, carpenters and daily workers in TNP Township. The small business included rice retailers and wholesalers, shopkeepers, hucksters, carpenters and drivers (car, motorcycle, boat). The boat drivers’ income is considered commercial income generation especially during the rainy season. Daily work consists of farmland work on agribusiness like rice harvesting or transplanting in the crop production season. Engaging in small business and becoming drivers are also major options in these villages. Such kinds of daily work earned with normal wages between US$5.2 and US$5.9 for male workers and US$2.8 for female workers per day. Carpenters and workers in the sewing industry received a different range of daily wages depending on the number of their working days. As a result, it will be noticed that agricultural crop production was the highest shared income in TNT village and extra work activities were the highest shared in KPC village. From the result of group discussion, rice yield and price had changed depending on the quality of varieties and weather. Normally, the average yield varies between 142 kg and 171 kg per acre depending on rice varieties.
Financial support
In these selected villages, the majority of sampled respondents received the credit loan for their work from four organizations such as Gulf of Mottama Village Development Committee (GoMp-VDC), Myanmar Agricultural Development Bank (MADB), ThamaWarYaMa village development group and Mya Sein Yaung group. In these selected villages, more than half of sampled respondents received the loan from GoMp-VDC with the interest rate of 1.5%, 40% from Mya Sein Yaung group with the interest rate of 1.5%. Besides, the other minority of sampled respondents received from MADB (22%) with the interest rate of 0.67% and ThamaWarYaMa (19%) with the interest rate of 0.50%. GoMp-VDC and MADB support US$111.61 per villager who is kind of owned land farmers or project members of Gulf of Mottama project. The other two organizations support US$148.81 per villager who wants to take a loan based on their willingness.
Income composition of different livelihood activities
The parametric method with Kruskal-Wallis test within R was to compare the mean rank in each livelihood activities, and the analyzed results were not significant with the annual mean income and livelihood activities group from these selected villages. However, in this section, the annual mean income of sampled respondents compared with Gross Domestic Product per capita in Myanmar recorded at US$1,484 in 2017 by World Bank portal (GDP per capita, 2017). According to the exchange rate (2017), GDP per capita in Myanmar (2017) showed US$1,484 in 2017. The findings showed how much was earned and the annual mean income by sampled respondents based on different diversification of their livelihood activities.
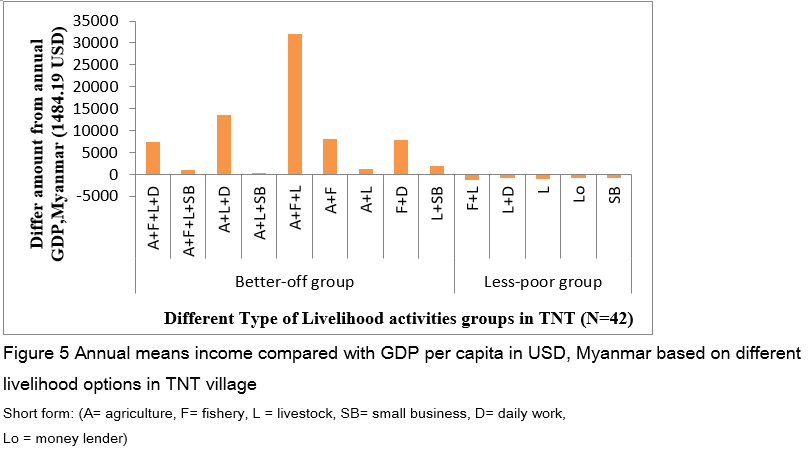
Tha Nat Tan village (TNT): In TNT village, Figure 5 describes the annual mean income earned livelihood activities in TNT which differed from US$1,484 (GDP per capita per person in Myanmar. These livelihood options consist of agriculture, fishery, livestock, daily work and small business in TNT village. As the results showed in Figure 5, A+F+L (3T) earned US$32,085 as the highest annual mean income amount among 14 livelihood activities. The second highest income earned from A+L+D (3T) with US$13,594 and the third one found US$8,181 from A+F (2T). Meanwhile, livestock rearing, small local fisheries and daily work earned low level of annual mean income compared with GDP per capita as shown in this Figure.
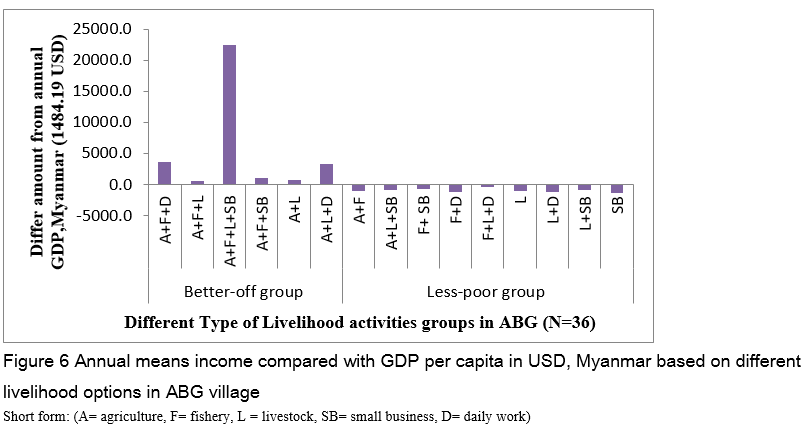
Aung Bone Gyi village (ABG): The annual mean income earned livelihood activities in ABG village which differed from GDP per capita per person with US$1,484 in Myanmar. The result found in Figure 6 showed that 17 livelihood activities consist of agriculture, fishery, livestock, daily work and small businesses in the ABG village. As the finding showed in Figure 6, A+F+L+SB (4T) earned US$22,426 as the highest annual mean income amount. The second highest income earned from A+F+D (3T) with US$3,608 and the third one found US$3,378 from A+L+D (3T). Among these livelihood activities, 8 livelihood activities with small businesses, small local fishery and daily work earned very low annual mean income compare with GDP per capita as shown in this Figure. Thus, the most effective way to avoid poverty in small farm households is to be assisted by non-farm activities plus small-farm crop production by the management of “monetization” by IFAD (2012).
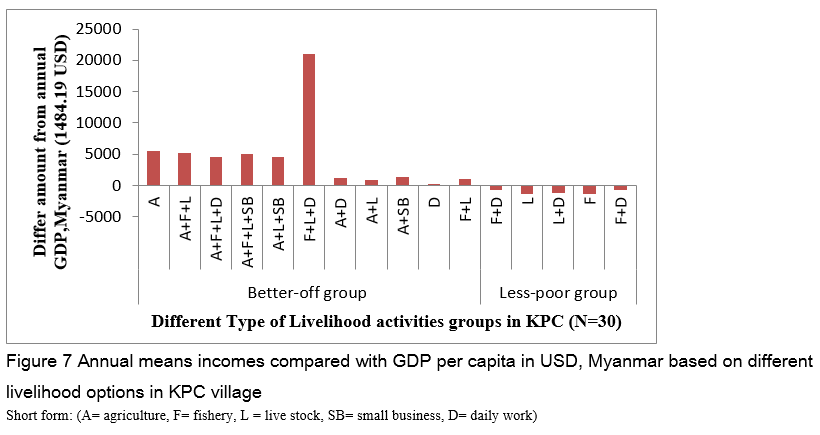
Kywe Hphyu Chuang village (KPC): In this village, the annual mean income earned livelihood activities in KPC village which differed from the US$1,484 (GDP per capita per person in Myanmar (Figure 7). The result found that 14 livelihoods activities consist of agriculture, fishery, livestock, daily work and small business. As shown in this Figure, A (1T) earned US$5,504 as the highest annual mean income amount. The second highest income earned from A+F+L (3T) with US$5,199 and the third one found US$5,051 from A+F+L+SB (3T). Among these livelihood activities, only four livelihood activities with small local fishery and daily work earned low level of annual mean income compare with GDP per capita as shown in this village. Additionally, non-agricultural employment increases as rural poverty declines and off-farm rural employment is crucial to reducing rural poverty to sufficient livelihood within the smallholders and landless labors by Sheyin (2016). It ran contrary to the finding of (Udoh and Nwibo 2017), farming only failed to stay out of poverty. Regina N et al. (2015) suggested livestock activities are important for wealth storage in the rural sector. Noticeably, diversification of livelihood activities depends on potential livelihood activities and preferences of the villagers of this coastal region. Sustainable livelihoods approach helps better understand livelihood opportunities and challenges within and between the coastal provinces (Glavovic BC and Boonzaier S, 2007). Thus, the same findings of the research (Udoh and Nwibo 2017), showed that farmers combined host of one activity of on-farm livelihood and other non-farm livelihood activities to make more income.
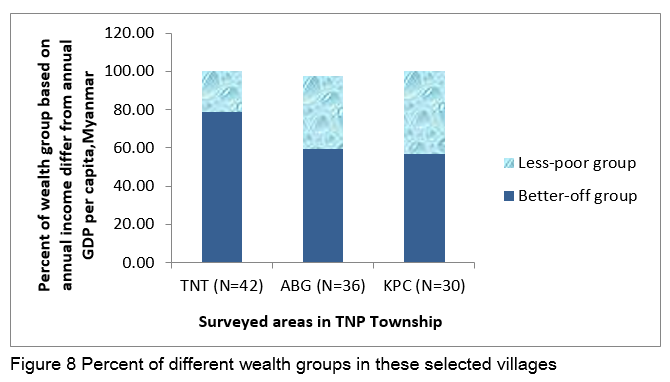
According to Figure 8, the result in this section separated two groups as a better-off group and less-poor group of income level. The annual mean income from TNT village received higher income rate than KPC and ABG village based on wealth group. When the annual income compared between these villages, the TNT villagers found the highest amount of annual income with different livelihood group activities. Based on the study, it is possible to conclude that more diversified livelihood activities group earned higher income source than the less diversified groups as the same finding with the author Regina N et al. (2015).
Constraints in the selected surveyed villages (N=109)
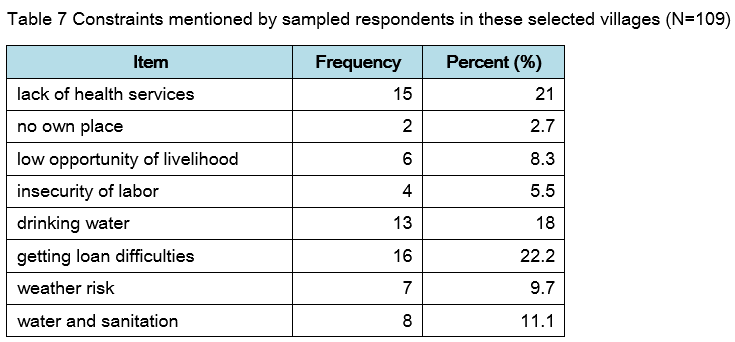
The constraints faced by the sampled respondents are shown in Table 7. Sampled respondents have to get a loan from the organization for their security and investments. However, the sampled respondents faced the constraints of getting loan insufficiency (22.2%). About 11.1% of the sampled respondents faced with water and sanitation problems in these villages. Getting loans with an inappropriate interest rate, limited investments for expending on their businesses leading to poor quality of production were other constraints faced by the sampled respondents. As the risk faced by the sampled respondents, the main risk for the villagers was weather risk leading to destroyed farmlands and work opportunities as crop production, fishery, self-employment and daily work.
CONCLUSIONS AND RECOMMENDATIONS
This study examines the livelihood diversification and different annual income earned per household. When comparing the income level of the farming households, it was found that more than half of the sampled respondents in the selected areas belonged to the better-off income level group. The highest annual mean income described three types of livelihood group as A+F+L (3T) in TNT village, four types of livelihood group as A+F+L+SB (4T) in ABG village and only agricultural crop production as A (1T) in KPC village, respectively. In this region, there was no group that belonged to the high education school. In fact, the majority of respondents (74%) completed primary school level, with 14% belonging to the middle school level. Most of sampled households have an average of 5 family members per household. In the study, among the 109 sampled respondents, 46% were male and 53 % were female. Agriculture is the major occupation in the selected areas, of which 71% can be found in TNT village, 59% in ABG village and 63% in KPC village, respectively. As far as disasters are concerned, 80% of the disasters came from floods which had a severe impact by destroying farms, infrastructures, houses and livestock. The rest were land erosion and tidal bore. About 73% of family members earned supporting income to their families from migration. For the livelihood situation in TNP Township, these surveyed villages made their livings on agriculture activities and off-farm activities such as fishery (local and commercial fisherman), daily work, small business, driver and small business. The major crop production is monsoon rice, summer rice and green gram crop production. Above 60% of sampled respondents grew monsoon and summer rice in TNT and KPC village and nearly 50% in ABG village. According to the results, 43% of TNT and ABG villages employed two income sources and 37% of KPC village from three income sources among the other sources of income. The highest shared income (76%) was earned from crop production in TNT village, from livestock (60%) in ABG village and extra work activities (off-farm) (92%) in KPC village.
The results of the two-level income group reveal that the majority of respondents (78%) came from the TNT village, and above 50% came from ABG and KPC villages which showed that they were in the better-off group category. The different findings showed that of the GDP per capita in Myanmar, only agriculture crop production can survive in the KPC village. Another author recognized that high yield production becomes an effective way to sufficiently work on agricultural crop production. Consequently, the study concluded that agriculture plus off-farm livelihood activities group earned the highest annual income than only off-farm and non-farm employment. The research findings recommend conducting further research with the in-depth study of sustainability of their livelihood with the dynamic assessment of livelihood portfolios and living expenses to know the poverty level in these research sites and also the different sites where there are disaster-prone areas near the Gulf of Mottama. Government department, NGOs and INGOs might support dramatically in terms of hygiene and provision of safe drinking water in risk areas. For livelihood options, the rural development organizations and department might take the action plan to recover for livelihood options mainly on agriculture, fishery and livestock rearing plan and also revolving funds to create income generation.
REFERENCES
ACAPS, 2018. ACAPS Briefing Note: Myanmar - Floods in Yedashe, Taungoo, Oktwin and Kyaut Gyi Townships, Bago Region (10 September 2018), https://reliefweb.int/report/myanmar/acaps-briefing-note-myanmar-floods-yedashe-taungoo-oktwin-and-kyaut-gyi-townships
DFID,2000. Sustainable Livelihoods Guidance Sheets. Department for International Development accessed on 21,7,2018, http://www.livelihoods.org/info/
GDP per capita, 2017. Trading economics.com website: summary of Myanmar GDP per capita, 2017, https://tradingeconomics.com/myanmar/gdp-per-capita
Glavovic BC, Boonzaier S, 2007. Confronting coastal poverty. Building sustainable coastal livelihoods in South Africa. Ocean & Coastal Management, 50 (1-2), 1–23.
GoMp,2018. Overview of Phase 2 of the Gulf of Mottama Project (GoMp), project plan document for 2018 to 2021, Helvetas project,Myanmar,unpublished.
Haggblade, S., Hazell, B. and Reardon, T. (2007). Transforming the Rural Non-farm Economy,Opportunities and Threats in the Developing World. Baltimore, John Hopkins University Press.
Myanmar Population and Housing Census data,2018. Myanmar Population and Housing Census data: Mynmar Information Management Unit, Township profile,2018, Myanmar Population and Housing Census data, General Administrative Department and Department of Population ,http://themimu.info/mimu-township-profiles-dashboard.
MOALI, 2016. MOALI 2016: Myanmar agriculture at a Glance, 2016, Ministry of Agrilcutre, Livestock and Irrigation Department of Planning.
Myanmar Statistical Year Book, 2018. Myanmar Statistical Year Book : Central Statistical Organisation,2018. https://www.csostat.gov.mm, http://www.mmsis.gov.mm.
Myint T, 2015. Non-fish value chain study. Community-Led Coastal Management in the
Twigg J, 2015. Disaster risk reduction. Overseas Development Institute: London, UK, 382, accessed on 19.11.2018.
Udoh, N. and S. Nwibo (2017). "Socio-Economic Determinants of Rural Non-Farm Households Income Diversification in Southeast Nigeria." International Research Journal of Finance and Economics 164.
World Bank Group, 2015. Myanmar Post-Disaster Needs Assessments of Floods and Landslides. July-September 2015, Government of the Union of Myanmar, 302p, accessed on 24.12.2017.


Rural Household’s Income Diversification, Climate Risk and Wetland Ecosystem: Case Study in Tha Nat Pin Township, Bago Region, Myanmar
ABSTRACT
An arm of the Andaman Sea in the southern part of Myanmar, Gulf of Mottama Region (GoM), is supporting both coastal population and agricultural productivity in Bago Region and Mon State. The livelihoods in the rural sector depend on agriculture, livestock, and fishing and self-employment activities. In the Gulf of Mottama Region, aquaculture is essential to work to create income generation for fisherman. The study investigates the socioeconomic situation and income diversification from different sources of group livelihood activities in Tha Nat Pin Township, Bago Region. Snowball sampling technique was adopted in the collection of 109 rural households using a semi-structured questionnaire and focus group discussion. Both descriptive and one-way ANOVA statistics were employed to verify the objectives of the study. The result of the analysis showed that the majority of sampled households have a mean age of 45 years with an average family size of 5 people. The majority of sampled households completed primary school education (74%) and 41% of the income-earning member is from international migration. The study revealed that above 80% of flooding in these studied areas directly destroyed the farmlands, fish ponds and livestock and housing. The findings showed that agriculture is the highest income shared in these villages where 66% of sampled farmers grew in monsoon and summer seasons. The study found that the highest annual mean income earned from three types of livelihood groups included agriculture, fishery and livestock (US$32,085) in Tha Nat Tan Village (TNT). In Aung Bone Gyi Village, four types of livelihood groups (agriculture, fishery, livestock and small business) earned US$22,427 and only one livelihood group as agricultural crop production (US$5,504) in Kywe Hphyu Chaung Village (KPC). The better-off group was found in Tha Nat Tan Village (above 78%), in Aung Bone Gyi Village and Kywe Hphyu Chaung Village (nearly 60%). One-third of sampled respondents received poor income return from livelihood with less diversification groups. More diversified livelihood options obtained higher income than only one livelihood option. Agriculture plus other livelihood activities can earn better-off level of sampled household in this study. It was recommended that agricultural crop production should be adequately improved with climate-smart agriculture technology and credit access and easy access to input and farm machineries and post-harvest technology in these areas.
Keywords: socioeconomics, livelihood activities, income diversification
INTRODUCTION
In Myanmar, rural areas are also vulnerable to climate change factors and natural disasters. The consequences of disasters are a serious threat which causes loss of life security and assets, social and economic disruption, injury and disease and the damage to the environment (Twigg J, 2015). Most of people who live in rural areas rely on agriculture as the main source of livelihood which was affected directly by monsoon seasonal floods (ACAPS, 2018). Between 2017 and 2018, the GDP value contribution from the service sector was found to have the highest share of gross domestic product at current prices (40%) and the second-highest sector was the industry sector with 36.3% and the last sector was agriculture sector with 23.3% (Myanmar Statistical Year Book, 2018). According to Sati Vp and Vangchhia L (2017), livelihood is identified as different pathways to distinguish between current assets, livelihood options, coping with the current situation and requirement. According to DFID (2000), livelihood strategies are lying on asset status and policies, institutions and processes. Livelihood approaches seemed to apply for everything: livestock, fisheries, forestry, agriculture, health, urban development and more. Regarding the sources of income, the household size in this region is the main factor determining regarding their work in agriculture (A) holdings and also in non-agriculture activities such as aquaculture (F), livestock rearing (L), small business (SB) and daily work (D). Linking to distress-push, less profitable and market failures in farming production can result in income diversification (Udoh and Nwibo, 2017).
In Demand-pull, households are pulled to off-farm activities which are high or less risk than agricultural crop production. Some studies reported non-farm income with agriculture in total household income was increasing, compared with shared income and agriculture income (Haggblade et.al, 2007). Meanwhile, Southeast of Myanmar, Gulf of Mottama is one of the major intertidal mudflats in the world, and its estuarine section was designated under the Ramsar international wetland convention (GoMp, 2018). This coastal Region’ ecosystem provides a wide range of services such as supporting food, water supply, flood protection, supporting the livelihoods of 1,500,000 people living across the coastal area. Despite all these positive benefits, this region is under threat and pressure by unsustainable use of coastal natural resources, over-fishing, and habitat destruction which become the risk of their lives and livelihood option. Most of the local coastal communities are fisherfolks, farmers, landless and disadvantaged people, relying on diverse livelihoods strategies as fishing, farming, casual labor and migration. In Bago, 13 villages were selected depending on the selection criteria from That Nat Pin Township and Kawa Township in Bago Region. The overall objective is that the unique biodiversity of the Gulf of Mottama is conserved and sustainably developed to benefit human communities that depend on it (GoMp, 2018). In this study, secondary data were taken from the reports of General Administrative Department and Department of Population (Myanmar Population and Housing Census data) which were published in 2017 and calculated by using descriptive statistics. According to the report (Myanmar Population and Housing Census data, 2018), Tha Nat Pin Township is specified as the township developed in terms of economy, in which fishery (43%) is the main livelihood activity, with agriculture (32%), daily workers (9%) and livestock (6.3%). Number of population in this township showed 164,763 people in 2018 which include 27,152 households in rural sector and 3,031 households in urban sector. About 89% of households are in the rural sector and 96% of households are Buddhist in this township.
Rice is the main crop and second crops in this region are groundnut, green gram and black gram. Tha Nat Pin Township has moderately good transportation conditions and work opportunities because it has not only agriculture but also fields such as animal husbandry, several small industries and fishery products, etc. In this township, vegetables and dried fishery products cannot be exported to other townships. Meanwhile, chili, potato, various peas and beans and edible oil products are mainly imported from the dry zone region. According to the impact of seawater level intrusion and land erosion, mud dyke and maintenance for a stream near the Gulf of Mottama Region modified by the plan of environmental conservation from Governmental department. Local fishermen and wild fish pond cannot earn household income during the monsoon season. Individual income is slightly increased year by year and US$1,055 individual income in 2018. Therefore, livelihoods of people who live in Tha Nat Pin Township stand on insecurity in food situation. According to the result of this report, edible oil, meat and dairy products were insufficient for people in Tha Nat Pin Township. Income generation helps to overcome food sufficiency the problem of which is lack of money faced by the vulnerable population. This research paper was carried out through the socio-economic characteristic of sampled households in three villages of Tha Nat Pin Township with the objectives of: (1) investigating the different livelihood activities groups; and (2) determining income diversification of income sources in the selected area.
METHODOLOGY
Data collection and sampling technique
Primary data collection for this research was collected from three villages from Tha Nat Pin Township, Bago Region, namely as Tha Nat Tan (TNT), Aung Bone Gyi (ABG) and Kywe Hphyu Chaung (KPC) village. In this study, both primary and secondary data collection were conducted in the selected area. Primary data collection was carried out in July 2018 in Bago Region. There were 109 sampled households in three selected villages from Tha Nat Pin Township, Bago Region (Figure 1). For data collection, snowball sampling method was used to select the sample households who are working in different livelihood approaches for their sufficiency from these areas with Semi-structure questionnaire, key informant interview and focus group discussion. The snowball sampling (Flick U, 2018) was employed in the selection of respondents. From the (3) villages that were selected to identify the members of the target group to balance for different livelihood activities in selected villages, primary data collection was carried out by 109 respondents for an individual in-depth interview and participatory tools of diagrams in each village last October, 2018. The following Table 1 described the number of respondents per village for an individual in-depth interview.
Both descriptive analysis (i.e mean, frequency, percentage and range) and one-way ANOVA (Kruskal-Wallis test) were employed to analyze the objective of the study with the statistical package as R software (Version 3.4.2) and Microsoft Office Excel.
RESULTS AND DISCUSSION
Sociodemographic characteristics
The socioeconomic variables analyzed and discussed are age, gender, farming experiences, household size, farm size, education status, annual household income and the number of income-earning from family members. From the findings, all respondents stated that 100% were married with a maximum of 11 family members but, an average of 5 members per household head. The result showed that the average age of the household head was above 45 years old. Approximately 74% of sampled respondents had attended primary school level. Around 41% of income family members earned a monthly income from international migration. About 95% of female and 82% of male sampled respondents collected with the individual interview in Table 2. The number of household infrastructure assets results in 76% of respondents who had a zinc-roof house in TNT. In these three selected villages, farm size and different types of primary jobs by each selected respondent illustrated in Table 3. Among the total 109 sampled farmers in selected villages, the finding is that sampled farmers had owned farmlands with the average size of 16 acres in TNT, 5.6 acres in ABG and 9.4 acres in KPC village. The majority of respondents stated that 71% of sampled respondents in TNT work in on-farm jobs, 14.28% work in casual worker and the tiny portion work in aquaculture and self-employment. In ABG village, the percentages of sampled respondents work differently: 59% in agriculture, 32% as causal workers, 5% are self-employment and 2.7% work in aquaculture. As the results showed, the majority of the sampled respondents in KPC village work both in agriculture (63%) and are causal workers (36.67%). Therefore, the major occupation showed that agriculture and causal workers are the major pre-occupation in these three selected villages in TNP Township.
Disaster risk situation and losses in the study areas
Myanmar had already experienced intense rainfall and the severe cyclones along its coastlines. The Gulf of Mottama Region, in TNP Township, and other selected areas had faced several extreme natural disasters such as flooding, tidal bores and land erosion. Among these disasters, flooding is a major problem. From the result of the authors Aldebert A and Meulle G (2013), the impacts of climate change in Myanmar implied different natural disasters such as the rise of the sea level and saltwater intrusion, a higher incidence of droughts, a loss of biodiversity and ecosystems, and a loss of land resources. In Bago Region, of the number of victims in 2017-2018, 38,110 persons had been affected and/or damaged by flooding, 10,339 people was affected by river banking erosion and 8,089 people were affected by the storm in Bago Region (Myanmar Statistical Year Book, 2018). In Figure 2, the extreme events of climate change in the villages of TNT, ABG and KPC showed that the percentage of natural disasters appeared in these selected villages. The results of the extreme events like flooding intensified by 90% and 80% in the studied areas which destroyed the respondents’ homes and livelihoods. Land erosion was occurred in TNT and ABG villages. The tidal bores affected 50% to 80% of the population in the studied areas. Since 2013, severe flooding and land erosion in TNT and 2015 in ABG and KPC villages have repeatedly wiped out destroyed crops and livestock during the monsoon season in the GoM region.
Land erosion appeared from August to November after flooding duration in every year. According to the results, some respondents described that heavy winds in the TNP village in 2018 destroyed several rural infrastructure and affected the livelihood of residents and farmers. Land erosion destroyed 300 acres planted to rice in farmland areas in the TNT village, 1,060 acres from ABG village, and around about 1,000 acres from KPC village. Another impact of the respondents’ livelihood was home gardens, wild fish ponds and also drinking water, lake, road and infrastructure etc. In ABG village, the result of the respondents mentioned that “in 2018 of August, the foremost time of the flooding of tidal waves appeared at least two or three times per day in two weeks per year.” As a result, the author M.P. de Ridder (January, 2017) found that the flooding and tidal waves acutely affected the food security and work opportunities in the local areas as well as the commercial fishermen in this Region. The facts are that the tidal wave arrived three days after the full/new moon near to the village. Surprisingly, the studied areas have not accessed the weather alert near the villages in the Gulf of Mottama Region. In these three villages, farmlands, livestock, infrastructure were destroyed with low food or basic services halted and affected a lot of destitute.
Table 4 showed that the result for the damages of farmlands, fish ponds, livestock and infrastructure took folding beating as well as land erosion in the studied areas in TNP Township. The percentage of sampled respondents from the three villages described in the following table presents the number of risk sampled respondents by flooding and land erosion. The results as summarized in the table, found that the major impact in these three villages were borne by disasters which affected homes, destroyed farmlands, crop yield, fish ponds and livestock. Flooding and tidal bores took the highest total number of destroyed farmlands in these three villages. The second-highest losses found respondents’ homes and fish ponds and crop yield losses as shown in the table. The livestock destroyed had low impact based on the sampled respondents. Chicken rearing faced the highest impact of flooding and tidal bores among other livestock. In the Region, extreme event in monsoon season as high tide and erosion damaged on over-clearing of vegetation and risk in agricultural lands and fish ponds (Wongthong P, 2015). Typically, natural disasters directly impacted the farmland areas of agricultural crop production and livestock rearing.
Livelihood diversification
․ Livelihood activities and shared income
The income source of sample households demonstrated in Figure 3. According to the figure, 17 % of sampled respondents from TNT village, 8% of ABG and 23% of KPC depended on only one income source. About 43% each of sampled respondents from TNT and ABG villages and 27% of KPC village relied on two income sources, which were the highest in the former two villages. And, 17% of sampled respondents from TNT and nearly 40% each of sampled respondents from ABG, and KPC villages had three income sources. Above 20% of TNT’s sampled respondents and 11% of ABG village and 17% of KPC village had four income sources.
Regarding the primary source of income, 71% of farm households from TNT village and above 60% from ABG and KPC villages earned from farming activities and very few percent in aquaculture and self-employment occupation, as shown in Table 5. As in the sampled households, the primary occupation was agriculture and causal labor. For Migration labor, there are two types of migration--internal (local) and international migration. Landlessness and migration have both negative and positive effects to increase income options for their families (Myint T, 2015). According to the suggestion of author Thet KK (2014), demographic factor and social factor influence international and internal migration in TNP Township.
There were very few per cent of internal migration labor from TNT and ABG villages and 10% from KPC were found and 65% of international migration labor from TNT, 41% from ABG and 20% from KPC, respectively. As showed in the monsoon and summer rice production status, it was found that 64.28% of monsoon rice grew in TNT village, and 45.94% in ABG village and 66.66% in KPC were found. And 19.04% from TNT’ farmers grew only monsoon rice in this village. Moreover, 11.90% of green gram grew in TNT, 29.72 % in ABG and 26.66% in KPC village. While emphasizing the income status, as shown in Figure 4, it was stated that 76% of annual income earned from crop production and 15% of extra work activities in TNT and very few per cent belong to the other portion. Moreover, 60% of annual shared income earned came from livestock and half of this shared income came from crop production in ABG village and very few per cent belonged to other portion. Wild fish pond earned high income in this region which received between US$16,846 and US$20,215 on average per 0.5 acre sizes (2,023.43 square meters) of the wild fish pond per year. Fishery activities in the selected areas, local fishing per day received at a range of 3 kg and 163 kg with an average price between US$2.9 and US$3.2 per viss (1 viss = 1.63 kilograms) within terms of poultry livestock rearing, it was mostly found that chicken, ducks and pigs were a common type of livestock rearing owned by respondents for additional income and also as a supplementary source. Chickens and ducks earned US$2.23 per kilogram.
In KPC village, 92% got extra work activities income and very few portions earned from others. Normally, the villagers sell pig with prices ranging from US$699 to US$744. Besides, other off-farm activities mentioned were small businesses and other occupations like drivers, carpenters and daily workers in TNP Township. The small business included rice retailers and wholesalers, shopkeepers, hucksters, carpenters and drivers (car, motorcycle, boat). The boat drivers’ income is considered commercial income generation especially during the rainy season. Daily work consists of farmland work on agribusiness like rice harvesting or transplanting in the crop production season. Engaging in small business and becoming drivers are also major options in these villages. Such kinds of daily work earned with normal wages between US$5.2 and US$5.9 for male workers and US$2.8 for female workers per day. Carpenters and workers in the sewing industry received a different range of daily wages depending on the number of their working days. As a result, it will be noticed that agricultural crop production was the highest shared income in TNT village and extra work activities were the highest shared in KPC village. From the result of group discussion, rice yield and price had changed depending on the quality of varieties and weather. Normally, the average yield varies between 142 kg and 171 kg per acre depending on rice varieties.
Financial support
In these selected villages, the majority of sampled respondents received the credit loan for their work from four organizations such as Gulf of Mottama Village Development Committee (GoMp-VDC), Myanmar Agricultural Development Bank (MADB), ThamaWarYaMa village development group and Mya Sein Yaung group. In these selected villages, more than half of sampled respondents received the loan from GoMp-VDC with the interest rate of 1.5%, 40% from Mya Sein Yaung group with the interest rate of 1.5%. Besides, the other minority of sampled respondents received from MADB (22%) with the interest rate of 0.67% and ThamaWarYaMa (19%) with the interest rate of 0.50%. GoMp-VDC and MADB support US$111.61 per villager who is kind of owned land farmers or project members of Gulf of Mottama project. The other two organizations support US$148.81 per villager who wants to take a loan based on their willingness.
Income composition of different livelihood activities
The parametric method with Kruskal-Wallis test within R was to compare the mean rank in each livelihood activities, and the analyzed results were not significant with the annual mean income and livelihood activities group from these selected villages. However, in this section, the annual mean income of sampled respondents compared with Gross Domestic Product per capita in Myanmar recorded at US$1,484 in 2017 by World Bank portal (GDP per capita, 2017). According to the exchange rate (2017), GDP per capita in Myanmar (2017) showed US$1,484 in 2017. The findings showed how much was earned and the annual mean income by sampled respondents based on different diversification of their livelihood activities.
Tha Nat Tan village (TNT): In TNT village, Figure 5 describes the annual mean income earned livelihood activities in TNT which differed from US$1,484 (GDP per capita per person in Myanmar. These livelihood options consist of agriculture, fishery, livestock, daily work and small business in TNT village. As the results showed in Figure 5, A+F+L (3T) earned US$32,085 as the highest annual mean income amount among 14 livelihood activities. The second highest income earned from A+L+D (3T) with US$13,594 and the third one found US$8,181 from A+F (2T). Meanwhile, livestock rearing, small local fisheries and daily work earned low level of annual mean income compared with GDP per capita as shown in this Figure.
Aung Bone Gyi village (ABG): The annual mean income earned livelihood activities in ABG village which differed from GDP per capita per person with US$1,484 in Myanmar. The result found in Figure 6 showed that 17 livelihood activities consist of agriculture, fishery, livestock, daily work and small businesses in the ABG village. As the finding showed in Figure 6, A+F+L+SB (4T) earned US$22,426 as the highest annual mean income amount. The second highest income earned from A+F+D (3T) with US$3,608 and the third one found US$3,378 from A+L+D (3T). Among these livelihood activities, 8 livelihood activities with small businesses, small local fishery and daily work earned very low annual mean income compare with GDP per capita as shown in this Figure. Thus, the most effective way to avoid poverty in small farm households is to be assisted by non-farm activities plus small-farm crop production by the management of “monetization” by IFAD (2012).
Kywe Hphyu Chuang village (KPC): In this village, the annual mean income earned livelihood activities in KPC village which differed from the US$1,484 (GDP per capita per person in Myanmar (Figure 7). The result found that 14 livelihoods activities consist of agriculture, fishery, livestock, daily work and small business. As shown in this Figure, A (1T) earned US$5,504 as the highest annual mean income amount. The second highest income earned from A+F+L (3T) with US$5,199 and the third one found US$5,051 from A+F+L+SB (3T). Among these livelihood activities, only four livelihood activities with small local fishery and daily work earned low level of annual mean income compare with GDP per capita as shown in this village. Additionally, non-agricultural employment increases as rural poverty declines and off-farm rural employment is crucial to reducing rural poverty to sufficient livelihood within the smallholders and landless labors by Sheyin (2016). It ran contrary to the finding of (Udoh and Nwibo 2017), farming only failed to stay out of poverty. Regina N et al. (2015) suggested livestock activities are important for wealth storage in the rural sector. Noticeably, diversification of livelihood activities depends on potential livelihood activities and preferences of the villagers of this coastal region. Sustainable livelihoods approach helps better understand livelihood opportunities and challenges within and between the coastal provinces (Glavovic BC and Boonzaier S, 2007). Thus, the same findings of the research (Udoh and Nwibo 2017), showed that farmers combined host of one activity of on-farm livelihood and other non-farm livelihood activities to make more income.

According to Figure 8, the result in this section separated two groups as a better-off group and less-poor group of income level. The annual mean income from TNT village received higher income rate than KPC and ABG village based on wealth group. When the annual income compared between these villages, the TNT villagers found the highest amount of annual income with different livelihood group activities. Based on the study, it is possible to conclude that more diversified livelihood activities group earned higher income source than the less diversified groups as the same finding with the author Regina N et al. (2015).
Constraints in the selected surveyed villages (N=109)
The constraints faced by the sampled respondents are shown in Table 7. Sampled respondents have to get a loan from the organization for their security and investments. However, the sampled respondents faced the constraints of getting loan insufficiency (22.2%). About 11.1% of the sampled respondents faced with water and sanitation problems in these villages. Getting loans with an inappropriate interest rate, limited investments for expending on their businesses leading to poor quality of production were other constraints faced by the sampled respondents. As the risk faced by the sampled respondents, the main risk for the villagers was weather risk leading to destroyed farmlands and work opportunities as crop production, fishery, self-employment and daily work.
CONCLUSIONS AND RECOMMENDATIONS
This study examines the livelihood diversification and different annual income earned per household. When comparing the income level of the farming households, it was found that more than half of the sampled respondents in the selected areas belonged to the better-off income level group. The highest annual mean income described three types of livelihood group as A+F+L (3T) in TNT village, four types of livelihood group as A+F+L+SB (4T) in ABG village and only agricultural crop production as A (1T) in KPC village, respectively. In this region, there was no group that belonged to the high education school. In fact, the majority of respondents (74%) completed primary school level, with 14% belonging to the middle school level. Most of sampled households have an average of 5 family members per household. In the study, among the 109 sampled respondents, 46% were male and 53 % were female. Agriculture is the major occupation in the selected areas, of which 71% can be found in TNT village, 59% in ABG village and 63% in KPC village, respectively. As far as disasters are concerned, 80% of the disasters came from floods which had a severe impact by destroying farms, infrastructures, houses and livestock. The rest were land erosion and tidal bore. About 73% of family members earned supporting income to their families from migration. For the livelihood situation in TNP Township, these surveyed villages made their livings on agriculture activities and off-farm activities such as fishery (local and commercial fisherman), daily work, small business, driver and small business. The major crop production is monsoon rice, summer rice and green gram crop production. Above 60% of sampled respondents grew monsoon and summer rice in TNT and KPC village and nearly 50% in ABG village. According to the results, 43% of TNT and ABG villages employed two income sources and 37% of KPC village from three income sources among the other sources of income. The highest shared income (76%) was earned from crop production in TNT village, from livestock (60%) in ABG village and extra work activities (off-farm) (92%) in KPC village.
The results of the two-level income group reveal that the majority of respondents (78%) came from the TNT village, and above 50% came from ABG and KPC villages which showed that they were in the better-off group category. The different findings showed that of the GDP per capita in Myanmar, only agriculture crop production can survive in the KPC village. Another author recognized that high yield production becomes an effective way to sufficiently work on agricultural crop production. Consequently, the study concluded that agriculture plus off-farm livelihood activities group earned the highest annual income than only off-farm and non-farm employment. The research findings recommend conducting further research with the in-depth study of sustainability of their livelihood with the dynamic assessment of livelihood portfolios and living expenses to know the poverty level in these research sites and also the different sites where there are disaster-prone areas near the Gulf of Mottama. Government department, NGOs and INGOs might support dramatically in terms of hygiene and provision of safe drinking water in risk areas. For livelihood options, the rural development organizations and department might take the action plan to recover for livelihood options mainly on agriculture, fishery and livestock rearing plan and also revolving funds to create income generation.
REFERENCES
ACAPS, 2018. ACAPS Briefing Note: Myanmar - Floods in Yedashe, Taungoo, Oktwin and Kyaut Gyi Townships, Bago Region (10 September 2018), https://reliefweb.int/report/myanmar/acaps-briefing-note-myanmar-floods-yedashe-taungoo-oktwin-and-kyaut-gyi-townships
DFID,2000. Sustainable Livelihoods Guidance Sheets. Department for International Development accessed on 21,7,2018, http://www.livelihoods.org/info/
GDP per capita, 2017. Trading economics.com website: summary of Myanmar GDP per capita, 2017, https://tradingeconomics.com/myanmar/gdp-per-capita
Glavovic BC, Boonzaier S, 2007. Confronting coastal poverty. Building sustainable coastal livelihoods in South Africa. Ocean & Coastal Management, 50 (1-2), 1–23.
GoMp,2018. Overview of Phase 2 of the Gulf of Mottama Project (GoMp), project plan document for 2018 to 2021, Helvetas project,Myanmar,unpublished.
Haggblade, S., Hazell, B. and Reardon, T. (2007). Transforming the Rural Non-farm Economy,Opportunities and Threats in the Developing World. Baltimore, John Hopkins University Press.
Myanmar Population and Housing Census data,2018. Myanmar Population and Housing Census data: Mynmar Information Management Unit, Township profile,2018, Myanmar Population and Housing Census data, General Administrative Department and Department of Population ,http://themimu.info/mimu-township-profiles-dashboard.
MOALI, 2016. MOALI 2016: Myanmar agriculture at a Glance, 2016, Ministry of Agrilcutre, Livestock and Irrigation Department of Planning.
Myanmar Statistical Year Book, 2018. Myanmar Statistical Year Book : Central Statistical Organisation,2018. https://www.csostat.gov.mm, http://www.mmsis.gov.mm.
Myint T, 2015. Non-fish value chain study. Community-Led Coastal Management in the
Twigg J, 2015. Disaster risk reduction. Overseas Development Institute: London, UK, 382, accessed on 19.11.2018.
Udoh, N. and S. Nwibo (2017). "Socio-Economic Determinants of Rural Non-Farm Households Income Diversification in Southeast Nigeria." International Research Journal of Finance and Economics 164.
World Bank Group, 2015. Myanmar Post-Disaster Needs Assessments of Floods and Landslides. July-September 2015, Government of the Union of Myanmar, 302p, accessed on 24.12.2017.