ABSTRACT
This study emphasized the estimation of the food security status and coping strategies employed to cope with food insecurity and better understanding of major determinants of per capita food expenditure at household level in Myingyan Township. To examine rural household’s access to food, the households were divided into farm and non- farm (landless) households. According to households’ daily caloric availability based on minimum per capita daily food requirement of 2100 kcal/person/day, food poverty line method and coping strategies method were used to determine household food security situation. The study revealed that 48.05% of landless household and 45.84% of farm households were food insecure. Landless households were more vulnerable than farm households because they spent more than their income mainly for food consumption. About half of the landless and farm households were found in low level of coping strategies for food insecurity. Only 8.49% of landless and 6.01% farm households fall in the category of food poverty.
Total household income, households’ rice consumption, households’ meat consumption, non-food expenditure were positively and significantly influenced by per capita food expenditure and household size and migration were negatively and significantly influenced by per capita food expenditure. Due to migration, households’ size become smaller and households were found to consume more in food expenditure. The study recommended that proactive policy in health and nutrition extension services, enhancement of technology adoption, promotion of income diversification program, incorporation of coping strategy in the regular projects and program and agricultural development program should be integrated in the effort to improve the food security situation in Myingyan Township, in the dry zone.
Key words: food security, coping strategies, food poverty.
INTRODUCTION
Myanmar is a resource rich country, with sufficient food availability at the national level, but a very uneven distribution of resources, poor investments in key sectors cause food insecurity situation in some areas especially those located in the central dry zone, Shan and Chin states. Official statistics suggest that one quarter of Myanmar’s households live below the national poverty line, and that one in ten households lives below the food poverty line. While agricultural development is important for the whole nation, it is especially important for rural areas where some 70% of the country’s population reside and depend primarily on agricultural production as their main source of income. Moreover, employment opportunities for landless labor and other rural people depend heavily on agricultural activities (Wilson et al., 2013).
Rice is the major source of energy for the Myanmar people as it contributes about 73% and 80% of the total daily dietary energy requirement in urban and rural households, respectively. Two-thirds of household expenditure is spent on food and rice carries the largest weight in the Consumer Price Index with 17% on average and with 27% for low income groups (CSO, 2012). The factors affecting household food security are generally economic ones such as household income, price of food, market access and performance, investments, job opportunities, etc. Therefore, food security assessment not only at the household level but also at the individual level can enhance the understanding regarding the real livelihood situation in the dry zone.
Background of the study
Dry zone (Mandalay Region) is one of the poverty- stricken areas and food insecurity areas in Myanmar. Myingyan district is situated in the Mandalay region of central Myanmar and the total area of Myingyan is about 969.398 km2 with sea level between 60- 400 meters. The climate is dry and the annual rainfall averages about 35 inches. The temperature varies between 43 and 11.4 ̊C (DoA, 2014).The rural people in this area are in the high level of landlessness and low acreage of accessible land for those who do cultivate. Although most irrigation schemes have been focused in the dry zone and in food deficit areas, there were not enough irrigation facilities in this area.
The rural people in the study area rely on market purchase for food access in a context of low, undiversified, agriculture-based incomes, high debts and reliance on credit. The ordinary crops are millet, sesame, cotton, maize, rice and a great variety of peas and beans. The major livelihood is agriculture, trading the local foods and products. The main cultivated crops in Myingyan are pulses, oil seed crops and onions which are mainly imported to the lower part of Myanmar. Lack of data on the relative contribution of households’ production compared with market purchases to household consumption hinders accurate assessment of household vulnerability to food insecurity. Therefore, food security assessment not only at the household level but also at the individual level can enhance the understanding of the real livelihood situation in the dry zone. This study would partially provide the current food security situation of the sample rural households, factors influencing per capita food expenditure and their coping strategies regarding food insecurity in the Dry Zone area.
There were three main objectives in this study:
- To examine the farm and landless households’ food security status;
- To find out the farm and landless households’ coping strategies employed to cope with food insecurity; and
- To identify the determinant factors influencing on per capita food expenditure of the sample households
Research methodology
Both primary and secondary sources of data were used in this study. The survey collected information from 77 non-farm (landless) households and 120 farm households by using simple random sampling method.
Method of analysis
The study was based on both quantitative and qualitative data. Some qualitative data were given numerical codes to continue data processing. These coding and responses were recorded into Microsoft excel program 2007. Sets of primary data from the household survey were processed by using the Statistical Packages for Social Science (SPSS version 16) software. In order to compare the demographic and socio- economic characteristics and food security status of different rural households, Pearson Chi- square test, t- test, and F- test were used. Regression analysis was used to determine the influencing factors of per capita food expenditure. According to WFP (1998), food poverty line was constructed according to the minimum daily requirement of food (2,100 kcal), intake per person per day. Data was based on the amount of purchasing for the minimum consumption bundle in the study area.
Analysis of food security status
Household calorie availability was computed from each food item consumed and commonly consumption of food items in the study area. The net daily calorie availability was divided by household members to obtain the daily calorie availability per adult equivalent of the households. Households with daily calorie consumption greater than or equal to 2,100 kcal per day recommended by the World Health Organization (WFP, 1998) were categorized as ‘food secure’, and those households whose calorie intake which fell below this food security threshold were grouped as ‘food insecure'.
In order to compute food poverty incidence, Foster- Greer Thorbecke(1984) was used. The consumption data available from the sampled households were analyzed to compute food poverty incidence including headcount ratio, food poverty gap and food severity.
Headcount index
The headcount index simply measures the proportion of the population that is counted as poor, often denoted by P0. Formally,
P0 = Np/N
Where Np is the number of poor and Nis the total population (or sample).
Poverty gap index
This index is adds up the extent to which individuals on average fall below the poverty line, and expresses it as a percentage of the poverty line. Specifically, it defines the poverty gap (Gi) as the poverty line (z) less actual income  for poor individuals; the gap is considered to be zero for everyone else. Then the poverty gap index may be written as,
.jpg)
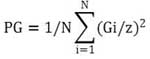
Squared poverty gap (poverty severity) index
Squared the poverty gap index measures implicitly puts more weight on observations that fall well below the poverty line. Formally;
Reduced coping strategies index (CSI)
The respondents are asked to inform frequency of use of each strategy, over a week (30 days recall). The number of different strategies used by the households is summed. A weight is also allocated to each strategy. CSI are then obtained by multiplying the score to the frequency for each strategy and then adding all the strategies scores. The more food insecure household would get the high score (Maxwell et al., 2008).
RESULTS AND DISCUSSION
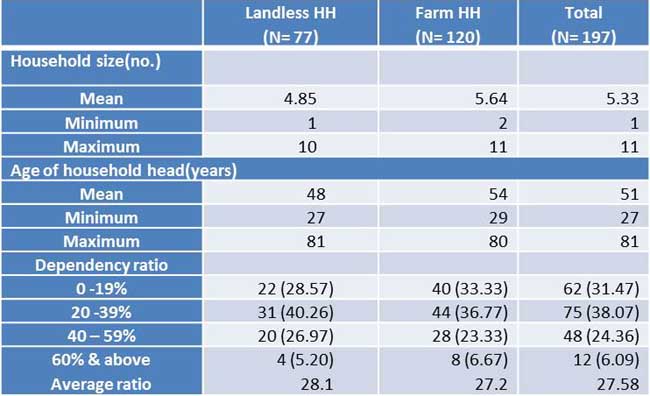
Household size, age of the household’s head and dependency ratio
The average household sizes of the landless and farm households were 4.85 and 5.64 respectively with the minimum 1 person and maximum of 11 persons and most of living with their extended families. The average age of the total household heads was 51 years with the minimum of 27 years and maximum 81 years. The average age of farm households (51 years) were older than landless households (48 years) among the sampled households. According to IHLCA 2011, the higher the dependency ratio value, the higher the dependency burden on the household. But there was no dependency burden that was found in the study area because most of both landless and farm households had the dependency ratio between 20 to 39 % (Table 1).
Table 1. Household size and age of the households’ head and dependency ratio
Income diversification of the sample rural households
The income diversifications of the sample households are illustrated in (Fig. 1). Landless households depend their income of 79% from non- farm work. The others come from farm labor 9%, livestock production 7%, and home- based work 4% and remittance 1%, respectively. In the farm households, the major income earned from crop production 55% (groundnut, sesame, rice, cotton, pigeon pea, green gram, etc.). About 14% and 9% of incomes were earned from remittance and livestock in the study area. It was found that not only farm households but also landless households rely on two or three sources of income.
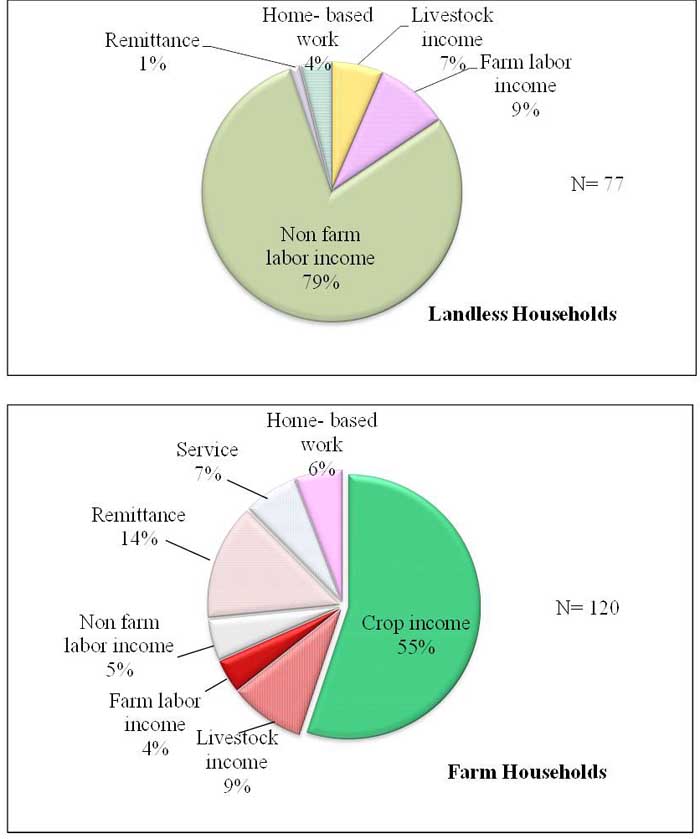
Fig. 1. Income diversifications of landless and farm households
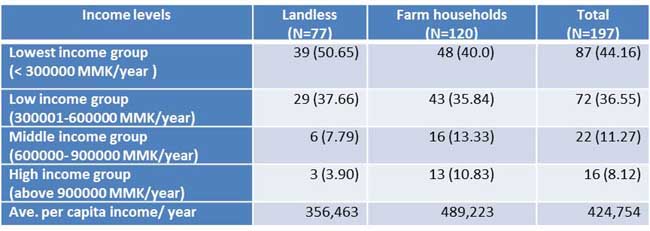
Different per capita income levels of the sample households
The average annual per capita income of landless households was 356,463 MMK (US$360) and farm households were 489,223 MMK (US$494) in the study area. According to Table 2, about 50.65% of landless households and 40% of farm households fall under the lowest income group while about 3.9% of landless and 10.83% of farm households fall under the high income groups, respectively.
Table 2. Per capita income and different income levels of sample rural households
Composition of food items to total food consumption of the households
Rice is the major food item and rice consumption was the highest in food composition of the sample households. Although other food cost contribution were not different between landless and farm households, the landless households’ rice cost contribution (39%) was higher than that of farm households (32%) in their daily food cost. But landless households had lower meat cost contribution (17%) compared to that of farm households (24%) in their daily food cost (Fig. 2).
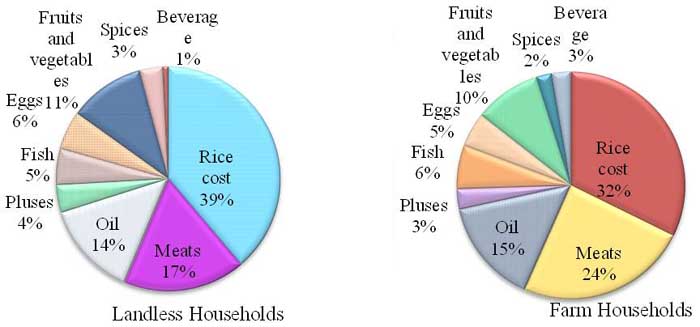
Fig. 2. Composition of food items to total food cost of sample rural households
Daily capita calorie intake and capita food expenditure of the households
The landless and farm groups do not differ from each other in terms of acquiring low quantity of foods because their daily per capita calorie intake were not significantly different between landless and farm households. The average calories were 2,127 kcal in landless households and 2,181kcal in farm households, respectively. To fill up the minimum per capita daily requirement of calorie, the required value per capita was estimated at 586 MMK for the study area. This minimum per capita daily requirement of food was calculated by using the local available food and commonly eaten by local family based on the local market price. In the calculation of calorie intake, the highest calories were obtained from eating rice. Normally, the rural farmer was able to eat three plates of rice per day which was equivalent to 1,434 kcal and cost 150 MMK. The average daily per capita food cost of landless households was 508 MMK and farm households was 596MMK respectively. It revealed that landless households’ average food cost was lower than that of farm households in the study area (Fig. 3).
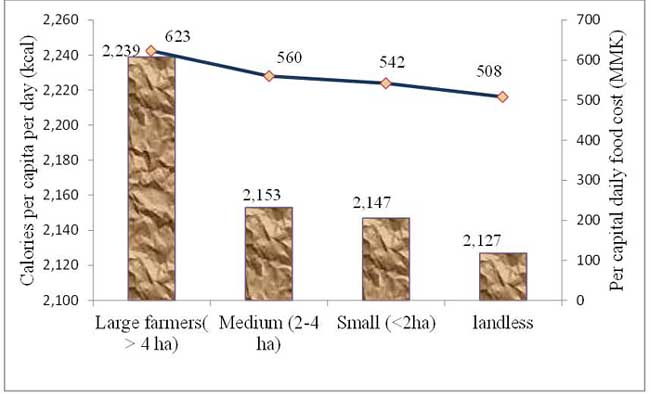
Fig. 3. Daily capita food expenditure and calorie intake
Food security status of the sample rural households
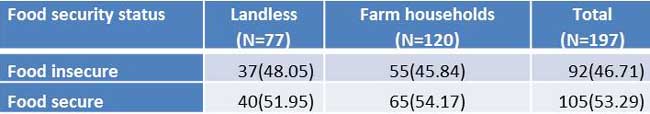
The average minimum energy requirement of 2,100 kcal was used to consider the food security status of the study area. In farm households, 45.84% of food insecure households and 54.17% of food secure households were founded in the study area (Table 3). Because periods of drought causes reduce production potential, productive assets, especially numbers of livestock which tend to minimize households’ income. Furthermore, landless and farm households have poor access to inputs and credit, job opportunity such as seasonal unemployment leads to food insufficiency in these areas. Fig. 4 illustrates the food poverty threshold line for the sample households. There were 48.05% of food insecure households and 51.95% of food secure households in the landless households. Among the landless households, 48.05% belonged to the category of food insecure households while 51.95% were considered food secure.
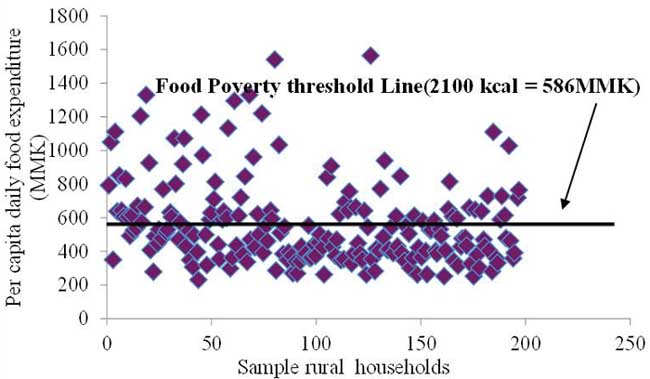
Fig. 4. Food poverty threshold line (2100 kcal = 586 MMK) of the sample rural households
Table 3. Food security status of the sample rural households
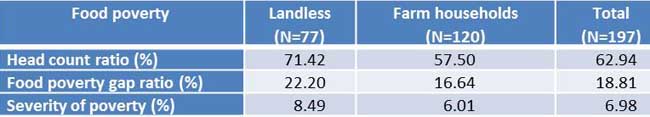
Food poverty incidence of the households
The measures of poverty depth and poverty severity provide complementary information on the incidence of poverty (Reyes, 2005).The minimum income requirement for food and food expenditure was 586 MMK per capita per day. Based on this food expenditure requirement, the level of food poverty for sample households could be calculated (Table 4). The head count ratio in landless households was estimated at 71.42% and that of farm households was 57.5%, respectively. It means that 71.42% of landless households and 57.5% of the farm households fall under the food poverty category. The food poverty gap ratio for landless and farm households have 22.2% and 16.64% respectively. Then, square food poverty gap ratio or severity of the food poverty for landless and farm households were 8.49% and 6.01% respectively (Table 4). It was obvious that the households in landless were in hunger than others and the majority of the poorest of the poor were found in landless and small farm households in the study area.
Table 4. Food poverty incidence of sample rural households
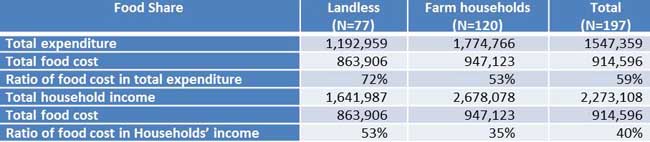
Percentage of food share in total expenditure and income among sample rural households
The food share in the household total expenditure and income should be estimated to examine the well- being of different rural households (Dolly Kyaw, 2009). In this study, landless households use about 53%of their total income in food consumption and farm households use 35% of household’s income for food consumption (Table 5). Therefore, it was obvious that the majority of landless households use more than half of their income for food consumption and then they were more vulnerable than farm households in the study area.
Table 5. Percentage of food share of sample rural households
Coping strategies to food insecurity of the sample rural households
The index of coping strategy has three advantages: it is easy to implement; it directly captures notions of adequacy and vulnerability; and the questions asked are easy to understand by both respondents and analysts (Hoddinott, 2001). There were only 1.29% of the landless households and 1.67% farm households were found in high levels of coping strategies for food insecurity. About 42.85% of the landless households and 41.66% of the farm households were found in low level of coping strategies for food insecurity. Fortunately, about 51.94% of landless households and 54.17% of farm households have no need to use coping strategies for food insecurity (Table 6). Reducing the number of meals was the highest coping strategies and then substituting them with cheaper foods was the second highest coping strategies employed by the rural households in the study area (Fig. 5).
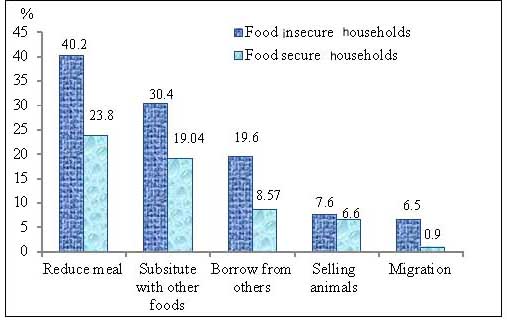
Fig. 5. Coping strategies of food insecurity of sample rural households
Table 6. Classification of coping strategies of food insecurity of the sample rural households
Factors influencing per capita food expenditure of the sample rural households
In the study area, food secure households group were characterized by smaller family size, higher annual income, higher rice and meat consumption and rare migration to other places and non- food expenditure when compared to the food insecure groups. An increase in household income would only not be sufficient to maintain good health and nutritional food-security. Therefore, household access to enough food is highly dependent on household characteristics, household resource allocation among several farm enterprises and environmental factors (Table 7).
Table 7. Factors influencing per capita food expenditure of the sample rural households
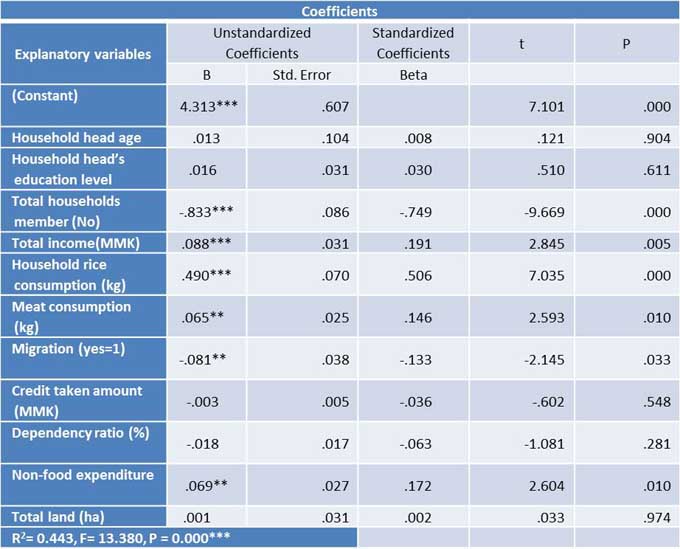
a. Dependent Variable: Per capita food expenditure per day, *** and ** are significant difference at 1% and 5% probability levels, respectively.
CONCLUSION AND POLICY IMPLICATION
It was obvious that the majority of the rural households except for large farm households were vulnerable in the study area as more than half of their income was mainly used for food consumption. The average annual per capita income of landless household was 356,463 MMK (US$360) and farm household was 489,223 MMK (US$494) in the study area of the surveying period of October 2015. According to food share percentage, landless households were more vulnerable than that of farm households because they use more than half of their total income in food consumption. The average capita daily calories of the landless have 2,127 kcal and farm households have 2,181 kcal, respectively. According to the average daily per capita food expenditure, the landless consume 508 MMK and farm households consume 596 MMK, respectively in the study area. The minimum per capita income requirement for food expenditure was estimated at 586 MMK to reach 2,100 kcal per capita per day, if the families are not satisfied with minimum average calorie needed, rural people cannot break the vicious cycle of poverty. The head count ratio of the landless (71.42%) and farm households (57.5%), respectively meant that 71.42% of landless and 57.5% of the farm households fell in food poverty. Increasing the amount of households’ income level is crucial to escape from the poverty trap but it should not neglect household characteristics, household resource allocation among several farm enterprises and environmental factors because these are also highly dependent on household access to enough food.
The most important coping strategies which were practiced by sample household’s food insecurity were reducing the number of meals, substitute with cheaper foods, to borrow cash and foods from relatives or others, sales of animals and migration, respectively. Thus, an increase in household income might reduce food poverty incidence and increase in consumption expenditure. Harnessing the potential role of coping strategies which is currently being practiced by the households to mitigate food insecurity shall be considered and incorporated as policy options. The proactive policy in health extension services, enhancing technology adoption, promoting income diversification program, incorporating coping strategy in the regular projects and agricultural development program should be integrated to ensure food security situation in the Dry zone area.
REFERENCES
CSO (Central Statistical Organization).2010.Statistical yearbook, (Average monthly household expenditure by group of consumed items, Union, 2006) Nay Pyi Taw, pp. 462.
CSO ( Central Statistical Organization). 2012. Statistical Yearbook 2010. Ministry of National Planning and Economic Development. Nay Pyi Taw, Myanmar
DoA (Department of Agriculture).2014.Data Records from Township Office, Department of Agriculture (DOA), Myingyan Township, Mandalay Division, Myanmar.
Dolly Kyaw 2009.Rural Households’ food Security Status and Coping Strategies to Food Insecurity in Myanmar. No. 444, pp.59-60.
WHO (World Health Organization). 1985.Joint Expert Consultation Energy and Protein Requirements. Technical Report Series 724.WHO. 1985. Geneva.
Foster, J., Greer. J., and E. Thorbecke. 1984.A Class of Decomposable Poverty Measures, Econometric, Vol 52, 1984.
Hoddinott, J. 2001. Choosing Outcome Indicators of Household Food Security. Food Security in Practice: Methods for Rural Development project, IFFPRI, Washington D.c., pp. 31-45.
Maxwell, D. and R. Caldwelll. 2008. The Coping Strategies Index: Field Methods Manual Second Edition, pp.14- 18.
Reyes, C.M. 2005. Introduction to Poverty Analysis, Poverty Manual, All, JH Revision of August 8, 2005, pp. 69-73.
WFP (World Food Program).1998.Memorandum of Understanding in Emergency and Rehabilitation Interventions. February 1998.
Wilson, S. and Naw Eh Mwee Aye Wai. 2013. Background Paper No.4 Food and Nutrition Security in Myanmar. Michigan State University. pp. 68- 87.
|
Date submitted: March 21, 2017
Reviewed, edited and uploaded: April 13, 2017
|

Study on Food Security Status and Coping Strategies of Rural Households in Myingyan Township, Dry Zone Area, Myanmar
ABSTRACT
This study emphasized the estimation of the food security status and coping strategies employed to cope with food insecurity and better understanding of major determinants of per capita food expenditure at household level in Myingyan Township. To examine rural household’s access to food, the households were divided into farm and non- farm (landless) households. According to households’ daily caloric availability based on minimum per capita daily food requirement of 2100 kcal/person/day, food poverty line method and coping strategies method were used to determine household food security situation. The study revealed that 48.05% of landless household and 45.84% of farm households were food insecure. Landless households were more vulnerable than farm households because they spent more than their income mainly for food consumption. About half of the landless and farm households were found in low level of coping strategies for food insecurity. Only 8.49% of landless and 6.01% farm households fall in the category of food poverty.
Total household income, households’ rice consumption, households’ meat consumption, non-food expenditure were positively and significantly influenced by per capita food expenditure and household size and migration were negatively and significantly influenced by per capita food expenditure. Due to migration, households’ size become smaller and households were found to consume more in food expenditure. The study recommended that proactive policy in health and nutrition extension services, enhancement of technology adoption, promotion of income diversification program, incorporation of coping strategy in the regular projects and program and agricultural development program should be integrated in the effort to improve the food security situation in Myingyan Township, in the dry zone.
Key words: food security, coping strategies, food poverty.
INTRODUCTION
Myanmar is a resource rich country, with sufficient food availability at the national level, but a very uneven distribution of resources, poor investments in key sectors cause food insecurity situation in some areas especially those located in the central dry zone, Shan and Chin states. Official statistics suggest that one quarter of Myanmar’s households live below the national poverty line, and that one in ten households lives below the food poverty line. While agricultural development is important for the whole nation, it is especially important for rural areas where some 70% of the country’s population reside and depend primarily on agricultural production as their main source of income. Moreover, employment opportunities for landless labor and other rural people depend heavily on agricultural activities (Wilson et al., 2013).
Rice is the major source of energy for the Myanmar people as it contributes about 73% and 80% of the total daily dietary energy requirement in urban and rural households, respectively. Two-thirds of household expenditure is spent on food and rice carries the largest weight in the Consumer Price Index with 17% on average and with 27% for low income groups (CSO, 2012). The factors affecting household food security are generally economic ones such as household income, price of food, market access and performance, investments, job opportunities, etc. Therefore, food security assessment not only at the household level but also at the individual level can enhance the understanding regarding the real livelihood situation in the dry zone.
Background of the study
Dry zone (Mandalay Region) is one of the poverty- stricken areas and food insecurity areas in Myanmar. Myingyan district is situated in the Mandalay region of central Myanmar and the total area of Myingyan is about 969.398 km2 with sea level between 60- 400 meters. The climate is dry and the annual rainfall averages about 35 inches. The temperature varies between 43 and 11.4 ̊C (DoA, 2014).The rural people in this area are in the high level of landlessness and low acreage of accessible land for those who do cultivate. Although most irrigation schemes have been focused in the dry zone and in food deficit areas, there were not enough irrigation facilities in this area.
The rural people in the study area rely on market purchase for food access in a context of low, undiversified, agriculture-based incomes, high debts and reliance on credit. The ordinary crops are millet, sesame, cotton, maize, rice and a great variety of peas and beans. The major livelihood is agriculture, trading the local foods and products. The main cultivated crops in Myingyan are pulses, oil seed crops and onions which are mainly imported to the lower part of Myanmar. Lack of data on the relative contribution of households’ production compared with market purchases to household consumption hinders accurate assessment of household vulnerability to food insecurity. Therefore, food security assessment not only at the household level but also at the individual level can enhance the understanding of the real livelihood situation in the dry zone. This study would partially provide the current food security situation of the sample rural households, factors influencing per capita food expenditure and their coping strategies regarding food insecurity in the Dry Zone area.
There were three main objectives in this study:
Research methodology
Both primary and secondary sources of data were used in this study. The survey collected information from 77 non-farm (landless) households and 120 farm households by using simple random sampling method.
Method of analysis
The study was based on both quantitative and qualitative data. Some qualitative data were given numerical codes to continue data processing. These coding and responses were recorded into Microsoft excel program 2007. Sets of primary data from the household survey were processed by using the Statistical Packages for Social Science (SPSS version 16) software. In order to compare the demographic and socio- economic characteristics and food security status of different rural households, Pearson Chi- square test, t- test, and F- test were used. Regression analysis was used to determine the influencing factors of per capita food expenditure. According to WFP (1998), food poverty line was constructed according to the minimum daily requirement of food (2,100 kcal), intake per person per day. Data was based on the amount of purchasing for the minimum consumption bundle in the study area.
Analysis of food security status
Household calorie availability was computed from each food item consumed and commonly consumption of food items in the study area. The net daily calorie availability was divided by household members to obtain the daily calorie availability per adult equivalent of the households. Households with daily calorie consumption greater than or equal to 2,100 kcal per day recommended by the World Health Organization (WFP, 1998) were categorized as ‘food secure’, and those households whose calorie intake which fell below this food security threshold were grouped as ‘food insecure'.
In order to compute food poverty incidence, Foster- Greer Thorbecke(1984) was used. The consumption data available from the sampled households were analyzed to compute food poverty incidence including headcount ratio, food poverty gap and food severity.
Headcount index
The headcount index simply measures the proportion of the population that is counted as poor, often denoted by P0. Formally,
P0 = Np/N
Where Np is the number of poor and Nis the total population (or sample).
Poverty gap index
This index is adds up the extent to which individuals on average fall below the poverty line, and expresses it as a percentage of the poverty line. Specifically, it defines the poverty gap (Gi) as the poverty line (z) less actual income for poor individuals; the gap is considered to be zero for everyone else. Then the poverty gap index may be written as,
Squared poverty gap (poverty severity) index
Squared the poverty gap index measures implicitly puts more weight on observations that fall well below the poverty line. Formally;
Reduced coping strategies index (CSI)
The respondents are asked to inform frequency of use of each strategy, over a week (30 days recall). The number of different strategies used by the households is summed. A weight is also allocated to each strategy. CSI are then obtained by multiplying the score to the frequency for each strategy and then adding all the strategies scores. The more food insecure household would get the high score (Maxwell et al., 2008).
RESULTS AND DISCUSSION
Household size, age of the household’s head and dependency ratio
The average household sizes of the landless and farm households were 4.85 and 5.64 respectively with the minimum 1 person and maximum of 11 persons and most of living with their extended families. The average age of the total household heads was 51 years with the minimum of 27 years and maximum 81 years. The average age of farm households (51 years) were older than landless households (48 years) among the sampled households. According to IHLCA 2011, the higher the dependency ratio value, the higher the dependency burden on the household. But there was no dependency burden that was found in the study area because most of both landless and farm households had the dependency ratio between 20 to 39 % (Table 1).
Table 1. Household size and age of the households’ head and dependency ratio
Income diversification of the sample rural households
The income diversifications of the sample households are illustrated in (Fig. 1). Landless households depend their income of 79% from non- farm work. The others come from farm labor 9%, livestock production 7%, and home- based work 4% and remittance 1%, respectively. In the farm households, the major income earned from crop production 55% (groundnut, sesame, rice, cotton, pigeon pea, green gram, etc.). About 14% and 9% of incomes were earned from remittance and livestock in the study area. It was found that not only farm households but also landless households rely on two or three sources of income.
Fig. 1. Income diversifications of landless and farm households
Different per capita income levels of the sample households
The average annual per capita income of landless households was 356,463 MMK (US$360) and farm households were 489,223 MMK (US$494) in the study area. According to Table 2, about 50.65% of landless households and 40% of farm households fall under the lowest income group while about 3.9% of landless and 10.83% of farm households fall under the high income groups, respectively.
Table 2. Per capita income and different income levels of sample rural households
Composition of food items to total food consumption of the households
Rice is the major food item and rice consumption was the highest in food composition of the sample households. Although other food cost contribution were not different between landless and farm households, the landless households’ rice cost contribution (39%) was higher than that of farm households (32%) in their daily food cost. But landless households had lower meat cost contribution (17%) compared to that of farm households (24%) in their daily food cost (Fig. 2).
Fig. 2. Composition of food items to total food cost of sample rural households
Daily capita calorie intake and capita food expenditure of the households
The landless and farm groups do not differ from each other in terms of acquiring low quantity of foods because their daily per capita calorie intake were not significantly different between landless and farm households. The average calories were 2,127 kcal in landless households and 2,181kcal in farm households, respectively. To fill up the minimum per capita daily requirement of calorie, the required value per capita was estimated at 586 MMK for the study area. This minimum per capita daily requirement of food was calculated by using the local available food and commonly eaten by local family based on the local market price. In the calculation of calorie intake, the highest calories were obtained from eating rice. Normally, the rural farmer was able to eat three plates of rice per day which was equivalent to 1,434 kcal and cost 150 MMK. The average daily per capita food cost of landless households was 508 MMK and farm households was 596MMK respectively. It revealed that landless households’ average food cost was lower than that of farm households in the study area (Fig. 3).
Fig. 3. Daily capita food expenditure and calorie intake
Food security status of the sample rural households
The average minimum energy requirement of 2,100 kcal was used to consider the food security status of the study area. In farm households, 45.84% of food insecure households and 54.17% of food secure households were founded in the study area (Table 3). Because periods of drought causes reduce production potential, productive assets, especially numbers of livestock which tend to minimize households’ income. Furthermore, landless and farm households have poor access to inputs and credit, job opportunity such as seasonal unemployment leads to food insufficiency in these areas. Fig. 4 illustrates the food poverty threshold line for the sample households. There were 48.05% of food insecure households and 51.95% of food secure households in the landless households. Among the landless households, 48.05% belonged to the category of food insecure households while 51.95% were considered food secure.
Fig. 4. Food poverty threshold line (2100 kcal = 586 MMK) of the sample rural households
Table 3. Food security status of the sample rural households
Food poverty incidence of the households
The measures of poverty depth and poverty severity provide complementary information on the incidence of poverty (Reyes, 2005).The minimum income requirement for food and food expenditure was 586 MMK per capita per day. Based on this food expenditure requirement, the level of food poverty for sample households could be calculated (Table 4). The head count ratio in landless households was estimated at 71.42% and that of farm households was 57.5%, respectively. It means that 71.42% of landless households and 57.5% of the farm households fall under the food poverty category. The food poverty gap ratio for landless and farm households have 22.2% and 16.64% respectively. Then, square food poverty gap ratio or severity of the food poverty for landless and farm households were 8.49% and 6.01% respectively (Table 4). It was obvious that the households in landless were in hunger than others and the majority of the poorest of the poor were found in landless and small farm households in the study area.
Table 4. Food poverty incidence of sample rural households
Percentage of food share in total expenditure and income among sample rural households
The food share in the household total expenditure and income should be estimated to examine the well- being of different rural households (Dolly Kyaw, 2009). In this study, landless households use about 53%of their total income in food consumption and farm households use 35% of household’s income for food consumption (Table 5). Therefore, it was obvious that the majority of landless households use more than half of their income for food consumption and then they were more vulnerable than farm households in the study area.
Table 5. Percentage of food share of sample rural households
Coping strategies to food insecurity of the sample rural households
The index of coping strategy has three advantages: it is easy to implement; it directly captures notions of adequacy and vulnerability; and the questions asked are easy to understand by both respondents and analysts (Hoddinott, 2001). There were only 1.29% of the landless households and 1.67% farm households were found in high levels of coping strategies for food insecurity. About 42.85% of the landless households and 41.66% of the farm households were found in low level of coping strategies for food insecurity. Fortunately, about 51.94% of landless households and 54.17% of farm households have no need to use coping strategies for food insecurity (Table 6). Reducing the number of meals was the highest coping strategies and then substituting them with cheaper foods was the second highest coping strategies employed by the rural households in the study area (Fig. 5).
Fig. 5. Coping strategies of food insecurity of sample rural households
Table 6. Classification of coping strategies of food insecurity of the sample rural households
Factors influencing per capita food expenditure of the sample rural households
In the study area, food secure households group were characterized by smaller family size, higher annual income, higher rice and meat consumption and rare migration to other places and non- food expenditure when compared to the food insecure groups. An increase in household income would only not be sufficient to maintain good health and nutritional food-security. Therefore, household access to enough food is highly dependent on household characteristics, household resource allocation among several farm enterprises and environmental factors (Table 7).
Table 7. Factors influencing per capita food expenditure of the sample rural households
a. Dependent Variable: Per capita food expenditure per day, *** and ** are significant difference at 1% and 5% probability levels, respectively.
CONCLUSION AND POLICY IMPLICATION
It was obvious that the majority of the rural households except for large farm households were vulnerable in the study area as more than half of their income was mainly used for food consumption. The average annual per capita income of landless household was 356,463 MMK (US$360) and farm household was 489,223 MMK (US$494) in the study area of the surveying period of October 2015. According to food share percentage, landless households were more vulnerable than that of farm households because they use more than half of their total income in food consumption. The average capita daily calories of the landless have 2,127 kcal and farm households have 2,181 kcal, respectively. According to the average daily per capita food expenditure, the landless consume 508 MMK and farm households consume 596 MMK, respectively in the study area. The minimum per capita income requirement for food expenditure was estimated at 586 MMK to reach 2,100 kcal per capita per day, if the families are not satisfied with minimum average calorie needed, rural people cannot break the vicious cycle of poverty. The head count ratio of the landless (71.42%) and farm households (57.5%), respectively meant that 71.42% of landless and 57.5% of the farm households fell in food poverty. Increasing the amount of households’ income level is crucial to escape from the poverty trap but it should not neglect household characteristics, household resource allocation among several farm enterprises and environmental factors because these are also highly dependent on household access to enough food.
The most important coping strategies which were practiced by sample household’s food insecurity were reducing the number of meals, substitute with cheaper foods, to borrow cash and foods from relatives or others, sales of animals and migration, respectively. Thus, an increase in household income might reduce food poverty incidence and increase in consumption expenditure. Harnessing the potential role of coping strategies which is currently being practiced by the households to mitigate food insecurity shall be considered and incorporated as policy options. The proactive policy in health extension services, enhancing technology adoption, promoting income diversification program, incorporating coping strategy in the regular projects and agricultural development program should be integrated to ensure food security situation in the Dry zone area.
REFERENCES
CSO (Central Statistical Organization).2010.Statistical yearbook, (Average monthly household expenditure by group of consumed items, Union, 2006) Nay Pyi Taw, pp. 462.
CSO ( Central Statistical Organization). 2012. Statistical Yearbook 2010. Ministry of National Planning and Economic Development. Nay Pyi Taw, Myanmar
DoA (Department of Agriculture).2014.Data Records from Township Office, Department of Agriculture (DOA), Myingyan Township, Mandalay Division, Myanmar.
Dolly Kyaw 2009.Rural Households’ food Security Status and Coping Strategies to Food Insecurity in Myanmar. No. 444, pp.59-60.
WHO (World Health Organization). 1985.Joint Expert Consultation Energy and Protein Requirements. Technical Report Series 724.WHO. 1985. Geneva.
Foster, J., Greer. J., and E. Thorbecke. 1984.A Class of Decomposable Poverty Measures, Econometric, Vol 52, 1984.
Hoddinott, J. 2001. Choosing Outcome Indicators of Household Food Security. Food Security in Practice: Methods for Rural Development project, IFFPRI, Washington D.c., pp. 31-45.
Maxwell, D. and R. Caldwelll. 2008. The Coping Strategies Index: Field Methods Manual Second Edition, pp.14- 18.
Reyes, C.M. 2005. Introduction to Poverty Analysis, Poverty Manual, All, JH Revision of August 8, 2005, pp. 69-73.
WFP (World Food Program).1998.Memorandum of Understanding in Emergency and Rehabilitation Interventions. February 1998.
Wilson, S. and Naw Eh Mwee Aye Wai. 2013. Background Paper No.4 Food and Nutrition Security in Myanmar. Michigan State University. pp. 68- 87.
Date submitted: March 21, 2017
Reviewed, edited and uploaded: April 13, 2017