ABSTRACT
Korea’s agricultural income per farm household in 2022 was KRW9.49 million (US$7,342), the largest decline since statistics were compiled. The low level of agricultural income, which has not exceeded KRW10 million (US$7,740) over the past 30 years, threatens the sustainability of Korean agriculture and rural areas. If the situation of low agricultural income persists, more farmers will give up farming, which will lead to a decline in the local economy of rural areas, weakening the public interest functions of agriculture such as food supply and environmental and ecological conservation, and significantly increasing the social costs of the people. Therefore, increasing agricultural income contributes to the improvement of the welfare of the people along with the elevation of the economic status of farmers. In terms of agricultural income components, the causes of stagnation in agricultural income are rising agricultural management costs, stagnation in agricultural productivity, and increased volatility in agricultural product prices. Therefore, firstly, to increase agricultural income, it is necessary to expand the infrastructure for government support and low-cost production systems to reduce agricultural management costs. Second, agricultural income should be improved by increasing the productivity through technological innovation. However, since an increase in production leads to a drop in prices, a new strategy that matches market trends is required to expand added value throughout the value chain from production to distribution. Third, it is necessary to prepare a systematic and efficient policy to mitigate price volatility of agricultural products. After closely evaluating the performance of the related policies currently in effect, it is necessary to consider improving the system or establishing new policies.
Keywords: Korean agriculture, agricultural income, agricultural management cost, productivity
INTRODUCTION
Agricultural income refers to income earned through agricultural management activities. Statics Korea defines agricultural income as the amount obtained by deducting farm expense from gross farm receipts, which is the final performance of agricultural production activities for the year and the total remuneration for the input factors. When agricultural income decreases, farm households make efforts to secure additional sources of income, such as non-farm income activities, to make up for the lack of income. This leads to a reduction in agricultural production activities or passive investment, thereby hindering stable farming activities. Therefore, agricultural income becomes the basis for farm households to continue stable farming activities. Stable farming activities supply quality agricultural products to the people and become the foundation for maintaining rural society and healthy development. Agricultural income can be said to be the key to maintaining the agricultural production base, agricultural growth, and enhancing agricultural and rural values.
However, agricultural income per farm household has not risen any further from the early US$7,740[1] (KRW10 million) range over the past 30 years. After exceeding KRW10 million for the first time in 1994, it fluctuated repeatedly, then fell to US$7,342 (KRW9.49 million) in 2022, returning to the agricultural income level of 10 years ago. Low agricultural income has weakened the investment momentum of the agricultural sector and discouraged young people from entering agriculture, leading to a slowdown in agricultural growth. The fact that the average annual growth rate of the agriculture, forestry, and fisheries sector in Korea over the past 10 years has been only 0.7% does not seem to be unrelated to this. The sustainability of agriculture and rural areas is threatened as a vicious cycle continues in which the income of those who engaged in agriculture decreases due to slow growth in agriculture.
The stagnation of agricultural income is related to structural problems in Korean agriculture, such as poor quality of agricultural labor due to aging, high-cost production structure due to small management scale, rice-centered production structure due to lack of agricultural manpower, and intensifying market competition for domestic agricultural products due to increased imports of agricultural products. It is related to structural problems. Therefore, it is not an easy mission to increase agricultural income in a short period without structural changes in Korean agriculture. Accordingly, this paper examines the current state of agricultural income and diagnoses the causes of stagnant agricultural income. We aim to analyze the causes of stagnation in agricultural income in terms of production, sales price, and farm expense, which are the components of agricultural income. In addition, we would like to suggest directions for improving agricultural income based on the causes of agricultural income stagnation.
AGRICULTURAL INCOME STATUS IN KOREA
Overview of agricultural income status in Korea
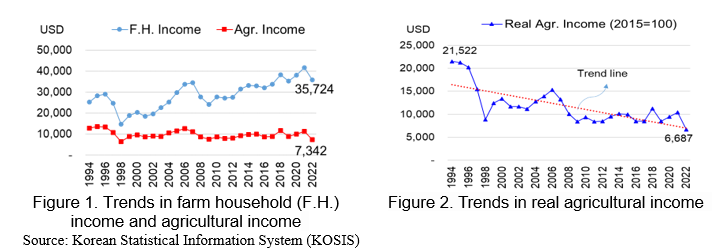
Farm household income in 2022 was US$35,724 on average, a 14.4% decrease from the previous year. After entering US$25,280 in 1994 (about KRW20 million), it rose to US$29,779 (about KRW30 million) in 2005 and US$38,231 (about KRW30 million) in 2018, showing a steady upward trend since the compilation of statistics. On the other hand, agricultural income per farm household first reached the KRW10 million range, recording US$12,848 (about KRW10 million) in 1994, but has repeatedly risen and fallen between a minimum of US$6,402 and a maximum of US$12,655 over the past 30 years, stagnating in the US$7,740 (early KRW10 million range). Agricultural income in 2022 recorded the largest decline ever, 35.2%, remaining at US$7,342, the second lowest since 1994. When nominal agricultural income is converted to real prices, real agricultural income tends to decline (see Figure 2). Real agricultural income, converted to 2015 prices, has decreased by half over the past 30 years from US$21,522 per farm household in 1994 to US$6,687 in 2022.
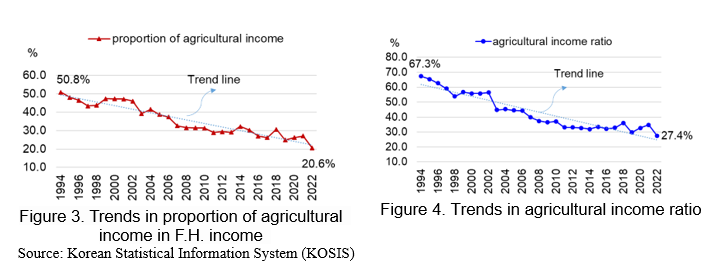
The proportion of agricultural income in farm household income has decreased significantly from 50.8% in 1994 to 20.6% in 2022, and the proportion of agricultural income is continuously decreasing (see Figure 3). Farm households' dependence on agricultural income has sharply decreased. This means that it is becoming increasingly difficult for farmers to invest in reproduction as well as household livelihoods through agricultural activities alone. This is related to the decline in the agricultural income ratio, which represents the proportion of agricultural income in gross farm receipts. The agricultural income ratio decreased significantly from 67.3% in 1994 to 27.4% in 2022 (see Figure 4). Thirty years ago, if US$10 was sold, US$6.73 was returned to the farmers’ income, but now only US$2.74 is returned as income. Over the past 30 years, the income attributed to farmers has decreased by about US$4 for per US$10 of gross farm receipts.
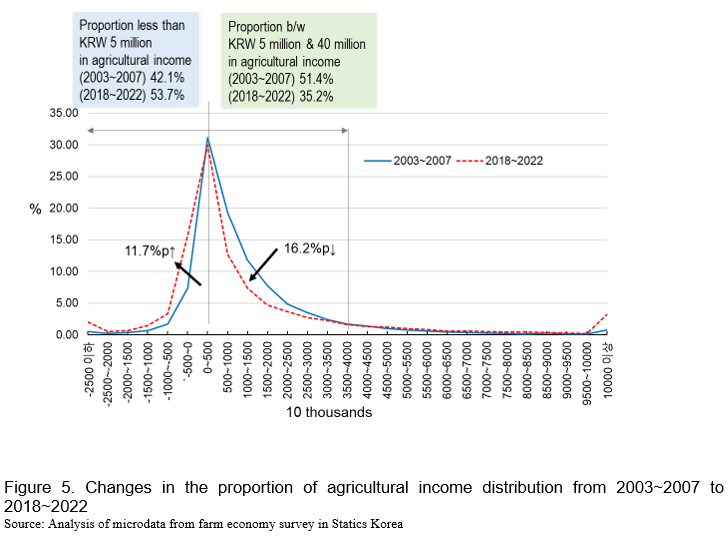
The decrease in dependence on agricultural income is closely related to the downward concentration of agricultural income distribution (see Figure 5). When comparing the distribution of agricultural income among sample farm household in the 2003-2007[2] and 2018-2022, the proportion of farmers earning less than KRW5 million (US$3,870) in agricultural income increased between 2018 and 2022, while the proportion of farmers earning KRW5 million to KRW40 million (US$ 30,961) in agricultural income decreased. From 2018 to 2022, the proportion of farms that failed to raise agricultural income by less than KRW5 million was 53.7%, which was 11.7% point higher than the period from 2003 to 2007, and the proportion of farms in deficit was 23.8%, which was 12.8% point higher than the period from 2003 to 2007. The proportion of farmers with agricultural income between KRW5 million and KRW40 million won was 51.4% between 2003 and 2007 but decreased 16.2% point to 35.2% between 2018 and 2022. Recently, most farmers have been concentrated in the low-income bracket, leading to a decline in agricultural income.
Agricultural income by farming type[3]
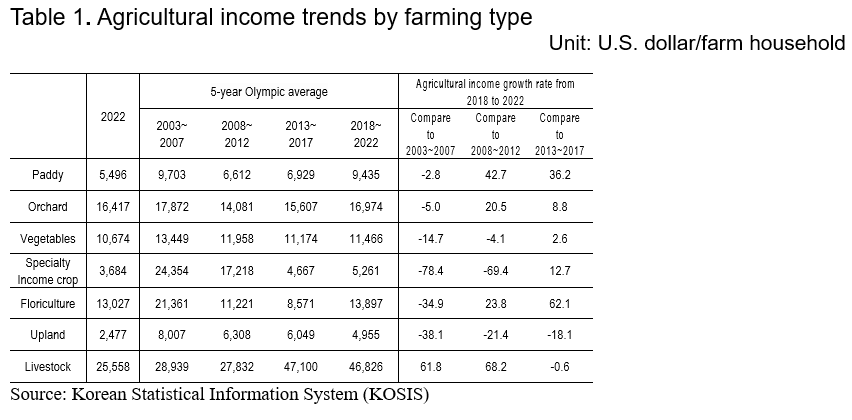
Looking at agricultural income per farm household by farming type as of 2022 (see Table 1), livestock farmers are earning the highest income at US$25,558 per year. This was followed by orchard farmers with US$16,417, floriculture farmers with US$13,027, vegetables farmers with US$10,674, paddy farmers with US$5,496, specialty income crop farmers with US$3,684, and upland farmers US$2,477.
When compared to the 5-year Olympic average[4] in accordance with the replacement cycle of sample farm household, the average agricultural income of paddy farmers from 2018 to 2022 was US$9,435, an increase of 36.2% compared to the previous five years (2013-2017). However, compared to US$9,703 in income from 2003 to 2007, it decreased by 2.8%[5]. The average agricultural income of livestock farms from 2018 to 2022 was US$46,826, an increase of 61.8% compared to the income from 2003 to 2007. On the other hand, the average agricultural income of orchard, vegetables, specialty income crop, floriculture, and upland farms from 2018 to 2022 decreased by 5.0%, 4.4%, 75.8%, 27.0%, and 30.6%, respectively, compared to the average income 15 years ago (2003-2007). Except for livestock farms, most farms' agricultural income has not improved compared to 15 years ago.
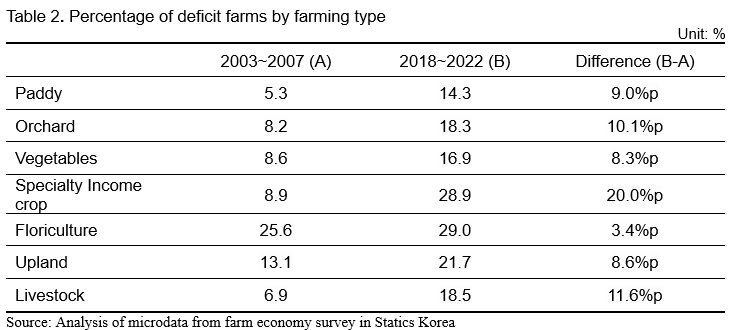
Agricultural income is not improving as the number of farms running a deficit increases. In the agricultural economic sample from 2018 to 2022, 14.3% of paddy farmers suffered a deficit, an increase of 9.0 percentage points compared to the period 2003 to 2007, and 8.2% of orchard farmers suffered a deficit from 2003 to 2007, increased by 10.1 percentage points to 18.3% in the period 2018-2022. Vegetables farmers increased from 8.6% to 16.9% (8.3%p↑), specialty income crop farmers increased from 8.9% to 28.9% (20.0%p↑), floriculture farmers increased from 25.6% to 29.0% (3.4%p↑), upland farmers increased from 13.1% to 21.7% (8.6%p↑), and livestock farms increased from 6.9% to 18.5% (11.6%p↑). The proportion of livestock farms with deficits increased the most (see Table 2), but at the same time, the proportion of agricultural income exceeding KRW100 million (US$77,402) increased the most (2003/2007: 5.6% → 2018/2022: 20.2%), and the agricultural income of livestock farmers between 2018 and 2022 increased by 61.8% from 15 years ago (see Table 1).
Agricultural income status by age of farm owner
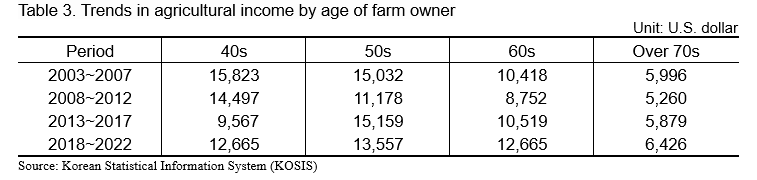
When compared by age based on the average five-year agricultural income, until 2012, agricultural income clearly decreased as the age increased. Those in their 40s earned the highest income in the 2003-2007 period (US$15,823) and 2008-2012 period (US$14,497), followed by those in their 50s (2003~2007: US$15,032 /2008~2012: US$11,178), those in their 60s (US$10,418 /US$8,752), and those in their 70s (US$5,996 /US$5,260). On the other hand, after 2012, those in their 50s recorded the highest income, those in their 40s and 60s recorded similar income, and those in their 70s and older recorded the lowest income. From 2018 to 2022, on average, those in their 50s earned US$13,557 per farm household, those in their 40s and 60s US$12,665, and those in their 70s and older earned US$6,426 in agricultural income (see Table 3).
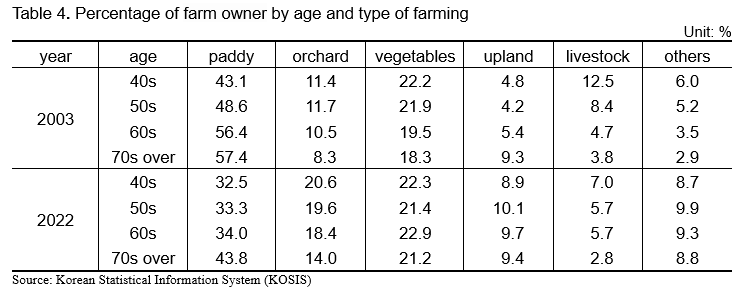
It is believed that the difference in agricultural income according to age was influenced by structural differences in crops cultivated by age. For example, most elderly farmers in their 70s or older are rice farmers with relatively low sales income, so their agricultural income is relatively low compared to other age groups. Because older farmers prefer paddy with a high mechanization rate (`21, 98.6%), the conversion to field crop, which require relatively more labor, is low. This is causing difficulties for elderly farmers in raising agricultural income through cultivation of income crops. Among farmers in their 70s or older, the proportion of rice farmers was 57.4% in 2003, but in 2022, it decreased by 13.6% point to 43.8%. However, during the same period, the proportion of rice farmers in their 50s and 60s fell by 15.3% point and 22.4% point, respectively, falling more than that of farmers in their 70s or older. This means that people in their 50s and 60s have quickly made the transition from rice to field crops. In fact, field crop growers (fruits, vegetables, and upland farmers) showed the highest increase, with 15.6% point in their 60s during the same period, followed by 13.4% point in their 40s, 13.3% point in their 50s, and 8.7% point in their 70s and older.
While the proportion of paddy farmers decreases as the age of farm owner decreases, the proportion of orchard, vegetables, and livestock farms increases. In particular, the proportion of livestock farmers in their 40s (12.5% in 2005, 7.0% in 2022) is higher than that of other age groups, which is believed to have increased agricultural income. However, the average livestock income of owners in their 40s from 2013 to 2017 was US$5,995, a decrease of US$16,907 compared to US$22,902 from 2008 to 2012, making those in their 50s the highest earning age group. The reason for this significant change is that large livestock farms in their 40s were excluded from the process of replacing sample farm household in the farm economy survey. From 2008 to 2012, the average number of livestock raised by sample farms in their 40s was 170.0, but it decreased significantly to 6.1 from 2013 to 2017.
Meanwhile, for those in their 60s, average agricultural income is continuously increasing (see Table 3). This seems to be related to the increase in profitable orchard and vegetable cultivation farms and the expansion of management scale. Among farmers in their 60s, the proportion of orchard farmers increased by 7.9% point from 10.5% in 2003 to 18.4% in 2022, and the proportion of vegetable farmers increased by 3.4% point during the same period (see Table 4). In addition, the proportion of farmers in their 60s with a field area of 1.5ha or more increased by 3.8% point from 4.9% in 2005 to 8.7% in 2022, making significant progress in scale compared to other age groups. During the same period, the proportion of farmers with a field area of 1.5ha or more increased by 0.5% point in their 40s, 1.3% point in their 50s, and 2.0% point in their 70s and older.
CAUSES OF STAGNATION IN AGRICULTURAL INCOME
Rising farm expenses
Among the components of farm expenses, feed costs and fertilizer costs, which are material costs, have increased by 167% and 135%, respectively, since 2003. Labor costs increased by 133%. Agricultural insurance premiums increased by 2,201%, tax by 279%, farming fuel, electricity, and water costs by 243%, distribution costs by 162%, and farming consignment fee by 141% (see Table 5). In about 20 years, most items that make up farm expenses have more than doubled.
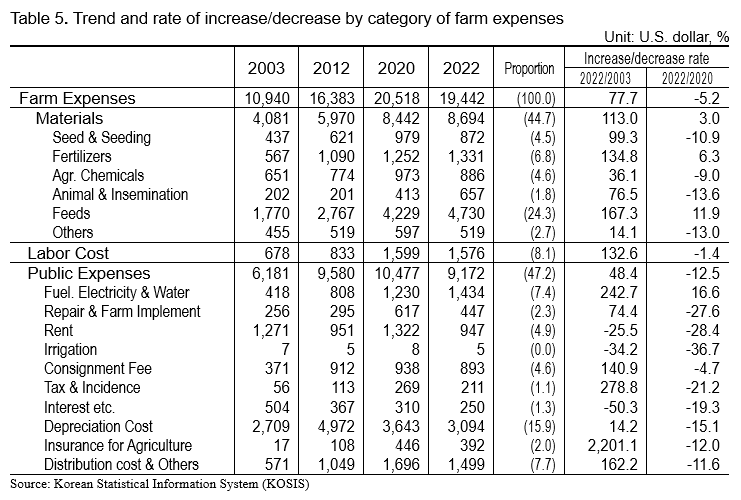
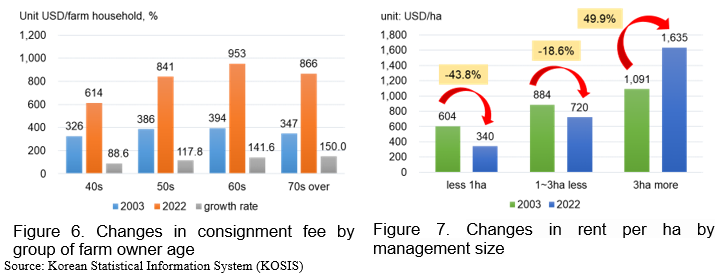
The reasons for the increase in farm expenses are, first, that most of the raw materials for fertilizers, feed, and pesticides, which account for 36% of farm expenses (as of 2022), are dependent on imports. Rising international raw material prices have led to higher manufacturing costs of agricultural materials, leading to higher management costs. The recent COVID-19 and Russia-Ukraine war disrupted international supply chains for crude oil, natural gas, and grains, raising ammonia import prices, the raw material for fertilizers, by 256% during the 2020-2022 period, urea by 202%, potassium chloride by 153%, corn, the raw material for feed, by 80%, and wheat by 52% (Hwang Sung-hyuk et al., 2023). Second, the dependence of agricultural management on external resources has increased due to aging and scale-up. For older farmers, it is not easy to switch to field crops other than paddy and introduce new technologies, and as outsourcing of production activities increases due to low physical activity. Thus, consignment fee and labor costs have increased significantly. In 2022, the fee of consignment farming for farm owners in their 70s or older increased by 150.0% compared to 2003 (`03, US$347 → `22, US$866). In the case of labor costs for those in their 70s or older, it increased by 191.1% (`03, US$248 → `22, US$723) over the same period. Farmers seeking to increase productivity through scale-up saw their rents rise significantly as they expanded their business scale by leasing farmland. The rent per unit area for farms with a management scale of 3ha or more increased by 49.9% from US$1,091 in 2003 to US$1,635 in 2022. On the other hand, the rent for farms less than 1ha fell by 43.8% during the same period (`03, US$604/ha →`22, US$340/ha), and for farms of 1~3ha less, it decreased by 18.6% (`03, US$884 → `22, US$720).
Agricultural productivity stagnation
Agricultural productivity refers to the amount of agricultural production obtained from the input of one unit of production factor. If more can be produced even with the same amount of production factors input, higher sales revenue can be raised, so improved productivity leads to an increase in agricultural income. Therefore, it can be said that stagnation in agricultural income is due to stagnation or decline in agricultural productivity.
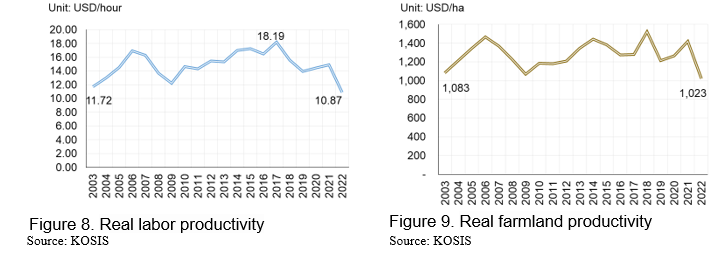
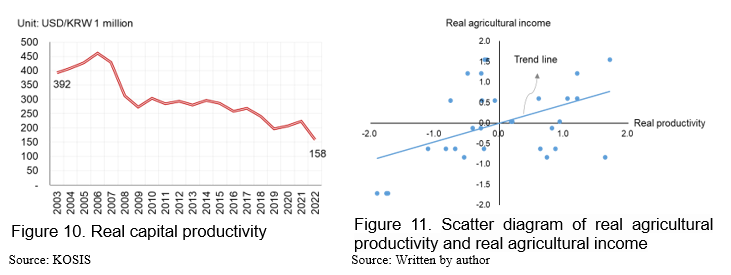
Real labor productivity[6] increased from US$11.72 per hour in 2003 to US$18.19 in 2017, then decreased to US$10.87 in 2022. The agricultural added value obtained from one hour of agricultural labor has been decreasing since 2017. Real farmland productivity[7] decreased slightly from US$1,082 per unit area (10a) in 2003 to US$1,022 in 2022. Since 2013, farmland productivity has been stagnant. Real capital productivity[8] continues to decrease from US$392 in 2003 to US$159 in 2022. In 2003, if KRW1 million of capital (about US$890) was invested, added value of US$392 was generated, but it decreased to US$159 in 2022. The scatter plot between real agricultural productivity (labor, land, capital) and real agricultural income[9] shows an upward trend (see Figure 11). In other words, there is a positive proportional relationship between agricultural productivity and agricultural income, so it can be said that improving agricultural productivity is important to increase agricultural income.
In addition, excessive investment of capital in agricultural production is acting as a cause of decreased productivity. The real capital investment per farm household increased by 22.2% from US$47,488 in 2003 to US$53,531 in 2022. Accordingly, capital intensity per unit area (capital investment amount/arable area) increased rapidly, increasing by 69.2% from US$2,911 (real basis) in 2003 to US$4,551 in 2022. The fact that capital productivity is decreasing despite the continuous increase in capital input into agricultural production means that there is inefficient use of capital or idle capital. For example, an investment in facilities that exceeds the farm's management scale may result in a decrease in facility operation rate or the purchase of agricultural machinery that will only be used for a few days. These can be examples of excessive investment. However, it was found that the smaller the business size, the more excessive capital investment was made. For example, in 2022, the real capital intensity of farms with more than 10ha of farmland is US$2,655, while the capital intensity of farms with less than 0.5ha is US$7,732, which is three times greater than that of farms with more than 10ha. Nevertheless, capital productivity is only US$108 for farms with less than 0.5 ha, which is only 42% of the capital productivity of farms with 10.0 ha or more (US$255).
Increased volatility of agricultural product price
Instability in agricultural prices leads to instability in agricultural income. The wholesale price of Chinese cabbage, which is represented as an item with unstable supply and demand, showed an average fluctuation rate of 60.1% compared to the same period of the previous year between 2003 and 2022. Also, when it skyrocketed, it rose to 358%, and when it fell, it fell as much as 73.7%. Farmers who grow crops with unstable prices are constantly exposed to the risk of repeated price crashes and surges depending on the supply and demand situation of the year. Therefore, farmers struggle to select crops and production scale every year, considering the prices of the previous year. Under uncertainty, farmers' rational decision-making to maximize profits sometimes leads to speculative results regardless of intention, causing great losses to the farmers. If this unstable situation is repeated, farm households will reduce their management scale or give up farming, leading to a decline in agricultural income.
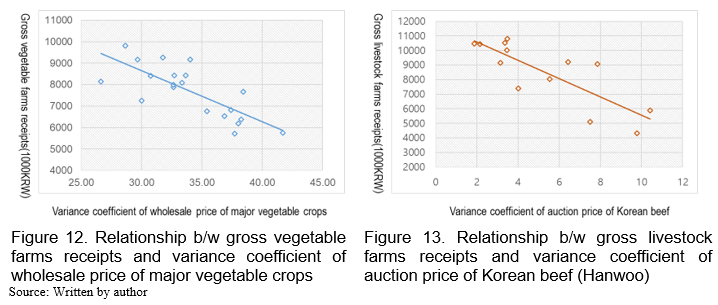
In fact, it was found that there is an inverse relationship between the price volatility of agricultural products and farm households' crop receipts. The horizontal axis of <Figure 12> is the average coefficient of variation of wholesale prices of major vegetables[10], and the vertical axis represents the gross receipts of vegetable farm household. The coefficient of variation[11] is an indicator that measures the degree of dispersion from the center. As the coefficient value increases, it means that the price volatility (range of fluctuations) increases relatively. The dot (◇) represents the next year's vegetable imports corresponding to the coefficient of variation of the vegetable wholesale price of the corresponding year. It shows that gross receipts of vegetable farm household tend to decrease in the years following years when the coefficient of variation in vegetable prices was high. This is presumed to be due to a structure in which, when the price volatility of crops grown each year increases, crops are switched to crops with smaller price fluctuations in the following year, and in this process, prices fall due to the production concentration of certain crops, resulting in a decrease in crop income. <Figure 13> shows the relationship between the coefficient of variation in the price of Korean beef (Hanwoo) and gross receipts of livestock farm household. As shown in <Figure 13>, as the volatility of Korean beef prices increases, gross receipts of livestock farm household tend to decrease. In other words, it can be said that as the price volatility of agricultural products increases, gross farm receipts from crops decreases, and a decrease in gross farm receipts leads to a decrease in agricultural income.
IMPLICATION
Agricultural income refers to the income earned by farmers through agricultural production activities. In Korea, which has an agricultural structure centered on family farms, agricultural income is a source of income for maintaining household livelihoods and funds for continuing farming activities in the following year. Agricultural income fell by 35.2% from the previous year to US$7,342 in 2022, the largest decline since statistics were compiled. The problem of low agricultural income, which has not exceeded about US$7,740 (KRW10 million) range for the past 30 years, can spread from an individual farm problem to the entire agriculture industry and even a national problem. If the decline in agricultural income continues, farm households will stop farming, the function of agriculture as a stable supply of food will be reduced, and dependence on foreign countries for food will further deepen. In addition, public interest functions such as the preservation of the environment, ecology, landscape, and traditional culture created through agricultural production activities will be weakened or disappeared. Farmers who give up farming activities are more likely to make a living through low-wage daily labor, which will devastate the local economy in rural areas and make social problems such as aging poverty and regional extinction more prominent. To restore the lost functions of agriculture and rural areas and maintain rural society, the people will have to pay more social costs. Therefore, increasing agricultural income contributes to improving the economic status of farmers and improving the welfare of the people, and strengthens the foundation for farmers to continue stable farming activities.
To increase agricultural income, policy support is needed to reduce farm expenses. The reason for the decline in agricultural income is that farm expenses increase more rapidly than the increase in gross receipts of farms. In particular, the cost of agricultural materials related to feeds, fertilizers, and oil, which are highly dependent on imported raw materials, is rapidly increasing, acting as a burden on farmers. To alleviate the cost burden on farmers due to temporary price increases, it is necessary to introduce a program to support a portion of the difference in price increases. In the past, when the price of inorganic fertilizers soared, there was a case where 80% of the difference in price increase was subsidized to lower the supply price of fertilizers, so it is necessary to refer to this. However, although support for the cost of agricultural materials is an effective policy in urgent situations, the problem of high costs caused by the structural limitations of Korean agriculture must be resolved with a mid- to long-term strategy. Introduction of precision agriculture to input appropriate amounts of agricultural materials such as fertilizers and pesticides, development of disease-resistant varieties, improvement of mechanization in the sowing, planting, and harvesting stages, expansion of field-based maintenance projects, establishment of a new and renewable energy supply system for agriculture, etc., cost-saving production. Multifaceted efforts are required to build the foundation. In addition, a feed raw material supply base must be established to reduce feed costs for livestock farms. To this end, it is necessary to prepare a step-by-step implementation strategy, such as continuously expanding large-scale feed crop cultivation in reclaimed land, developing salt-resistant varieties, and supplying TMR feed manufacturing machines. For facility horticultural crops, the use of new and renewable energy such as geothermal heat and waste heat should be increased and energy saving facilities should be expanded to increase the efficiency of energy use to reduce agricultural energy costs. In order to reduce the burden of labor costs due to a shortage of farming manpower, improvements should be made to the system to secure foreign agricultural workers, such as expanding agricultural quotas for foreign skilled workers and issuing long-term stay visas to conscientious seasonal workers.
To increase agricultural income, productivity through technological innovation must be increased. Since quantitative growth due to expansion of element inputs has reached its limit, growth can be sustained through technological innovation in agriculture. Since technological innovation in agriculture is linked to the level of research and development in the agricultural sector, investment in research and development must be expanded. To increase agricultural productivity, a transition to high value-added agriculture is necessary. Currently, as agricultural production increases, agricultural added value does not increase due to price declines due to oversupply, so a strategic approach is needed to increase added value throughout the agricultural product value chain, from variety selection to branding and distribution. Efforts are required from producer organizations to produce customized agricultural products that meet consumer needs and to increase the market value of agricultural products, including high quality, safety, and branding. In addition, the added value of agriculture must be improved by linking cutting-edge fields such as food tech and biotech with agriculture, and it is also necessary to discover new promising income crops. There is a need to prevent inefficient production farms from overinvesting in connection with financial support policies. When providing funding, it is necessary to establish a system in which policy funds are differentially provided according to the business ability of farmers. In addition, there is a need to strengthen management improvement consulting and farming technology education for farms to increase productivity.
Increasing agricultural product price volatility threatens farm management by expanding the instability of agricultural income, so policy support for farm management stability must be expanded. With market opening, low-priced foreign agricultural products are taking over the domestic market, so farmers are expanding the cultivation of profitable crops. This has led to oversupply, which has resulted in prices falling and agricultural income not rising. To alleviate price volatility due to supply and demand instability, vegetable price stabilization systems, purchase projects, expansion of government reserves, and market isolation are currently being implemented as policies. However, this system aims to stabilize supply and demand in the ex-post and short term. In other words, because the goal is to resolve supply and demand instability rather than to promote management stability for farms by directly alleviating price volatility of agricultural products, not only will there be a lag in price stabilization depending on market conditions, but it is also unclear to what extent the policy effect will be achieved. Therefore, the establishment of systematic and efficient policies to manage management risks of all farms is required.
Increasing agricultural income is a long-standing task that is not easy to solve as it is linked to the problem of our country's agricultural structure. As it is an old problem, the agricultural income problem must be solved through a multi-faceted policy mix with a mid- to long-term strategy.
REFERENCES
Hwang, Seong-Hyuk, Young-Un Choi, Jeong-Yoon Choi, Jun-Ho Jeong, Bo-Gun Kim (2023), “Top 10 agricultural and rural issues worth paying attention to in 2023”, Nonghyup Quarterly Journal of Research and Studies, Winter 2023 (Vol. 10), National Agricultural Cooperatives Federation, pp. 8~41.
Jeon, Ji-Yeon, Chan-Hee Yoo, and Jun-Gi Park (2016), “Analysis of factors affecting agricultural income of rice and seasoned vegetable farmers”, Korea Rural Economic Review, 39(3), pp.23-48.
Lee, Jeong-Hwan and Seung-Jeong Lee (2012), “The source of agricultural problems: the gap between growth and income”, Focus GS&J, No. 136, GS&J Institute.
Park, Jun-Gi, Nae-Won Oh, Seong-Tae Ji, Hyeon-Geun Lee, Ho-Yeon Jeong (2015), “Farm Management Stability Support System Operation Status and Policy Tasks (2nd/2nd Year)”, Korea Rural Economic Institute.
Park, Jun-Gi, Tae-Gon Kim, Chan-Hee Yoo, Young-Jun Kim, Ji-yeon Jin (2014), “Farm Management Stability Support System Operation Status and Policy Tasks (1st/2nd Year)”, Korea Rural Economic Institute.
Park, Seok-Du, Jeong-Ho Kim, and Chang-Ho Kim (2011), “Study on evaluation and direction establishment of agricultural structural policy: Focusing on rice agriculture”, Korea Rural Economic Institute.
Statistics Korea, Korean Statistical Information System (kosis.kr)
Statistics Korea, Micro Data Integration Service (mdis.kostat.go.kr)
Woo, Byeong-Jun, Hyeong-Yong Lee, and Bo-Hyeon Han (2018), “How are the agricultural structure and farm economy changing?”, 2018 Agricultural Outlook (Ⅰ), Korea Rural Economic Institute.
Yoo, Chan-Hee, Jeong-Seop Kim, Tae-Hoon Kim, Yong-Ho Choi, Nae-Won Oh, Ji-Yeon Park, and Jun-Hyuk Lim (2019), “Agricultural Structural Change Outlook and Response Tasks (1st/2nd Year)”, Korea Rural Economic Institute.
Yoo, Chan-Hee, Tae-Hoon Kim, Tae-Hu Kim, and In-Hye Ha (2020), “Agricultural Structural Change Outlook and Response Tasks (2/2nd Year)”, Korea Rural Economic Institute.
Yoon, Ji-won and Oh-sang Kwon (2016), “Analysis of factors affecting agricultural income by farming type (item type)”, Korea Rural Economic Review, 39(4), pp.29-49.
[1] The average exchange rate for 2022 is applied (US$1 = KRW1,291.95).
[2] Statics Korea reorganized the survey tables and survey guidelines along with the sample reorganization of the 2003 farm economy survey. Therefore, Statics Korea presents the results of the farm economy survey divided into before and after 2003. In the case of analyzing sample farm household in the farm economy survey, the analysis period of this paper was set from 2003 to 2022.
[3]‘Farm household by farming type’ used in the farm economy survey does not refer to farms that only grow the corresponding crops. For example, if a farm is classified as a paddy farmer, this means that the income from paddy farming is the largest among the gross farm receipts. If this farm is engaged in complex farming such as orchard and vegetables in addition to paddy farming, the farm's gross receipts, farm expenses, and agricultural income are the combined results obtained from growing various crops, including paddy.
[4] Since crops have large fluctuations in income due to fluctuations in yields due to crop conditions, the average was calculated after excluding the highest and lowest values to correct them.
[5] It fell 2.8% in U.S. dollar (US$) but rose 9.0% in Korean currency (KRW).
[6] Labor productivity is the ratio of the labor invested and the resulting production and is calculated by dividing agricultural added value by self-employed agricultural labor hours. Real labor productivity was converted from nominal labor productivity to the GDP deflator (2015=100).
[7] Farmland productivity refers to production per unit of land area (0.1ha) and is calculated by dividing agricultural added value by farmland area.
[8] Capital productivity refers to the amount of production relative to the capital invested and is calculated by dividing agricultural added value by the amount of agricultural capital.
[9] To show the dispersion between labor productivity, land productivity, capital productivity, and agricultural income over the last 10 years (`13~`22) in one figure, each productivity and agricultural income were standardized. This was arbitrarily expressed by the author to intuitively examine the relationship between agricultural productivity and agricultural income, and a more precise quantitative analysis method is required for the relationship between agricultural productivity and agricultural income.
[10] Wholesale prices of 17 items including Chinese cabbage, cabbage, radish, spinach, lettuce, cucumber, onion, garlic, green onion and tomato
[11] coefficient of variation = (standard deviation/arithmetic mean) × 100

Korea’s Agricultral Income Status and Implications
ABSTRACT
Korea’s agricultural income per farm household in 2022 was KRW9.49 million (US$7,342), the largest decline since statistics were compiled. The low level of agricultural income, which has not exceeded KRW10 million (US$7,740) over the past 30 years, threatens the sustainability of Korean agriculture and rural areas. If the situation of low agricultural income persists, more farmers will give up farming, which will lead to a decline in the local economy of rural areas, weakening the public interest functions of agriculture such as food supply and environmental and ecological conservation, and significantly increasing the social costs of the people. Therefore, increasing agricultural income contributes to the improvement of the welfare of the people along with the elevation of the economic status of farmers. In terms of agricultural income components, the causes of stagnation in agricultural income are rising agricultural management costs, stagnation in agricultural productivity, and increased volatility in agricultural product prices. Therefore, firstly, to increase agricultural income, it is necessary to expand the infrastructure for government support and low-cost production systems to reduce agricultural management costs. Second, agricultural income should be improved by increasing the productivity through technological innovation. However, since an increase in production leads to a drop in prices, a new strategy that matches market trends is required to expand added value throughout the value chain from production to distribution. Third, it is necessary to prepare a systematic and efficient policy to mitigate price volatility of agricultural products. After closely evaluating the performance of the related policies currently in effect, it is necessary to consider improving the system or establishing new policies.
Keywords: Korean agriculture, agricultural income, agricultural management cost, productivity
INTRODUCTION
Agricultural income refers to income earned through agricultural management activities. Statics Korea defines agricultural income as the amount obtained by deducting farm expense from gross farm receipts, which is the final performance of agricultural production activities for the year and the total remuneration for the input factors. When agricultural income decreases, farm households make efforts to secure additional sources of income, such as non-farm income activities, to make up for the lack of income. This leads to a reduction in agricultural production activities or passive investment, thereby hindering stable farming activities. Therefore, agricultural income becomes the basis for farm households to continue stable farming activities. Stable farming activities supply quality agricultural products to the people and become the foundation for maintaining rural society and healthy development. Agricultural income can be said to be the key to maintaining the agricultural production base, agricultural growth, and enhancing agricultural and rural values.
However, agricultural income per farm household has not risen any further from the early US$7,740[1] (KRW10 million) range over the past 30 years. After exceeding KRW10 million for the first time in 1994, it fluctuated repeatedly, then fell to US$7,342 (KRW9.49 million) in 2022, returning to the agricultural income level of 10 years ago. Low agricultural income has weakened the investment momentum of the agricultural sector and discouraged young people from entering agriculture, leading to a slowdown in agricultural growth. The fact that the average annual growth rate of the agriculture, forestry, and fisheries sector in Korea over the past 10 years has been only 0.7% does not seem to be unrelated to this. The sustainability of agriculture and rural areas is threatened as a vicious cycle continues in which the income of those who engaged in agriculture decreases due to slow growth in agriculture.
The stagnation of agricultural income is related to structural problems in Korean agriculture, such as poor quality of agricultural labor due to aging, high-cost production structure due to small management scale, rice-centered production structure due to lack of agricultural manpower, and intensifying market competition for domestic agricultural products due to increased imports of agricultural products. It is related to structural problems. Therefore, it is not an easy mission to increase agricultural income in a short period without structural changes in Korean agriculture. Accordingly, this paper examines the current state of agricultural income and diagnoses the causes of stagnant agricultural income. We aim to analyze the causes of stagnation in agricultural income in terms of production, sales price, and farm expense, which are the components of agricultural income. In addition, we would like to suggest directions for improving agricultural income based on the causes of agricultural income stagnation.
AGRICULTURAL INCOME STATUS IN KOREA
Overview of agricultural income status in Korea
Farm household income in 2022 was US$35,724 on average, a 14.4% decrease from the previous year. After entering US$25,280 in 1994 (about KRW20 million), it rose to US$29,779 (about KRW30 million) in 2005 and US$38,231 (about KRW30 million) in 2018, showing a steady upward trend since the compilation of statistics. On the other hand, agricultural income per farm household first reached the KRW10 million range, recording US$12,848 (about KRW10 million) in 1994, but has repeatedly risen and fallen between a minimum of US$6,402 and a maximum of US$12,655 over the past 30 years, stagnating in the US$7,740 (early KRW10 million range). Agricultural income in 2022 recorded the largest decline ever, 35.2%, remaining at US$7,342, the second lowest since 1994. When nominal agricultural income is converted to real prices, real agricultural income tends to decline (see Figure 2). Real agricultural income, converted to 2015 prices, has decreased by half over the past 30 years from US$21,522 per farm household in 1994 to US$6,687 in 2022.
The proportion of agricultural income in farm household income has decreased significantly from 50.8% in 1994 to 20.6% in 2022, and the proportion of agricultural income is continuously decreasing (see Figure 3). Farm households' dependence on agricultural income has sharply decreased. This means that it is becoming increasingly difficult for farmers to invest in reproduction as well as household livelihoods through agricultural activities alone. This is related to the decline in the agricultural income ratio, which represents the proportion of agricultural income in gross farm receipts. The agricultural income ratio decreased significantly from 67.3% in 1994 to 27.4% in 2022 (see Figure 4). Thirty years ago, if US$10 was sold, US$6.73 was returned to the farmers’ income, but now only US$2.74 is returned as income. Over the past 30 years, the income attributed to farmers has decreased by about US$4 for per US$10 of gross farm receipts.
The decrease in dependence on agricultural income is closely related to the downward concentration of agricultural income distribution (see Figure 5). When comparing the distribution of agricultural income among sample farm household in the 2003-2007[2] and 2018-2022, the proportion of farmers earning less than KRW5 million (US$3,870) in agricultural income increased between 2018 and 2022, while the proportion of farmers earning KRW5 million to KRW40 million (US$ 30,961) in agricultural income decreased. From 2018 to 2022, the proportion of farms that failed to raise agricultural income by less than KRW5 million was 53.7%, which was 11.7% point higher than the period from 2003 to 2007, and the proportion of farms in deficit was 23.8%, which was 12.8% point higher than the period from 2003 to 2007. The proportion of farmers with agricultural income between KRW5 million and KRW40 million won was 51.4% between 2003 and 2007 but decreased 16.2% point to 35.2% between 2018 and 2022. Recently, most farmers have been concentrated in the low-income bracket, leading to a decline in agricultural income.
Agricultural income by farming type[3]
Looking at agricultural income per farm household by farming type as of 2022 (see Table 1), livestock farmers are earning the highest income at US$25,558 per year. This was followed by orchard farmers with US$16,417, floriculture farmers with US$13,027, vegetables farmers with US$10,674, paddy farmers with US$5,496, specialty income crop farmers with US$3,684, and upland farmers US$2,477.
When compared to the 5-year Olympic average[4] in accordance with the replacement cycle of sample farm household, the average agricultural income of paddy farmers from 2018 to 2022 was US$9,435, an increase of 36.2% compared to the previous five years (2013-2017). However, compared to US$9,703 in income from 2003 to 2007, it decreased by 2.8%[5]. The average agricultural income of livestock farms from 2018 to 2022 was US$46,826, an increase of 61.8% compared to the income from 2003 to 2007. On the other hand, the average agricultural income of orchard, vegetables, specialty income crop, floriculture, and upland farms from 2018 to 2022 decreased by 5.0%, 4.4%, 75.8%, 27.0%, and 30.6%, respectively, compared to the average income 15 years ago (2003-2007). Except for livestock farms, most farms' agricultural income has not improved compared to 15 years ago.
Agricultural income is not improving as the number of farms running a deficit increases. In the agricultural economic sample from 2018 to 2022, 14.3% of paddy farmers suffered a deficit, an increase of 9.0 percentage points compared to the period 2003 to 2007, and 8.2% of orchard farmers suffered a deficit from 2003 to 2007, increased by 10.1 percentage points to 18.3% in the period 2018-2022. Vegetables farmers increased from 8.6% to 16.9% (8.3%p↑), specialty income crop farmers increased from 8.9% to 28.9% (20.0%p↑), floriculture farmers increased from 25.6% to 29.0% (3.4%p↑), upland farmers increased from 13.1% to 21.7% (8.6%p↑), and livestock farms increased from 6.9% to 18.5% (11.6%p↑). The proportion of livestock farms with deficits increased the most (see Table 2), but at the same time, the proportion of agricultural income exceeding KRW100 million (US$77,402) increased the most (2003/2007: 5.6% → 2018/2022: 20.2%), and the agricultural income of livestock farmers between 2018 and 2022 increased by 61.8% from 15 years ago (see Table 1).
Agricultural income status by age of farm owner
When compared by age based on the average five-year agricultural income, until 2012, agricultural income clearly decreased as the age increased. Those in their 40s earned the highest income in the 2003-2007 period (US$15,823) and 2008-2012 period (US$14,497), followed by those in their 50s (2003~2007: US$15,032 /2008~2012: US$11,178), those in their 60s (US$10,418 /US$8,752), and those in their 70s (US$5,996 /US$5,260). On the other hand, after 2012, those in their 50s recorded the highest income, those in their 40s and 60s recorded similar income, and those in their 70s and older recorded the lowest income. From 2018 to 2022, on average, those in their 50s earned US$13,557 per farm household, those in their 40s and 60s US$12,665, and those in their 70s and older earned US$6,426 in agricultural income (see Table 3).
It is believed that the difference in agricultural income according to age was influenced by structural differences in crops cultivated by age. For example, most elderly farmers in their 70s or older are rice farmers with relatively low sales income, so their agricultural income is relatively low compared to other age groups. Because older farmers prefer paddy with a high mechanization rate (`21, 98.6%), the conversion to field crop, which require relatively more labor, is low. This is causing difficulties for elderly farmers in raising agricultural income through cultivation of income crops. Among farmers in their 70s or older, the proportion of rice farmers was 57.4% in 2003, but in 2022, it decreased by 13.6% point to 43.8%. However, during the same period, the proportion of rice farmers in their 50s and 60s fell by 15.3% point and 22.4% point, respectively, falling more than that of farmers in their 70s or older. This means that people in their 50s and 60s have quickly made the transition from rice to field crops. In fact, field crop growers (fruits, vegetables, and upland farmers) showed the highest increase, with 15.6% point in their 60s during the same period, followed by 13.4% point in their 40s, 13.3% point in their 50s, and 8.7% point in their 70s and older.
While the proportion of paddy farmers decreases as the age of farm owner decreases, the proportion of orchard, vegetables, and livestock farms increases. In particular, the proportion of livestock farmers in their 40s (12.5% in 2005, 7.0% in 2022) is higher than that of other age groups, which is believed to have increased agricultural income. However, the average livestock income of owners in their 40s from 2013 to 2017 was US$5,995, a decrease of US$16,907 compared to US$22,902 from 2008 to 2012, making those in their 50s the highest earning age group. The reason for this significant change is that large livestock farms in their 40s were excluded from the process of replacing sample farm household in the farm economy survey. From 2008 to 2012, the average number of livestock raised by sample farms in their 40s was 170.0, but it decreased significantly to 6.1 from 2013 to 2017.
Meanwhile, for those in their 60s, average agricultural income is continuously increasing (see Table 3). This seems to be related to the increase in profitable orchard and vegetable cultivation farms and the expansion of management scale. Among farmers in their 60s, the proportion of orchard farmers increased by 7.9% point from 10.5% in 2003 to 18.4% in 2022, and the proportion of vegetable farmers increased by 3.4% point during the same period (see Table 4). In addition, the proportion of farmers in their 60s with a field area of 1.5ha or more increased by 3.8% point from 4.9% in 2005 to 8.7% in 2022, making significant progress in scale compared to other age groups. During the same period, the proportion of farmers with a field area of 1.5ha or more increased by 0.5% point in their 40s, 1.3% point in their 50s, and 2.0% point in their 70s and older.
CAUSES OF STAGNATION IN AGRICULTURAL INCOME
Rising farm expenses
Among the components of farm expenses, feed costs and fertilizer costs, which are material costs, have increased by 167% and 135%, respectively, since 2003. Labor costs increased by 133%. Agricultural insurance premiums increased by 2,201%, tax by 279%, farming fuel, electricity, and water costs by 243%, distribution costs by 162%, and farming consignment fee by 141% (see Table 5). In about 20 years, most items that make up farm expenses have more than doubled.
The reasons for the increase in farm expenses are, first, that most of the raw materials for fertilizers, feed, and pesticides, which account for 36% of farm expenses (as of 2022), are dependent on imports. Rising international raw material prices have led to higher manufacturing costs of agricultural materials, leading to higher management costs. The recent COVID-19 and Russia-Ukraine war disrupted international supply chains for crude oil, natural gas, and grains, raising ammonia import prices, the raw material for fertilizers, by 256% during the 2020-2022 period, urea by 202%, potassium chloride by 153%, corn, the raw material for feed, by 80%, and wheat by 52% (Hwang Sung-hyuk et al., 2023). Second, the dependence of agricultural management on external resources has increased due to aging and scale-up. For older farmers, it is not easy to switch to field crops other than paddy and introduce new technologies, and as outsourcing of production activities increases due to low physical activity. Thus, consignment fee and labor costs have increased significantly. In 2022, the fee of consignment farming for farm owners in their 70s or older increased by 150.0% compared to 2003 (`03, US$347 → `22, US$866). In the case of labor costs for those in their 70s or older, it increased by 191.1% (`03, US$248 → `22, US$723) over the same period. Farmers seeking to increase productivity through scale-up saw their rents rise significantly as they expanded their business scale by leasing farmland. The rent per unit area for farms with a management scale of 3ha or more increased by 49.9% from US$1,091 in 2003 to US$1,635 in 2022. On the other hand, the rent for farms less than 1ha fell by 43.8% during the same period (`03, US$604/ha →`22, US$340/ha), and for farms of 1~3ha less, it decreased by 18.6% (`03, US$884 → `22, US$720).
Agricultural productivity stagnation
Agricultural productivity refers to the amount of agricultural production obtained from the input of one unit of production factor. If more can be produced even with the same amount of production factors input, higher sales revenue can be raised, so improved productivity leads to an increase in agricultural income. Therefore, it can be said that stagnation in agricultural income is due to stagnation or decline in agricultural productivity.
Real labor productivity[6] increased from US$11.72 per hour in 2003 to US$18.19 in 2017, then decreased to US$10.87 in 2022. The agricultural added value obtained from one hour of agricultural labor has been decreasing since 2017. Real farmland productivity[7] decreased slightly from US$1,082 per unit area (10a) in 2003 to US$1,022 in 2022. Since 2013, farmland productivity has been stagnant. Real capital productivity[8] continues to decrease from US$392 in 2003 to US$159 in 2022. In 2003, if KRW1 million of capital (about US$890) was invested, added value of US$392 was generated, but it decreased to US$159 in 2022. The scatter plot between real agricultural productivity (labor, land, capital) and real agricultural income[9] shows an upward trend (see Figure 11). In other words, there is a positive proportional relationship between agricultural productivity and agricultural income, so it can be said that improving agricultural productivity is important to increase agricultural income.
In addition, excessive investment of capital in agricultural production is acting as a cause of decreased productivity. The real capital investment per farm household increased by 22.2% from US$47,488 in 2003 to US$53,531 in 2022. Accordingly, capital intensity per unit area (capital investment amount/arable area) increased rapidly, increasing by 69.2% from US$2,911 (real basis) in 2003 to US$4,551 in 2022. The fact that capital productivity is decreasing despite the continuous increase in capital input into agricultural production means that there is inefficient use of capital or idle capital. For example, an investment in facilities that exceeds the farm's management scale may result in a decrease in facility operation rate or the purchase of agricultural machinery that will only be used for a few days. These can be examples of excessive investment. However, it was found that the smaller the business size, the more excessive capital investment was made. For example, in 2022, the real capital intensity of farms with more than 10ha of farmland is US$2,655, while the capital intensity of farms with less than 0.5ha is US$7,732, which is three times greater than that of farms with more than 10ha. Nevertheless, capital productivity is only US$108 for farms with less than 0.5 ha, which is only 42% of the capital productivity of farms with 10.0 ha or more (US$255).
Increased volatility of agricultural product price
Instability in agricultural prices leads to instability in agricultural income. The wholesale price of Chinese cabbage, which is represented as an item with unstable supply and demand, showed an average fluctuation rate of 60.1% compared to the same period of the previous year between 2003 and 2022. Also, when it skyrocketed, it rose to 358%, and when it fell, it fell as much as 73.7%. Farmers who grow crops with unstable prices are constantly exposed to the risk of repeated price crashes and surges depending on the supply and demand situation of the year. Therefore, farmers struggle to select crops and production scale every year, considering the prices of the previous year. Under uncertainty, farmers' rational decision-making to maximize profits sometimes leads to speculative results regardless of intention, causing great losses to the farmers. If this unstable situation is repeated, farm households will reduce their management scale or give up farming, leading to a decline in agricultural income.
In fact, it was found that there is an inverse relationship between the price volatility of agricultural products and farm households' crop receipts. The horizontal axis of <Figure 12> is the average coefficient of variation of wholesale prices of major vegetables[10], and the vertical axis represents the gross receipts of vegetable farm household. The coefficient of variation[11] is an indicator that measures the degree of dispersion from the center. As the coefficient value increases, it means that the price volatility (range of fluctuations) increases relatively. The dot (◇) represents the next year's vegetable imports corresponding to the coefficient of variation of the vegetable wholesale price of the corresponding year. It shows that gross receipts of vegetable farm household tend to decrease in the years following years when the coefficient of variation in vegetable prices was high. This is presumed to be due to a structure in which, when the price volatility of crops grown each year increases, crops are switched to crops with smaller price fluctuations in the following year, and in this process, prices fall due to the production concentration of certain crops, resulting in a decrease in crop income. <Figure 13> shows the relationship between the coefficient of variation in the price of Korean beef (Hanwoo) and gross receipts of livestock farm household. As shown in <Figure 13>, as the volatility of Korean beef prices increases, gross receipts of livestock farm household tend to decrease. In other words, it can be said that as the price volatility of agricultural products increases, gross farm receipts from crops decreases, and a decrease in gross farm receipts leads to a decrease in agricultural income.
IMPLICATION
Agricultural income refers to the income earned by farmers through agricultural production activities. In Korea, which has an agricultural structure centered on family farms, agricultural income is a source of income for maintaining household livelihoods and funds for continuing farming activities in the following year. Agricultural income fell by 35.2% from the previous year to US$7,342 in 2022, the largest decline since statistics were compiled. The problem of low agricultural income, which has not exceeded about US$7,740 (KRW10 million) range for the past 30 years, can spread from an individual farm problem to the entire agriculture industry and even a national problem. If the decline in agricultural income continues, farm households will stop farming, the function of agriculture as a stable supply of food will be reduced, and dependence on foreign countries for food will further deepen. In addition, public interest functions such as the preservation of the environment, ecology, landscape, and traditional culture created through agricultural production activities will be weakened or disappeared. Farmers who give up farming activities are more likely to make a living through low-wage daily labor, which will devastate the local economy in rural areas and make social problems such as aging poverty and regional extinction more prominent. To restore the lost functions of agriculture and rural areas and maintain rural society, the people will have to pay more social costs. Therefore, increasing agricultural income contributes to improving the economic status of farmers and improving the welfare of the people, and strengthens the foundation for farmers to continue stable farming activities.
To increase agricultural income, policy support is needed to reduce farm expenses. The reason for the decline in agricultural income is that farm expenses increase more rapidly than the increase in gross receipts of farms. In particular, the cost of agricultural materials related to feeds, fertilizers, and oil, which are highly dependent on imported raw materials, is rapidly increasing, acting as a burden on farmers. To alleviate the cost burden on farmers due to temporary price increases, it is necessary to introduce a program to support a portion of the difference in price increases. In the past, when the price of inorganic fertilizers soared, there was a case where 80% of the difference in price increase was subsidized to lower the supply price of fertilizers, so it is necessary to refer to this. However, although support for the cost of agricultural materials is an effective policy in urgent situations, the problem of high costs caused by the structural limitations of Korean agriculture must be resolved with a mid- to long-term strategy. Introduction of precision agriculture to input appropriate amounts of agricultural materials such as fertilizers and pesticides, development of disease-resistant varieties, improvement of mechanization in the sowing, planting, and harvesting stages, expansion of field-based maintenance projects, establishment of a new and renewable energy supply system for agriculture, etc., cost-saving production. Multifaceted efforts are required to build the foundation. In addition, a feed raw material supply base must be established to reduce feed costs for livestock farms. To this end, it is necessary to prepare a step-by-step implementation strategy, such as continuously expanding large-scale feed crop cultivation in reclaimed land, developing salt-resistant varieties, and supplying TMR feed manufacturing machines. For facility horticultural crops, the use of new and renewable energy such as geothermal heat and waste heat should be increased and energy saving facilities should be expanded to increase the efficiency of energy use to reduce agricultural energy costs. In order to reduce the burden of labor costs due to a shortage of farming manpower, improvements should be made to the system to secure foreign agricultural workers, such as expanding agricultural quotas for foreign skilled workers and issuing long-term stay visas to conscientious seasonal workers.
To increase agricultural income, productivity through technological innovation must be increased. Since quantitative growth due to expansion of element inputs has reached its limit, growth can be sustained through technological innovation in agriculture. Since technological innovation in agriculture is linked to the level of research and development in the agricultural sector, investment in research and development must be expanded. To increase agricultural productivity, a transition to high value-added agriculture is necessary. Currently, as agricultural production increases, agricultural added value does not increase due to price declines due to oversupply, so a strategic approach is needed to increase added value throughout the agricultural product value chain, from variety selection to branding and distribution. Efforts are required from producer organizations to produce customized agricultural products that meet consumer needs and to increase the market value of agricultural products, including high quality, safety, and branding. In addition, the added value of agriculture must be improved by linking cutting-edge fields such as food tech and biotech with agriculture, and it is also necessary to discover new promising income crops. There is a need to prevent inefficient production farms from overinvesting in connection with financial support policies. When providing funding, it is necessary to establish a system in which policy funds are differentially provided according to the business ability of farmers. In addition, there is a need to strengthen management improvement consulting and farming technology education for farms to increase productivity.
Increasing agricultural product price volatility threatens farm management by expanding the instability of agricultural income, so policy support for farm management stability must be expanded. With market opening, low-priced foreign agricultural products are taking over the domestic market, so farmers are expanding the cultivation of profitable crops. This has led to oversupply, which has resulted in prices falling and agricultural income not rising. To alleviate price volatility due to supply and demand instability, vegetable price stabilization systems, purchase projects, expansion of government reserves, and market isolation are currently being implemented as policies. However, this system aims to stabilize supply and demand in the ex-post and short term. In other words, because the goal is to resolve supply and demand instability rather than to promote management stability for farms by directly alleviating price volatility of agricultural products, not only will there be a lag in price stabilization depending on market conditions, but it is also unclear to what extent the policy effect will be achieved. Therefore, the establishment of systematic and efficient policies to manage management risks of all farms is required.
Increasing agricultural income is a long-standing task that is not easy to solve as it is linked to the problem of our country's agricultural structure. As it is an old problem, the agricultural income problem must be solved through a multi-faceted policy mix with a mid- to long-term strategy.
REFERENCES
Hwang, Seong-Hyuk, Young-Un Choi, Jeong-Yoon Choi, Jun-Ho Jeong, Bo-Gun Kim (2023), “Top 10 agricultural and rural issues worth paying attention to in 2023”, Nonghyup Quarterly Journal of Research and Studies, Winter 2023 (Vol. 10), National Agricultural Cooperatives Federation, pp. 8~41.
Jeon, Ji-Yeon, Chan-Hee Yoo, and Jun-Gi Park (2016), “Analysis of factors affecting agricultural income of rice and seasoned vegetable farmers”, Korea Rural Economic Review, 39(3), pp.23-48.
Lee, Jeong-Hwan and Seung-Jeong Lee (2012), “The source of agricultural problems: the gap between growth and income”, Focus GS&J, No. 136, GS&J Institute.
Park, Jun-Gi, Nae-Won Oh, Seong-Tae Ji, Hyeon-Geun Lee, Ho-Yeon Jeong (2015), “Farm Management Stability Support System Operation Status and Policy Tasks (2nd/2nd Year)”, Korea Rural Economic Institute.
Park, Jun-Gi, Tae-Gon Kim, Chan-Hee Yoo, Young-Jun Kim, Ji-yeon Jin (2014), “Farm Management Stability Support System Operation Status and Policy Tasks (1st/2nd Year)”, Korea Rural Economic Institute.
Park, Seok-Du, Jeong-Ho Kim, and Chang-Ho Kim (2011), “Study on evaluation and direction establishment of agricultural structural policy: Focusing on rice agriculture”, Korea Rural Economic Institute.
Statistics Korea, Korean Statistical Information System (kosis.kr)
Statistics Korea, Micro Data Integration Service (mdis.kostat.go.kr)
Woo, Byeong-Jun, Hyeong-Yong Lee, and Bo-Hyeon Han (2018), “How are the agricultural structure and farm economy changing?”, 2018 Agricultural Outlook (Ⅰ), Korea Rural Economic Institute.
Yoo, Chan-Hee, Jeong-Seop Kim, Tae-Hoon Kim, Yong-Ho Choi, Nae-Won Oh, Ji-Yeon Park, and Jun-Hyuk Lim (2019), “Agricultural Structural Change Outlook and Response Tasks (1st/2nd Year)”, Korea Rural Economic Institute.
Yoo, Chan-Hee, Tae-Hoon Kim, Tae-Hu Kim, and In-Hye Ha (2020), “Agricultural Structural Change Outlook and Response Tasks (2/2nd Year)”, Korea Rural Economic Institute.
Yoon, Ji-won and Oh-sang Kwon (2016), “Analysis of factors affecting agricultural income by farming type (item type)”, Korea Rural Economic Review, 39(4), pp.29-49.
[1] The average exchange rate for 2022 is applied (US$1 = KRW1,291.95).
[2] Statics Korea reorganized the survey tables and survey guidelines along with the sample reorganization of the 2003 farm economy survey. Therefore, Statics Korea presents the results of the farm economy survey divided into before and after 2003. In the case of analyzing sample farm household in the farm economy survey, the analysis period of this paper was set from 2003 to 2022.
[3]‘Farm household by farming type’ used in the farm economy survey does not refer to farms that only grow the corresponding crops. For example, if a farm is classified as a paddy farmer, this means that the income from paddy farming is the largest among the gross farm receipts. If this farm is engaged in complex farming such as orchard and vegetables in addition to paddy farming, the farm's gross receipts, farm expenses, and agricultural income are the combined results obtained from growing various crops, including paddy.
[4] Since crops have large fluctuations in income due to fluctuations in yields due to crop conditions, the average was calculated after excluding the highest and lowest values to correct them.
[5] It fell 2.8% in U.S. dollar (US$) but rose 9.0% in Korean currency (KRW).
[6] Labor productivity is the ratio of the labor invested and the resulting production and is calculated by dividing agricultural added value by self-employed agricultural labor hours. Real labor productivity was converted from nominal labor productivity to the GDP deflator (2015=100).
[7] Farmland productivity refers to production per unit of land area (0.1ha) and is calculated by dividing agricultural added value by farmland area.
[8] Capital productivity refers to the amount of production relative to the capital invested and is calculated by dividing agricultural added value by the amount of agricultural capital.
[9] To show the dispersion between labor productivity, land productivity, capital productivity, and agricultural income over the last 10 years (`13~`22) in one figure, each productivity and agricultural income were standardized. This was arbitrarily expressed by the author to intuitively examine the relationship between agricultural productivity and agricultural income, and a more precise quantitative analysis method is required for the relationship between agricultural productivity and agricultural income.
[10] Wholesale prices of 17 items including Chinese cabbage, cabbage, radish, spinach, lettuce, cucumber, onion, garlic, green onion and tomato
[11] coefficient of variation = (standard deviation/arithmetic mean) × 100