ABSTRACT
For the small-scale producers in Dongshi Township, where rural villages mainly rely on aquaculture dispersed between Dongshi Fisherman's Wharf and river lowlands in Southwestern Taiwan, climate change is real and hits home: the rising sea level, the severer soil salinization unfavorable for agricultural production, as well as the unexpected flood and drought events. Within such a vast lowland area stands the only, so far, low-carbon community in the Township verified by the Environmental Protection Administration (EPA), for experimenting the local agri-food system by rural community tourism, ecological pond aquaculture, and farm/pond-to-table dining experience—even years before ‘carbon emission reduction’ and ‘net-zero carbon emissions’ become the buzzwords in Taiwan’s agricultural policy discourse. The heated discussion around the current carbon reduction policy approaches in the domestic agricultural sector, however, tends to revolve around the business decisions—mostly corporate-based—and how they can contribute to reaching the national goals by 2040 and 2050. Considering the average size of farming land in Taiwan per farm household is around 0.72 hectares, according to the Council of Agriculture (2021), how the majority of small-scale producers could act on this emerging policy scheme seems to be absent from the public discussion. The present article sets out with a case study of the aforementioned field of aquaculture production from the converging perspectives of sustainable rural community development, climate frameworks, and sustainability transitions to illustrate: (1) how the local stakeholders voluntarily turn to the low-carbon approach, (2) the local needs and forthcoming challenges, (3) the connotations of going ‘low-carbon’ and how to do it right in the logic of science-based carbon management/calculation behind the latest carbon reduction policy.
Keywords: small-scale producers, low-carbon, ecological pond aquaculture, carbon management
INTRODUCTION
From the Kyoto Protocol (1997) to the Paris Agreement (2015) and the FY2021 26th United Nations Climate Change Conference of the Parties (COP26), pursuing the reduction of greenhouse gas (GHG) emissions has become not just a responsibility issue shared by all but a global arena calling for participation and voluntary disclosure. The policy framework based on the objective of carbon neutrality or Net Zero has not been confined to the early circle of countries/regions while many rising ones aim to follow suit, including Taiwan declaring its roadmap by 2050 and specifically pointing to the planned contribution of the agricultural sector.
Much discussion around the above policy framework tends to fall upon how to achieve the pledge, highlighting the future carbon trading system that may mean benefits for the investors, and the top charts of enterprises employing ESG (environmental, social, and governance) strategy to do so. The thing is: the pledge at the national level is one thing, and how to implement the transition at the local level is another. It is not until May 2022 that an updated domestic version of GHG emission inventory guidelines (Environmental Protection Administration [EPA], 2022) gets to be published allowing small and medium-sized enterprises (SMEs) to follow, still confined to the manufacturing and service sectors though. This concept of carbon management is not new, but the logic of science-based calculation behind it may be pretty new to the general producers in the agricultural sector. As any transition takes time and communication, not to mention potential barriers that may prevent the adoption of technological innovations in the face of climate change (Long, Blok & Coninx, 2016), the motive and practical steps taken behind this are yet to be addressed.
Before going into reducing the carbon emissions, how to help identify them shall be the preliminary fundamental work. The present article illustrates the attempts of grassroots stakeholders/producers to keep experimenting with a more sustainable approach both in ecological pond aquaculture and rural community development, and how they may respond to the latest carbon reduction policy framework. The findings and analytical sections here are derived from long-term companionship in a particular rural village noted as the lowest lowland area in Chiayi County, Southwestern Taiwan, with assistance from the second author specialized in carbon neutral certification schemes (including but not confined to ISO 14064-1:2018, ISO 14067:2018 and PAS2060). How to progress from a low-carbon community to literally fostering low-carbon local economy, the preliminary stage demonstrated here would point to more preparation and action than words, more motivating factors than abstract propaganda, and more down-to-earth communication. While many reports/studies on climate change, agriculture, and food security have drawn upon soil organic carbon (SOC) content and the related crops in the sense of carbon management, this case study would contribute to the existing literature with practices of a different scenario in pond aquaculture, hopefully to be followed by more future cases to come.
CASE SCENARIO OVERVIEW
The water-centric community
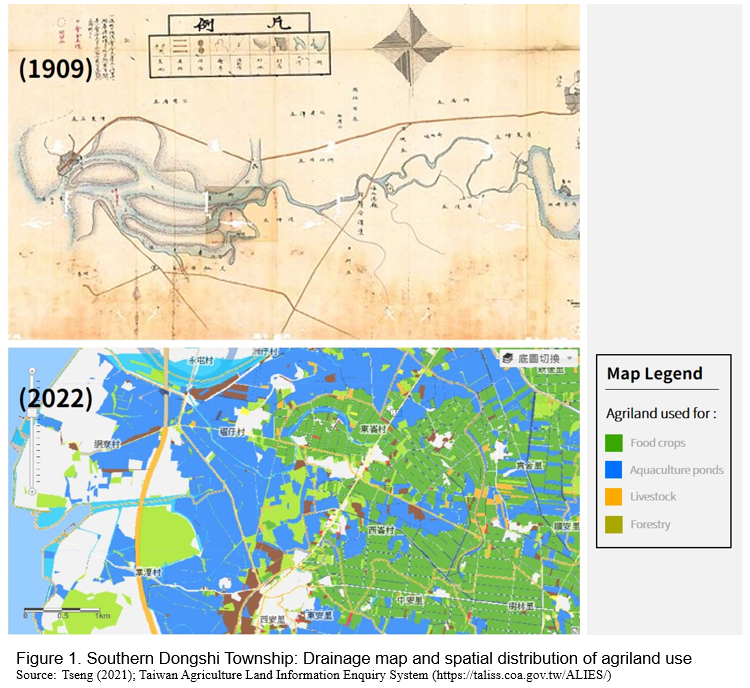
Water is the essential backdrop of the modern-day Dongshi Township. Its dwelling history dates back to more than three hundred years ago, when the villages “were surrounded by water on all sides adjacent to pieces of fields (Tseng, 2021).” To this day, the drainage system leading all the way to the west sand shore has supplied the vast landscape of pond aquaculture (as seen in Figure 1), also the front row of impact-prone areas in the face of rising sea levels attributed to climate change and groundwater overexploitation.
It is also this proximity to water that has led Wenzhai, one of the local communities to take part in the domestic Rural Regeneration Program and the empowerment training from the Council of Agriculture (COA), declaring its Community Manifesto building upon “flood-resistant and elder-friendly local infrastructure and an environmentally-friendly way of life (Soil and Water Conservation Bureau [SWCB], 2018).” As impacts of climate change have struck the local industrial sector with decreasing yields and exacerbated the purchasing mechanism managed by the middlemen in the supply chain, the local stakeholders would like to make a difference by proposing a community-based regeneration plan (2016-2021) with the vision for “green/healthy water, green eating and green living (field notes).” The 5-year plan dives into demonstration project of one particular field of pond aquaculture as the core and venue of resident mobilization: exploring sustainable actions and alternatives to traditional fish farming, seeking to add value to the area’s aquaculture products while addressing the domestic food safety issue at the same time. To that end, practices in ecological pond aquaculture and reducing food miles, considered a potential way to cut the carbon footprint, by providing pond-to-table dining for visitors have joined the picture of local development.
Based on the above open information from the COA, the present article would thus proceed with focusing on this particular site as the targeted field of production here, given its key role in local community and economic development. This work goes on to employ the life cycle perspective underlying the carbon-related discussion based on science, asserting that emission reduction is not a mere slogan but encompasses a systematic set of procedures for sustainable actions to be capable of being measured. And it would only be possible by shifting the focus back to the existing production system operated, could any progress go from there.
Site location and scale information
The targeted aquaculture production site is situated along the Puzih River lowlands in Dongshi Township, purchased and taken over by two of the local stakeholders in the year 2013, only a few years after the local community association was established. The purchase comes with a bungalow, soon serving as the main venue of resident mobilization (to be elaborated in the next paragraph), and the ponds. The total production area at the moment (around 0.57 hectares) comprises two ponds—one for nursery and the other for water storage fed from the nearby irrigation canal 225 meters away through water pump. It goes without saying that the conventional goal of aquaculture production at the maximum yield with as many ponds as possible is not the objective here. The two key actors’ plan is to experiment a model diverged from conventional fish farming in the area so as not to fall for the price competition in the middlemen purchasing game, in the hope of more local pond managers joining forces.
Creating marketing outlets of its own is also part of the plan, working alongside the empowerment of local residents through culinary training at the same time leading to providing new service of on-site pond-to-table dining experience available, the booked fees of which would go back to public funds to keep community affairs rolling. Utilizing knowledge and experience sharing from grassroots training and workshop projects supported/funded by the EPA and COA, the production field here got to know more about greening and ecological model of pond aquaculture through trial and error.
Case-specific production system: The ecological model
By the term ‘ecological,’ the local actors refer to how maintaining the aquaculture ecosystem underwater that “mimics the form and functions of natural ecosystems (Costa-Pierce, 2021)” by polyculture could prove to be the more ideal environment for the cultured species. In this case, the major species items include white shrimp (Litopenaeus vannamei), living in the polyculture system with herbivorous fish, such as milkfish (Chanos chanos) and tilapia (Oreochromis spp.) which would eat plant material instead of the shrimp and co-consume the feed while reducing the amount of leftover feed sinking to the bottom (field notes). Through years of experimenting, a more stable system of ecological model is operated on-site by the following effort and focal points (field notes):
- No harmful chemicals or pharmaceuticals (such as pesticides, antibiotics, etc.) are used, so as to reduce water contamination that may risk long-term human or ecosystem health;
- Upon the first point, additives composed of natural ingredients are used instead, including water quality amendment or probiotics (such as Bacillus natto, Bacterium subtilis, etc.) to help remove sediment organic matter accumulation in the pond often associated with nitrogen, ammonia, and nitrous acid;
- Creating an ecosystem underwater with polyculture in a balanced manner, thereby with less need for water exchange and water consumption, altogether reducing the number and the use of aerators/waterwheels required to provide dissolved oxygen in conventional ponds;
- Reducing stocking density (keeping 40,000 white shrimp per pond whereas the amount of 60,000 is the norm in conventional farming) to support the above management decisions, improving water quality, activity space, and health for the cultured species. The produced yield by manual harvesting could go up to the amount of more than four or five other ponds in the area altogether, depending on the climate conditions;
- Planting trees and letting the grass grow between ponds to mitigate the impact of temperature, create a greener environment on site, and improve air quality as a barrier to harmful airborne particles as well as gaseous pollutants from the nearby counties. As no lawn pesticides are allowed and used here, the maintenance would take more human labor to mow the grass every two weeks; and
- Monitoring the pond water by quality meter daily, keeping records of pH level, water temperature, salinity, dissolved oxygen, nitrous acid, and so on.
The carbon awareness then
Among the above production system details, several decisions can be found related to the discussion of carbon management nowadays, which would be elaborated more in later sections. But to the pond managers here in this case, they did not make any of the above choices for the mere sake of ‘carbon.’ The reason they and other local stakeholders applied for the Low-Carbon Community registration under the EPA in the year 2018 (they did not make it into the final list of demonstration projects nationwide though) turns out to be the same reason they voluntarily went for the ecological pond aquaculture. It all seemed “natural” and “the right thing to do” for them to grasp going ‘low-carbon’ with the existing sustainable community vision eyeing on rural community tourism—a way to bring in the economic, social and environmental benefits altogether revolving around local food promotion and providing pond-to-table dining service.
FROM POND MANAGEMENT TO CLIMATE FRAMEWORK: PRE-DEVELOPMENT OF THE GHG INVENTORY
Undeniably, the main protagonists in this case study—the small-scale producers/business units are not Taiwan’s prioritized wave of targeted groups (which are the sewer-connected enterprises managed by EPA or the listed companies requested by the Financial Supervisory Commission for carbon disclosure/sustainable development routes) at the moment in carbon-related disclosures. The former is assumed to be smaller emitters compared to their enterprise counterparts. But the agenda of co-building sustainable agri-food supply chains has progressed and contributed to various initiatives in many parts of the world, leading to “sustainability agreements between primary producers and other actors in the food value chain aimed at achieving higher sustainability standards than those required by law (European Network for Rural Development [ENRD], 2022).” Unless one could stand on its own all the way from production to retail, the future of climate disclosure requests from acknowledged investors in the supply chain (especially in international trade) to meet their needs for accurate climate information can be foreseen.
The domestic EPA also envisions the above advancement in the industrial sector and launches the latest version of GHG emission inventory guidelines, demonstrating the importance of GHG inventory as the precondition of mandatory and voluntary carbon management, no matter what international standard(s) is/are consulted and chosen in methodology. In fact, the guidelines are claimed to be established based on the ethos of several recommended climate frameworks in themselves (EPA, 2022), including ISO standards and the GHG Protocol which require a third-party audit or verification process. As the domestic guidelines have not yet published templates or inventory examples based specifically on the agricultural sector, the present case study goes on to briefly illustrate what procedures in the preliminary stage are ahead for the case-specific field of aquaculture production, given the local stakeholders are keen on knowing how to go technically low-carbon afterwards.
The proposed boundary in carbon management
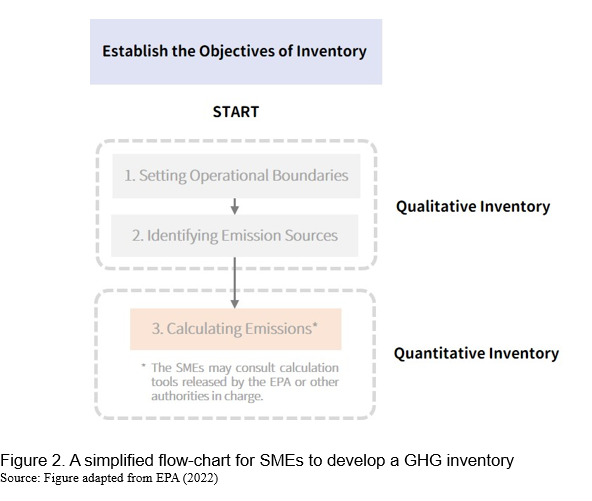
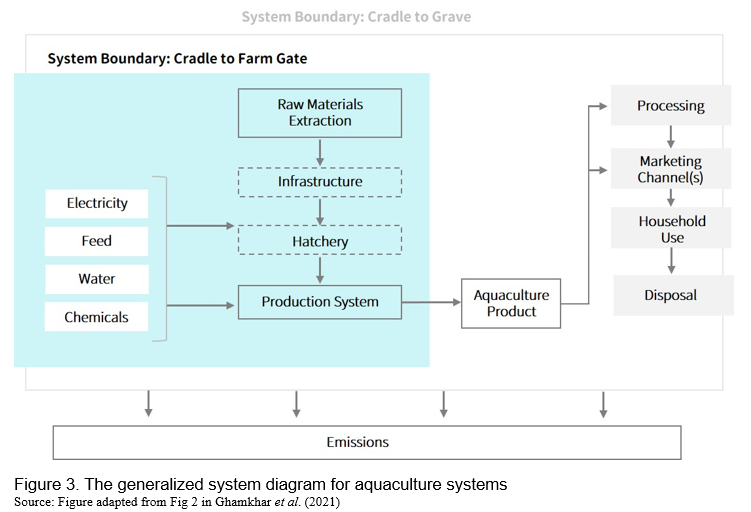
Defining the project boundary always comes first in carbon management, later joined by identifying the emission source(s) as part of the qualitative inventory and emission calculation (quantitative inventory), as EPA (2022) suggests (Figure 2). The COA has defined carbon dioxide emission from agriculture in the press release (Environmental Information Center, 2022) as “the carbon footprint from production to leaving the farm gate [into the transport vehicle],” consistent with the system boundaries of many food product studies (Henriksson, Guinée, Kleijn & Snoo, 2012) that start from cradle and end with farm gate. Therefore, the work here would dwell on operations at the pond/organizational level in the targeted field of production, and refer to the generalized system diagram for aquaculture (Figure 3) from Ghamkhar et al. (2021) with the cradle-to-farm-gate boundary to build the larger picture of emissions from on-site production behavior. What is done (the past activities) in electricity/energy consumption, feed distribution, water consumption, and exchange, as well as chemicals/additives application, etc., and what can be done would be included for further analysis of carbon reduction potential. As this short article aims to provide an overview rather than a comprehensive map of procedures for potential participants in carbon management, the following development trajectory would focus on the qualitative inventory before the quantification stage.
Proposed methodology and overview of the emission sources in the field of production
As recommended by the domestic guidelines for voluntary participants in developing a GHG inventory (EPA, 2022), the proposed methodology used here is GHG Protocol Corporate Accounting and Reporting Standard (‘Corporate Standard’) revised edition (2004) along with its supplement document GHG Protocol Agricultural Guidance (2014) released by the World Resources Institute (WRI) and the World Business Council for Sustainable Development (WBCSD). The latter is so far the first ever global guidance to measure GHG emissions for the agricultural sector.
By first looking into the management practices within the defined cradle-to-gate boundary, the second step for the participating producers/stakeholders would be to identify all the GHG emission sources and related activities. This is the key and case-specific step before selecting a calculation approach (which the present article would not go into), because the actual emissions profile of two farms/ponds even in the same region may very likely deviate from one another. And these identified sources will have to be reflected in the types of activity data later needed. That would be what an ‘inventory’ literally looks like in paperwork—any specifics related to the production system shall be disclosed and justified.
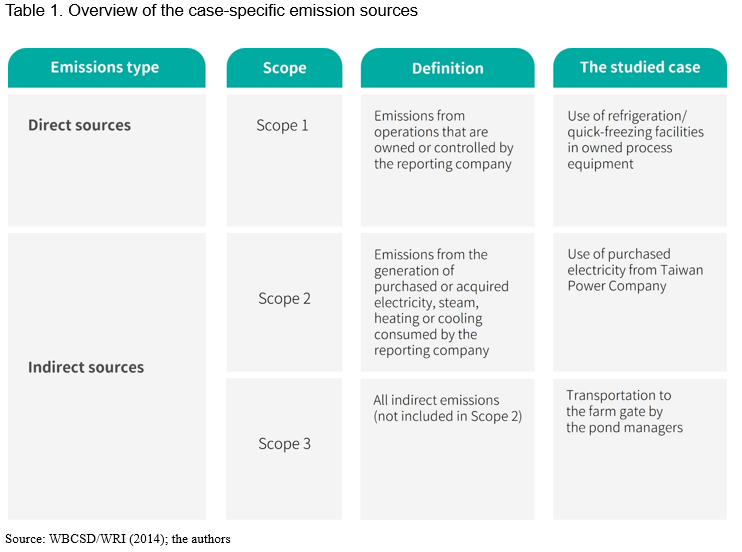
Besides EPA’s basic principle where non-renewable energy consumption increases the level/amount of CO2 emissions, the GHG Protocol Agricultural Guidance further categorizes agricultural emissions sources into (1) mechanical ones and (2) non-mechanical ones, as opposed to the common classification of corporate emission sources in other international standards into Scope 1 (all direct sources), Scope 2 (consumption of purchased heat, steam and electricity as an indirect source), and Scope 3 (all other indirect sources).
In the case discussed here, the production system surrounding the pond does rely on the mechanical equipment, for example, water pumps and aerators/waterwheels to control the water inflow and water quality by the consistent level of dissolved oxygen. The GHG emissions would be determined by the electricity input throughout the year. One specific to be noted is while the processing facilities of equipment for general aquaculture systems tend to be located off-farm in another plant as indicated in Figure 3, the basic refrigeration facilities the white shrimp heading to right after the harvest period are here located on site within the farm gate. So, the emissions of hydrofluorocarbons (HFCs) and perfluorocarbons (PFCs) from the refrigeration equipment should also be included.
The biosystem underneath the water, on the other hand, flows with the non-mechanical sources of carbon dioxide (CO2), methane (CH4) and nitrous oxide (N2O) or precursors of these GHGs theoretically through different routes illustrated as follows, reviewed by Raul, Prakash, Bharti & Krishnan (2020).
- The leftover protein-rich fish feed and fecal matter releasing gas bubbles to the atmosphere during microbial mineralization;
- The bottom sediment where the organic matter (which the pond managers here have meant to cope with by the ecological model using probiotics instead of traditional aquaculture pharmaceuticals, still needs further estimation) resides with methanogenic bacteria activity producing methane gas in anaerobic conditions.
Based on the above profile, Table 1 is listed to demonstrate the case-specific overview of emission sources for the corresponding data collection later.
Collection of on-site activity data
As GHG Protocol reiterates, “an accurate and useful inventory can only be developed after careful attention to quality control issues and to the activity data required (WBCSD/WRI, 2004).” Before heading into the calculation of GHG emissions, activity data can be broken down into activities that generate emissions during the yearly-based production procedures between inputs (raw materials, energy, etc.) and outputs (product yields, co-products, emissions to air, etc.) within the defined boundaries.
This section thereby digs into the case-specific on-site production system details that could be converted into emission data, which ought to be collected with sufficient information. From the life cycle perspective on the general aquaculture systems as Figure 3 suggests, the classification of these processes associated with the activity data within the defined boundary most frequently include energy carriers (i.e., electricity, natural gas, gasoline) or electricity production, water supply, aquafeed, and chemicals/additives (Ghamkhar et al., 2021). The point is that with more details provided, the carbon reduction targets or pathways afterward (elaborated on in the next section) could be more easily identified and take shape.
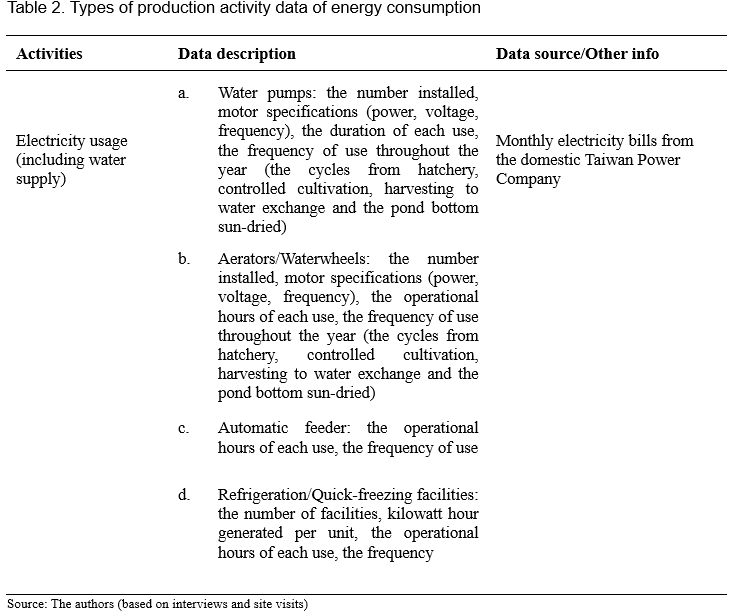
Starting first with on-site electricity/energy use, all the activities associated with production processes using mechanical equipment have to be recorded. An overview of the types of activity data in energy consumption could be found in Table 2, a simplified version based on interview data during site visits.
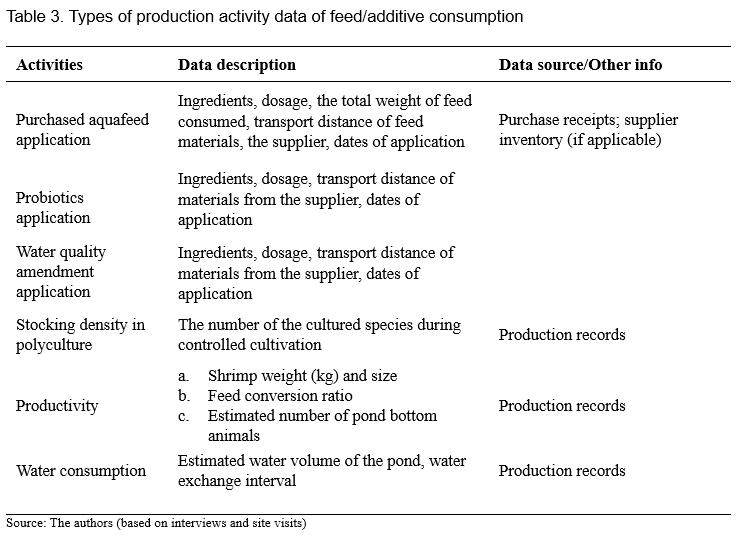
As for feed and chemicals/additives application which involves a number of interacting processes underwater, modeling the flow is required by looking into the activity data surrounding the stocking of the cultured species inside the pond, as seen in Table 3.
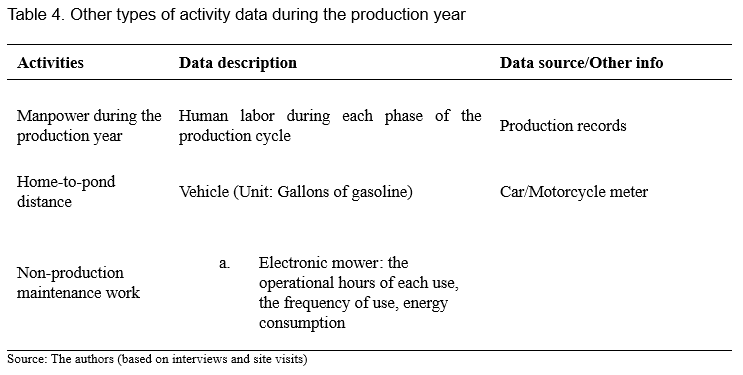
And other details concerning manpower, and transportation to the farm gate by the pond managers (indirect emissions during the production year) shall also be included for consideration, as briefed in Table 4.
In short, upon the above data classification, it would be most ideal for the local stakeholders who are willing to participate or going to participate in developing their GHG inventories, to keep as complete and accurate records as possible—especially in relation to each production unit for each production cycle. A sense of traceability can be found in the sampled forms listed above. So, if possible, the pond/farm shall operate an effective record-keeping system that provides timely, organized, accurate entries; an online traceability system or an in-house database consisting of paper records, documents, forms, notebooks, files, or any combination thereof may be the go-to tools. In case of missing documents on-site, such as how a sudden flood event had ruined the collection of past receipts (electricity bills, feed purchase, etc.) in the studied case here, other alternative sources of purchased service/goods suppliers could also be consulted.
THE NEXT STEP(S) AHEAD
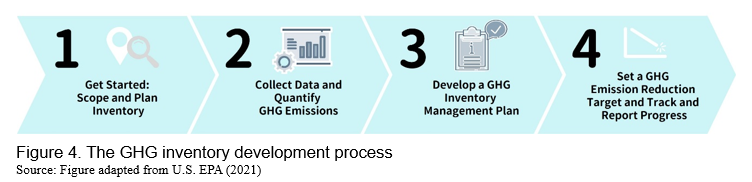
The earlier sections have reviewed the potential emission sources and the associated activities on site in the specific field of aquaculture production, where the electricity consumption seems to outweigh the use of gasoline (only embodied in indirect emissions associated with vehicles for the purchased goods) during the year-round production. As for how the pre-development of GHG inventory stated earlier gets to work with the objective of carbon reduction per se, the present work consults the inventory guidance aligned with the methodology used here (GHG Protocol Corporate Standard) by the United States Environmental Protection Agency (U.S. EPA) for a clear vision—pointing to the management plan (see Figure 4) for the field of production, followed by setting the reduction target(s), tracking and progress reporting.
After defining the inventory boundaries and identifying GHG emission sources, the next step(s) ahead is based on the foundational guidance from the GHG Protocol on GHG accounting principles (the ethos similar to financial accounting and reporting, to ensure the reported information represents a faithful, true, and fair account of a company’s GHG emissions) would be defining/adjusting an inventory base year, and tracking emissions over time.
Proposal: Setting the base year and the initial target(s)
During the authors’ site visits, the local stakeholders in this targeted field have expressed their interest in participating in another pilot project of installing grid-tied solar systems on the kitchen roof on site in FY 2023 or later (field notes) to be more self-sufficient in energy supply. The potential project also makes this point an ideal time to consider initiating an emission reduction plan from now on spanning three years for a start. After all, as far as the idea of a ‘pathway’ goes in carbon reduction pathway, it is not an instant fix but a “transformational process that delivers long-term emissions reductions and sustainable development in collaboration with local communities, businesses and other key actors (Climate Group, 2021).”
Such plan could build on the base year of 2021, by gathering data as sufficient as possible on the year-round production processes as listed in previous sections. Then the first intervention project in FY 2022 may come into the picture as the initial target: starting with investing in the more energy-efficient mechanical equipment that is indispensable but replaceable at an affordable cost—the water pumps and the fundamental aeration system. While the retrofit with DC direct drive inverter aerators can save more energy than conventional ones, it would require tracking of the activity data along with the corresponding emission calculation following the intervention, to be compared with the amount of GHG emissions calculated from the base year. Only until this point can the field of production here literally and technically steps on its carbon reduction pathway.
Planning of on-site energy generation: Solar energy project(s)
Upon the effort into reducing energy consumption proposed above, by the time of FY 2023 or later the local actors could decide whether to proceed with the new intervention project of solar panels as scheduled or not. If yes, the impact of such energy generation project on the field’s GHG inventory would depend on whether any of the energy that is generated is consumed on-site or sent to the grid. If the energy is consumed on-site, the project may reduce the amount of electricity consumed, pointing to a reduction in Scope 1 or Scope 2 emissions to be compared with the data history over time (WBCSD/WRI, 2014).
It should again be pointed out that whether this proposed transition roadmap would take shape is still in the hands of the local stakeholders to decide. Nevertheless, it highlights the aim of this article—that is, to illustrate how carbon reduction shall start with taking steps to review, collect, target, track and report progress. And the above trajectory shall contribute to drafting a new story in rural regeneration and sustainable community development actions.
DISCUSSION: LOCAL NEEDS AND FORTHCOMING CHALLENGES
Knowledge gaps regarding ‘carbon reduction’
Here in the studied case scenario, ‘low-carbon tourism’ and ‘low-carbon dining’ appear to be concepts the local stakeholders first identify within the ongoing process of sustainable rural community development. By sharing meals all made of locally-grown and locally-cooked food, they meant to provide a food choice and a place-based experience in the qualitative sense, instead of the quantitative sense of technically counting its carbon impact/footprint. Therefore, shifting the local mindset back to improving the production behavior from the roots (or in this particular case, from the pond) of decision-making would be the first task of stakeholder communication. And upon that, knowledge translation of science-based carbon calculation involving on-site document handling and data collecting would come second. Whether the local producers would proceed to the verification of GHG inventory by third-party experts in the future or not, estimation of GHG emissions would not be possible or accurate without sufficient on-site production-related records—however “trivial” or “messy” they might seem.
Cross-ministry resource and information sharing
As EPA is the authority responsible for all GHG emissions in Taiwan for almost two decades since the drafting of Greenhouse Gas Reduction and Management Act (later promulgated in FY 2015), the clear carbon reduction goal from the agricultural sector is a much younger pledge from the COA. While the current domestic GHG emission inventory guidelines released by EPA have not yet incorporated the agricultural-production-oriented information into the demonstration materials, developing agricultural guidance through cross-ministry cooperation as a supplement to the former could directly fill the void. Such joint effort would clarify how specific agricultural subsectors may apply the carbon-related concepts, making it much easier for grassroots stakeholders to grasp and follow. As introduced earlier in this case, both agencies have already launched programs promoting joint action at the community level respectively, such as the Low-Carbon Community registration under EPA and Rural Regeneration Program under COA. The concentration of resources into knowledge translation to support more research-based or project-based carbon-reduction efforts (say, community retrofitting with energy-saving facilities) would be a good starting point for future endeavors to address this emerging issue of going technically low-carbon.
Transformative capacities requiring more participants at local level
Indeed, the agricultural land across Taiwan, up to 800,000 hectares, has been considered one of the invaluable assets for the potential contribution of carbon reduction from the agricultural sector. But the fact that the average size of farming land in Taiwan per farm household is around 0.72 hectares cannot be put aside. How to mobilize more voluntary local stakeholders toward this emerging sustainability transition and steer clear from the burden of preparing and managing the ‘messy’ production records for the GHG inventory development process is another piece of work. Instead of inventing “yet another new tool (field notes)” for the producers to learn, the more efficient way may be to utilize and optimize the existing system in practice for data collection, such as the Traceable Agricultural Products or the Taiwan Seafood Production Traceability System that already handle the applicants’ production details. Group training and vision developing through regional farmers’ associations or co-ops are ideal ways to build the local capacities.
CONCLUSION: PUBLIC AND PRIVATE SECTORS ALL IN THIS TOGETHER
Returning to the title of this article: are the small-scale producers too small to make a difference in carbon reduction? No matter how small the tone of CO2 equivalent reduced from their production process might be if compared to the larger enterprises or listed companies, it is still the farming communities that bear the impact of climate crisis directly on the front line, making them the more vulnerable subjects in the sustainability transition. That is why the calling for a ‘Just Rural Transition’ initiative has taken place in many countries already, meant to improve the farmers' livelihoods as key actors in the sustainable food supply chains by catalyzing investment partnerships (Just Rural Transition [JRT], 2021).
In the above sense, forging investment partnerships may be where the voluntary pro-environmental actions by small-scale producers (such as the case in this article) meet the mandatory ESG disclosures and reporting in the middle. That is, a public company required by the authorities to disclose climate-related financial data and GHG emissions insights could help safeguard the environment and support the agri-food system by investing in improving the production model of small-scale producers towards a lower-carbon one. Such investment opportunities would provide incentives and rewards for the participating stakeholders both ways. How to mobilize the corporate stakeholders and design the partnership mechanism would then rely on the joint effort by the EPA and COA in the near future as the decarbonization scheme in Taiwan evolves.
REFERENCES
Costa-Pierce, B.A. (2021). The principles and practices of ecological aquaculture and the ecosystem approach to aquaculture. World Aquaculture 52(1):25-31. Retrieved from https://www.researchgate.net/publication/352707962_The_Principles_and_Pr...
Environmental Information Center. (2022). Carbon neutrality in the agricultural sector by 2040. Retrieved from https://e-info.org.tw/node/233339
Environmental Protection Administration, Executive Yuan, Taiwan. (2022). GHG emission inventory guidelines. Retrieved from https://enews.epa.gov.tw/DisplayFile.aspx?FileID=9EBF0CDE110A6EC6
European Network for Rural Development. (2022). Sustainability Agreements in the agri-food supply chain. Retrieved from https://enrd.ec.europa.eu/sustainability-agreements-agri-food-supply-cha...
Ghamkhar, R., Boxman, S.E., Main, K.L., Zhang, Q., Trotz, M.A., & Hicks, A. (2021). Life cycle assessment of aquaculture systems: Does burden shifting occur with an increase in production intensity? Aquacultural Engineering, 92. Retrieved from https://www.sciencedirect.com/science/article/abs/pii/S014486092030176X
Henriksson, P.J., Guinée, J.B., Kleijn, R., de Snoo, G.R. (2012). Life cycle assessment of aquaculture systems—a review of methodologies. The International Journal of Life Cycle Assessment, 17. Pp.304-313.
Just Rural Transition. (2021). Investment Partnerships. Retrieved from https://justruraltransition.org/investment-partnership-network/
Long, T.B., Blok, V., & Coninx, I. (2015). Barriers to the adoption and diffusion of technological innovations for climate-smart agriculture in Europe: evidence from the Netherlands, France, Switzerland and Italy. Journal of Cleaner Production, 112(1). Retrieved from http://dx.doi.org/10.1016/j.jclepro.2015.06.044
Raul, C., Prakash, S., Bharti, V.S., & Krishnan, S. (2020). GHGs emission from Aquaculture systems. Journal of the World Aquaculture Society. Retrieved from
https://www.researchgate.net/publication/344807131_GHGs_emission_from_Aq...
Soil and Water Conservation Bureau of Council of Agriculture, Executive Yuan, Taiwan. (2018). Rural Regeneration Development Platform. Retrieved from https://ep.swcb.gov.tw/EP/Default.aspx
The Climate Group. (2021). Decarbonisation pathways. Retrieved from https://www.theclimategroup.org/decarbonisation-pathways
The Council of Agriculture, Executive Yuan, Taiwan. (2021). COA Overview. Retrieved from https://eng.coa.gov.tw/ws.php?id=9501
Tseng, P.T. (2021). Vanished Hâ-pau-sū Lake: Water Governance and Commercial Management of Lakes on Jianan Plain (1640s-1910s). Taiwan Historical Research, 28 (1), Pp. 1-42.
United States Environmental Protection Agency. (2021). GHG Inventory Development Process and Guidance. Retrieved from https://www.epa.gov/climateleadership/ghg-inventory-development-process-...
WBCSD/WRI. (2004). Greenhouse Gas Protocol: A Corporate Accounting and Reporting Standard. Retrieved from https://ghgprotocol.org/sites/default/files/standards/ghg-protocol-revis...
WBCSD/WRI. (2014). GHG Protocol Agricultural Guidance. Retrieved from https://ghgprotocol.org/agriculture-guidance


Too Small to Make a Difference? Low-Carbon Community and beyond for Smallholder Farmers behind Grassroots Aquaculture Initiatives in Southwestern Taiwan
ABSTRACT
For the small-scale producers in Dongshi Township, where rural villages mainly rely on aquaculture dispersed between Dongshi Fisherman's Wharf and river lowlands in Southwestern Taiwan, climate change is real and hits home: the rising sea level, the severer soil salinization unfavorable for agricultural production, as well as the unexpected flood and drought events. Within such a vast lowland area stands the only, so far, low-carbon community in the Township verified by the Environmental Protection Administration (EPA), for experimenting the local agri-food system by rural community tourism, ecological pond aquaculture, and farm/pond-to-table dining experience—even years before ‘carbon emission reduction’ and ‘net-zero carbon emissions’ become the buzzwords in Taiwan’s agricultural policy discourse. The heated discussion around the current carbon reduction policy approaches in the domestic agricultural sector, however, tends to revolve around the business decisions—mostly corporate-based—and how they can contribute to reaching the national goals by 2040 and 2050. Considering the average size of farming land in Taiwan per farm household is around 0.72 hectares, according to the Council of Agriculture (2021), how the majority of small-scale producers could act on this emerging policy scheme seems to be absent from the public discussion. The present article sets out with a case study of the aforementioned field of aquaculture production from the converging perspectives of sustainable rural community development, climate frameworks, and sustainability transitions to illustrate: (1) how the local stakeholders voluntarily turn to the low-carbon approach, (2) the local needs and forthcoming challenges, (3) the connotations of going ‘low-carbon’ and how to do it right in the logic of science-based carbon management/calculation behind the latest carbon reduction policy.
Keywords: small-scale producers, low-carbon, ecological pond aquaculture, carbon management
INTRODUCTION
From the Kyoto Protocol (1997) to the Paris Agreement (2015) and the FY2021 26th United Nations Climate Change Conference of the Parties (COP26), pursuing the reduction of greenhouse gas (GHG) emissions has become not just a responsibility issue shared by all but a global arena calling for participation and voluntary disclosure. The policy framework based on the objective of carbon neutrality or Net Zero has not been confined to the early circle of countries/regions while many rising ones aim to follow suit, including Taiwan declaring its roadmap by 2050 and specifically pointing to the planned contribution of the agricultural sector.
Much discussion around the above policy framework tends to fall upon how to achieve the pledge, highlighting the future carbon trading system that may mean benefits for the investors, and the top charts of enterprises employing ESG (environmental, social, and governance) strategy to do so. The thing is: the pledge at the national level is one thing, and how to implement the transition at the local level is another. It is not until May 2022 that an updated domestic version of GHG emission inventory guidelines (Environmental Protection Administration [EPA], 2022) gets to be published allowing small and medium-sized enterprises (SMEs) to follow, still confined to the manufacturing and service sectors though. This concept of carbon management is not new, but the logic of science-based calculation behind it may be pretty new to the general producers in the agricultural sector. As any transition takes time and communication, not to mention potential barriers that may prevent the adoption of technological innovations in the face of climate change (Long, Blok & Coninx, 2016), the motive and practical steps taken behind this are yet to be addressed.
Before going into reducing the carbon emissions, how to help identify them shall be the preliminary fundamental work. The present article illustrates the attempts of grassroots stakeholders/producers to keep experimenting with a more sustainable approach both in ecological pond aquaculture and rural community development, and how they may respond to the latest carbon reduction policy framework. The findings and analytical sections here are derived from long-term companionship in a particular rural village noted as the lowest lowland area in Chiayi County, Southwestern Taiwan, with assistance from the second author specialized in carbon neutral certification schemes (including but not confined to ISO 14064-1:2018, ISO 14067:2018 and PAS2060). How to progress from a low-carbon community to literally fostering low-carbon local economy, the preliminary stage demonstrated here would point to more preparation and action than words, more motivating factors than abstract propaganda, and more down-to-earth communication. While many reports/studies on climate change, agriculture, and food security have drawn upon soil organic carbon (SOC) content and the related crops in the sense of carbon management, this case study would contribute to the existing literature with practices of a different scenario in pond aquaculture, hopefully to be followed by more future cases to come.
CASE SCENARIO OVERVIEW
The water-centric community
Water is the essential backdrop of the modern-day Dongshi Township. Its dwelling history dates back to more than three hundred years ago, when the villages “were surrounded by water on all sides adjacent to pieces of fields (Tseng, 2021).” To this day, the drainage system leading all the way to the west sand shore has supplied the vast landscape of pond aquaculture (as seen in Figure 1), also the front row of impact-prone areas in the face of rising sea levels attributed to climate change and groundwater overexploitation.
It is also this proximity to water that has led Wenzhai, one of the local communities to take part in the domestic Rural Regeneration Program and the empowerment training from the Council of Agriculture (COA), declaring its Community Manifesto building upon “flood-resistant and elder-friendly local infrastructure and an environmentally-friendly way of life (Soil and Water Conservation Bureau [SWCB], 2018).” As impacts of climate change have struck the local industrial sector with decreasing yields and exacerbated the purchasing mechanism managed by the middlemen in the supply chain, the local stakeholders would like to make a difference by proposing a community-based regeneration plan (2016-2021) with the vision for “green/healthy water, green eating and green living (field notes).” The 5-year plan dives into demonstration project of one particular field of pond aquaculture as the core and venue of resident mobilization: exploring sustainable actions and alternatives to traditional fish farming, seeking to add value to the area’s aquaculture products while addressing the domestic food safety issue at the same time. To that end, practices in ecological pond aquaculture and reducing food miles, considered a potential way to cut the carbon footprint, by providing pond-to-table dining for visitors have joined the picture of local development.
Based on the above open information from the COA, the present article would thus proceed with focusing on this particular site as the targeted field of production here, given its key role in local community and economic development. This work goes on to employ the life cycle perspective underlying the carbon-related discussion based on science, asserting that emission reduction is not a mere slogan but encompasses a systematic set of procedures for sustainable actions to be capable of being measured. And it would only be possible by shifting the focus back to the existing production system operated, could any progress go from there.
Site location and scale information
The targeted aquaculture production site is situated along the Puzih River lowlands in Dongshi Township, purchased and taken over by two of the local stakeholders in the year 2013, only a few years after the local community association was established. The purchase comes with a bungalow, soon serving as the main venue of resident mobilization (to be elaborated in the next paragraph), and the ponds. The total production area at the moment (around 0.57 hectares) comprises two ponds—one for nursery and the other for water storage fed from the nearby irrigation canal 225 meters away through water pump. It goes without saying that the conventional goal of aquaculture production at the maximum yield with as many ponds as possible is not the objective here. The two key actors’ plan is to experiment a model diverged from conventional fish farming in the area so as not to fall for the price competition in the middlemen purchasing game, in the hope of more local pond managers joining forces.
Creating marketing outlets of its own is also part of the plan, working alongside the empowerment of local residents through culinary training at the same time leading to providing new service of on-site pond-to-table dining experience available, the booked fees of which would go back to public funds to keep community affairs rolling. Utilizing knowledge and experience sharing from grassroots training and workshop projects supported/funded by the EPA and COA, the production field here got to know more about greening and ecological model of pond aquaculture through trial and error.
Case-specific production system: The ecological model
By the term ‘ecological,’ the local actors refer to how maintaining the aquaculture ecosystem underwater that “mimics the form and functions of natural ecosystems (Costa-Pierce, 2021)” by polyculture could prove to be the more ideal environment for the cultured species. In this case, the major species items include white shrimp (Litopenaeus vannamei), living in the polyculture system with herbivorous fish, such as milkfish (Chanos chanos) and tilapia (Oreochromis spp.) which would eat plant material instead of the shrimp and co-consume the feed while reducing the amount of leftover feed sinking to the bottom (field notes). Through years of experimenting, a more stable system of ecological model is operated on-site by the following effort and focal points (field notes):
The carbon awareness then
Among the above production system details, several decisions can be found related to the discussion of carbon management nowadays, which would be elaborated more in later sections. But to the pond managers here in this case, they did not make any of the above choices for the mere sake of ‘carbon.’ The reason they and other local stakeholders applied for the Low-Carbon Community registration under the EPA in the year 2018 (they did not make it into the final list of demonstration projects nationwide though) turns out to be the same reason they voluntarily went for the ecological pond aquaculture. It all seemed “natural” and “the right thing to do” for them to grasp going ‘low-carbon’ with the existing sustainable community vision eyeing on rural community tourism—a way to bring in the economic, social and environmental benefits altogether revolving around local food promotion and providing pond-to-table dining service.
FROM POND MANAGEMENT TO CLIMATE FRAMEWORK: PRE-DEVELOPMENT OF THE GHG INVENTORY
Undeniably, the main protagonists in this case study—the small-scale producers/business units are not Taiwan’s prioritized wave of targeted groups (which are the sewer-connected enterprises managed by EPA or the listed companies requested by the Financial Supervisory Commission for carbon disclosure/sustainable development routes) at the moment in carbon-related disclosures. The former is assumed to be smaller emitters compared to their enterprise counterparts. But the agenda of co-building sustainable agri-food supply chains has progressed and contributed to various initiatives in many parts of the world, leading to “sustainability agreements between primary producers and other actors in the food value chain aimed at achieving higher sustainability standards than those required by law (European Network for Rural Development [ENRD], 2022).” Unless one could stand on its own all the way from production to retail, the future of climate disclosure requests from acknowledged investors in the supply chain (especially in international trade) to meet their needs for accurate climate information can be foreseen.
The domestic EPA also envisions the above advancement in the industrial sector and launches the latest version of GHG emission inventory guidelines, demonstrating the importance of GHG inventory as the precondition of mandatory and voluntary carbon management, no matter what international standard(s) is/are consulted and chosen in methodology. In fact, the guidelines are claimed to be established based on the ethos of several recommended climate frameworks in themselves (EPA, 2022), including ISO standards and the GHG Protocol which require a third-party audit or verification process. As the domestic guidelines have not yet published templates or inventory examples based specifically on the agricultural sector, the present case study goes on to briefly illustrate what procedures in the preliminary stage are ahead for the case-specific field of aquaculture production, given the local stakeholders are keen on knowing how to go technically low-carbon afterwards.
The proposed boundary in carbon management
Defining the project boundary always comes first in carbon management, later joined by identifying the emission source(s) as part of the qualitative inventory and emission calculation (quantitative inventory), as EPA (2022) suggests (Figure 2). The COA has defined carbon dioxide emission from agriculture in the press release (Environmental Information Center, 2022) as “the carbon footprint from production to leaving the farm gate [into the transport vehicle],” consistent with the system boundaries of many food product studies (Henriksson, Guinée, Kleijn & Snoo, 2012) that start from cradle and end with farm gate. Therefore, the work here would dwell on operations at the pond/organizational level in the targeted field of production, and refer to the generalized system diagram for aquaculture (Figure 3) from Ghamkhar et al. (2021) with the cradle-to-farm-gate boundary to build the larger picture of emissions from on-site production behavior. What is done (the past activities) in electricity/energy consumption, feed distribution, water consumption, and exchange, as well as chemicals/additives application, etc., and what can be done would be included for further analysis of carbon reduction potential. As this short article aims to provide an overview rather than a comprehensive map of procedures for potential participants in carbon management, the following development trajectory would focus on the qualitative inventory before the quantification stage.
Proposed methodology and overview of the emission sources in the field of production
As recommended by the domestic guidelines for voluntary participants in developing a GHG inventory (EPA, 2022), the proposed methodology used here is GHG Protocol Corporate Accounting and Reporting Standard (‘Corporate Standard’) revised edition (2004) along with its supplement document GHG Protocol Agricultural Guidance (2014) released by the World Resources Institute (WRI) and the World Business Council for Sustainable Development (WBCSD). The latter is so far the first ever global guidance to measure GHG emissions for the agricultural sector.
By first looking into the management practices within the defined cradle-to-gate boundary, the second step for the participating producers/stakeholders would be to identify all the GHG emission sources and related activities. This is the key and case-specific step before selecting a calculation approach (which the present article would not go into), because the actual emissions profile of two farms/ponds even in the same region may very likely deviate from one another. And these identified sources will have to be reflected in the types of activity data later needed. That would be what an ‘inventory’ literally looks like in paperwork—any specifics related to the production system shall be disclosed and justified.
Besides EPA’s basic principle where non-renewable energy consumption increases the level/amount of CO2 emissions, the GHG Protocol Agricultural Guidance further categorizes agricultural emissions sources into (1) mechanical ones and (2) non-mechanical ones, as opposed to the common classification of corporate emission sources in other international standards into Scope 1 (all direct sources), Scope 2 (consumption of purchased heat, steam and electricity as an indirect source), and Scope 3 (all other indirect sources).
In the case discussed here, the production system surrounding the pond does rely on the mechanical equipment, for example, water pumps and aerators/waterwheels to control the water inflow and water quality by the consistent level of dissolved oxygen. The GHG emissions would be determined by the electricity input throughout the year. One specific to be noted is while the processing facilities of equipment for general aquaculture systems tend to be located off-farm in another plant as indicated in Figure 3, the basic refrigeration facilities the white shrimp heading to right after the harvest period are here located on site within the farm gate. So, the emissions of hydrofluorocarbons (HFCs) and perfluorocarbons (PFCs) from the refrigeration equipment should also be included.
The biosystem underneath the water, on the other hand, flows with the non-mechanical sources of carbon dioxide (CO2), methane (CH4) and nitrous oxide (N2O) or precursors of these GHGs theoretically through different routes illustrated as follows, reviewed by Raul, Prakash, Bharti & Krishnan (2020).
Based on the above profile, Table 1 is listed to demonstrate the case-specific overview of emission sources for the corresponding data collection later.
Collection of on-site activity data
As GHG Protocol reiterates, “an accurate and useful inventory can only be developed after careful attention to quality control issues and to the activity data required (WBCSD/WRI, 2004).” Before heading into the calculation of GHG emissions, activity data can be broken down into activities that generate emissions during the yearly-based production procedures between inputs (raw materials, energy, etc.) and outputs (product yields, co-products, emissions to air, etc.) within the defined boundaries.
This section thereby digs into the case-specific on-site production system details that could be converted into emission data, which ought to be collected with sufficient information. From the life cycle perspective on the general aquaculture systems as Figure 3 suggests, the classification of these processes associated with the activity data within the defined boundary most frequently include energy carriers (i.e., electricity, natural gas, gasoline) or electricity production, water supply, aquafeed, and chemicals/additives (Ghamkhar et al., 2021). The point is that with more details provided, the carbon reduction targets or pathways afterward (elaborated on in the next section) could be more easily identified and take shape.
Starting first with on-site electricity/energy use, all the activities associated with production processes using mechanical equipment have to be recorded. An overview of the types of activity data in energy consumption could be found in Table 2, a simplified version based on interview data during site visits.
As for feed and chemicals/additives application which involves a number of interacting processes underwater, modeling the flow is required by looking into the activity data surrounding the stocking of the cultured species inside the pond, as seen in Table 3.
And other details concerning manpower, and transportation to the farm gate by the pond managers (indirect emissions during the production year) shall also be included for consideration, as briefed in Table 4.
In short, upon the above data classification, it would be most ideal for the local stakeholders who are willing to participate or going to participate in developing their GHG inventories, to keep as complete and accurate records as possible—especially in relation to each production unit for each production cycle. A sense of traceability can be found in the sampled forms listed above. So, if possible, the pond/farm shall operate an effective record-keeping system that provides timely, organized, accurate entries; an online traceability system or an in-house database consisting of paper records, documents, forms, notebooks, files, or any combination thereof may be the go-to tools. In case of missing documents on-site, such as how a sudden flood event had ruined the collection of past receipts (electricity bills, feed purchase, etc.) in the studied case here, other alternative sources of purchased service/goods suppliers could also be consulted.
THE NEXT STEP(S) AHEAD
The earlier sections have reviewed the potential emission sources and the associated activities on site in the specific field of aquaculture production, where the electricity consumption seems to outweigh the use of gasoline (only embodied in indirect emissions associated with vehicles for the purchased goods) during the year-round production. As for how the pre-development of GHG inventory stated earlier gets to work with the objective of carbon reduction per se, the present work consults the inventory guidance aligned with the methodology used here (GHG Protocol Corporate Standard) by the United States Environmental Protection Agency (U.S. EPA) for a clear vision—pointing to the management plan (see Figure 4) for the field of production, followed by setting the reduction target(s), tracking and progress reporting.
After defining the inventory boundaries and identifying GHG emission sources, the next step(s) ahead is based on the foundational guidance from the GHG Protocol on GHG accounting principles (the ethos similar to financial accounting and reporting, to ensure the reported information represents a faithful, true, and fair account of a company’s GHG emissions) would be defining/adjusting an inventory base year, and tracking emissions over time.
Proposal: Setting the base year and the initial target(s)
During the authors’ site visits, the local stakeholders in this targeted field have expressed their interest in participating in another pilot project of installing grid-tied solar systems on the kitchen roof on site in FY 2023 or later (field notes) to be more self-sufficient in energy supply. The potential project also makes this point an ideal time to consider initiating an emission reduction plan from now on spanning three years for a start. After all, as far as the idea of a ‘pathway’ goes in carbon reduction pathway, it is not an instant fix but a “transformational process that delivers long-term emissions reductions and sustainable development in collaboration with local communities, businesses and other key actors (Climate Group, 2021).”
Such plan could build on the base year of 2021, by gathering data as sufficient as possible on the year-round production processes as listed in previous sections. Then the first intervention project in FY 2022 may come into the picture as the initial target: starting with investing in the more energy-efficient mechanical equipment that is indispensable but replaceable at an affordable cost—the water pumps and the fundamental aeration system. While the retrofit with DC direct drive inverter aerators can save more energy than conventional ones, it would require tracking of the activity data along with the corresponding emission calculation following the intervention, to be compared with the amount of GHG emissions calculated from the base year. Only until this point can the field of production here literally and technically steps on its carbon reduction pathway.
Planning of on-site energy generation: Solar energy project(s)
Upon the effort into reducing energy consumption proposed above, by the time of FY 2023 or later the local actors could decide whether to proceed with the new intervention project of solar panels as scheduled or not. If yes, the impact of such energy generation project on the field’s GHG inventory would depend on whether any of the energy that is generated is consumed on-site or sent to the grid. If the energy is consumed on-site, the project may reduce the amount of electricity consumed, pointing to a reduction in Scope 1 or Scope 2 emissions to be compared with the data history over time (WBCSD/WRI, 2014).
It should again be pointed out that whether this proposed transition roadmap would take shape is still in the hands of the local stakeholders to decide. Nevertheless, it highlights the aim of this article—that is, to illustrate how carbon reduction shall start with taking steps to review, collect, target, track and report progress. And the above trajectory shall contribute to drafting a new story in rural regeneration and sustainable community development actions.
DISCUSSION: LOCAL NEEDS AND FORTHCOMING CHALLENGES
Knowledge gaps regarding ‘carbon reduction’
Here in the studied case scenario, ‘low-carbon tourism’ and ‘low-carbon dining’ appear to be concepts the local stakeholders first identify within the ongoing process of sustainable rural community development. By sharing meals all made of locally-grown and locally-cooked food, they meant to provide a food choice and a place-based experience in the qualitative sense, instead of the quantitative sense of technically counting its carbon impact/footprint. Therefore, shifting the local mindset back to improving the production behavior from the roots (or in this particular case, from the pond) of decision-making would be the first task of stakeholder communication. And upon that, knowledge translation of science-based carbon calculation involving on-site document handling and data collecting would come second. Whether the local producers would proceed to the verification of GHG inventory by third-party experts in the future or not, estimation of GHG emissions would not be possible or accurate without sufficient on-site production-related records—however “trivial” or “messy” they might seem.
Cross-ministry resource and information sharing
As EPA is the authority responsible for all GHG emissions in Taiwan for almost two decades since the drafting of Greenhouse Gas Reduction and Management Act (later promulgated in FY 2015), the clear carbon reduction goal from the agricultural sector is a much younger pledge from the COA. While the current domestic GHG emission inventory guidelines released by EPA have not yet incorporated the agricultural-production-oriented information into the demonstration materials, developing agricultural guidance through cross-ministry cooperation as a supplement to the former could directly fill the void. Such joint effort would clarify how specific agricultural subsectors may apply the carbon-related concepts, making it much easier for grassroots stakeholders to grasp and follow. As introduced earlier in this case, both agencies have already launched programs promoting joint action at the community level respectively, such as the Low-Carbon Community registration under EPA and Rural Regeneration Program under COA. The concentration of resources into knowledge translation to support more research-based or project-based carbon-reduction efforts (say, community retrofitting with energy-saving facilities) would be a good starting point for future endeavors to address this emerging issue of going technically low-carbon.
Transformative capacities requiring more participants at local level
Indeed, the agricultural land across Taiwan, up to 800,000 hectares, has been considered one of the invaluable assets for the potential contribution of carbon reduction from the agricultural sector. But the fact that the average size of farming land in Taiwan per farm household is around 0.72 hectares cannot be put aside. How to mobilize more voluntary local stakeholders toward this emerging sustainability transition and steer clear from the burden of preparing and managing the ‘messy’ production records for the GHG inventory development process is another piece of work. Instead of inventing “yet another new tool (field notes)” for the producers to learn, the more efficient way may be to utilize and optimize the existing system in practice for data collection, such as the Traceable Agricultural Products or the Taiwan Seafood Production Traceability System that already handle the applicants’ production details. Group training and vision developing through regional farmers’ associations or co-ops are ideal ways to build the local capacities.
CONCLUSION: PUBLIC AND PRIVATE SECTORS ALL IN THIS TOGETHER
Returning to the title of this article: are the small-scale producers too small to make a difference in carbon reduction? No matter how small the tone of CO2 equivalent reduced from their production process might be if compared to the larger enterprises or listed companies, it is still the farming communities that bear the impact of climate crisis directly on the front line, making them the more vulnerable subjects in the sustainability transition. That is why the calling for a ‘Just Rural Transition’ initiative has taken place in many countries already, meant to improve the farmers' livelihoods as key actors in the sustainable food supply chains by catalyzing investment partnerships (Just Rural Transition [JRT], 2021).
In the above sense, forging investment partnerships may be where the voluntary pro-environmental actions by small-scale producers (such as the case in this article) meet the mandatory ESG disclosures and reporting in the middle. That is, a public company required by the authorities to disclose climate-related financial data and GHG emissions insights could help safeguard the environment and support the agri-food system by investing in improving the production model of small-scale producers towards a lower-carbon one. Such investment opportunities would provide incentives and rewards for the participating stakeholders both ways. How to mobilize the corporate stakeholders and design the partnership mechanism would then rely on the joint effort by the EPA and COA in the near future as the decarbonization scheme in Taiwan evolves.
REFERENCES
Costa-Pierce, B.A. (2021). The principles and practices of ecological aquaculture and the ecosystem approach to aquaculture. World Aquaculture 52(1):25-31. Retrieved from https://www.researchgate.net/publication/352707962_The_Principles_and_Pr...
Environmental Information Center. (2022). Carbon neutrality in the agricultural sector by 2040. Retrieved from https://e-info.org.tw/node/233339
Environmental Protection Administration, Executive Yuan, Taiwan. (2022). GHG emission inventory guidelines. Retrieved from https://enews.epa.gov.tw/DisplayFile.aspx?FileID=9EBF0CDE110A6EC6
European Network for Rural Development. (2022). Sustainability Agreements in the agri-food supply chain. Retrieved from https://enrd.ec.europa.eu/sustainability-agreements-agri-food-supply-cha...
Ghamkhar, R., Boxman, S.E., Main, K.L., Zhang, Q., Trotz, M.A., & Hicks, A. (2021). Life cycle assessment of aquaculture systems: Does burden shifting occur with an increase in production intensity? Aquacultural Engineering, 92. Retrieved from https://www.sciencedirect.com/science/article/abs/pii/S014486092030176X
Henriksson, P.J., Guinée, J.B., Kleijn, R., de Snoo, G.R. (2012). Life cycle assessment of aquaculture systems—a review of methodologies. The International Journal of Life Cycle Assessment, 17. Pp.304-313.
Just Rural Transition. (2021). Investment Partnerships. Retrieved from https://justruraltransition.org/investment-partnership-network/
Long, T.B., Blok, V., & Coninx, I. (2015). Barriers to the adoption and diffusion of technological innovations for climate-smart agriculture in Europe: evidence from the Netherlands, France, Switzerland and Italy. Journal of Cleaner Production, 112(1). Retrieved from http://dx.doi.org/10.1016/j.jclepro.2015.06.044
Raul, C., Prakash, S., Bharti, V.S., & Krishnan, S. (2020). GHGs emission from Aquaculture systems. Journal of the World Aquaculture Society. Retrieved from
https://www.researchgate.net/publication/344807131_GHGs_emission_from_Aq...
Soil and Water Conservation Bureau of Council of Agriculture, Executive Yuan, Taiwan. (2018). Rural Regeneration Development Platform. Retrieved from https://ep.swcb.gov.tw/EP/Default.aspx
The Climate Group. (2021). Decarbonisation pathways. Retrieved from https://www.theclimategroup.org/decarbonisation-pathways
The Council of Agriculture, Executive Yuan, Taiwan. (2021). COA Overview. Retrieved from https://eng.coa.gov.tw/ws.php?id=9501
Tseng, P.T. (2021). Vanished Hâ-pau-sū Lake: Water Governance and Commercial Management of Lakes on Jianan Plain (1640s-1910s). Taiwan Historical Research, 28 (1), Pp. 1-42.
United States Environmental Protection Agency. (2021). GHG Inventory Development Process and Guidance. Retrieved from https://www.epa.gov/climateleadership/ghg-inventory-development-process-...
WBCSD/WRI. (2004). Greenhouse Gas Protocol: A Corporate Accounting and Reporting Standard. Retrieved from https://ghgprotocol.org/sites/default/files/standards/ghg-protocol-revis...
WBCSD/WRI. (2014). GHG Protocol Agricultural Guidance. Retrieved from https://ghgprotocol.org/agriculture-guidance