ABSTRACT
The importance of Thai processed food products (TPFPs) has increased as a major export product of Thai agricultural and agri-food sectors over the past few decades. Moreover, Thailand has become a key producer and exporter of traded processed food. In addition, the expansion of Thai processed food exports (TPFEs) contributes to increased levels of local domestic employment. To create a better understating about TPFEs, this paper collects and summarizes key data of TPFEs in many areas, i.e., export pattern and structure, during 1998-2019. It is shown that the export growth of Thai processed food sector (TPFS) is dominated by a few product categories. These product categories are usually exported to developed countries. In short, there are no significant changes in export compositions and destinations of TPFS. This evidence indicates that the export growth of TPFS is dominated by the expansion of the intensive margin (export same products to same destinations), rather than export diversification.
Keywords: Processed food exports, export pattern and structure, Thailand
INTRODUCTION
Processed food exports have become a rising star in global trade, especially for developing countries (i.e., Thailand, Chile, and India). These countries have become key producers and exporters in world markets. In particular, Thailand was a relatively early entrant to the processed food export trade (Athukorala et al., 2002; Kohpaiboon, 2006). Following rapid growth in exports for over three decades, Thailand has become a key exporter of processed food (The Office of Industrial Economics, 2015). Moreover, processed food has become a key export product for the Thai agricultural sector. These exports have replaced some of the classic export commodities (i.e., rice and sugar). Several product categories in TPFS have been placed at the top of world rankings. Those categories include processed shrimp, processed chicken, canned tuna and canned pineapple (Tanrattanaphong, 2020). This is because processed food production is classified as a labor-intensive industry and Thailand is a country with an abundance of skilled workers (Humphrey & Memedovic, 2006; Kohpaiboon, 2006; Greenville & Kawasaki, 2018). However, based on the literature, there have been rarely empirical studies which summarize key statistics related to TPFEs, especially in terms of business and production environment, export composition and destination. This paper contributes to the literature by presenting and summarizing key information about the TPFS. The rest of the paper is organized as follows. Sections 2 and 3 provide an overview of TPFS and export structure of the TPFS, respectively. Section 4 is conclusion.
AN OVERVIEW OF THAI PROCESSED FOODS SECTOR
Trade performance
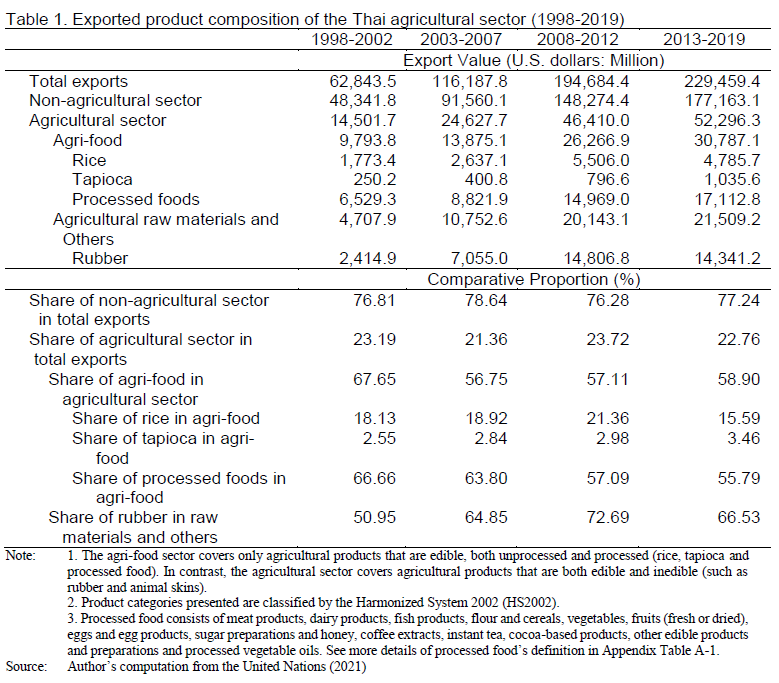
Over the past several decades, Thailand’s processed foods export values have exhibited rapid growth. This occurred after changes to Thailand’s trade policy in the mid-1980s, and the shift from Import Substitution strategy (IS) to Export Promotion strategy (EP) (Tanrattanaphong et al., 2020). As found in Table 1, the export value of agricultural products from Thailand has shifted from 6,529.3 million U.S. dollars over 1998-2002, to 17,112.8 million U.S. dollars over 2013-2019. In terms of the comparative proportion, processed food exports’ share in the agri-food sector was greater than 60% over 1998-2019. By contrast, other traditional Thai export products (i.e., rice and tapioca), which had been major traded products before the mid-1980s (Kohpaiboon, 2006), have become a minor component of agri-food exports.
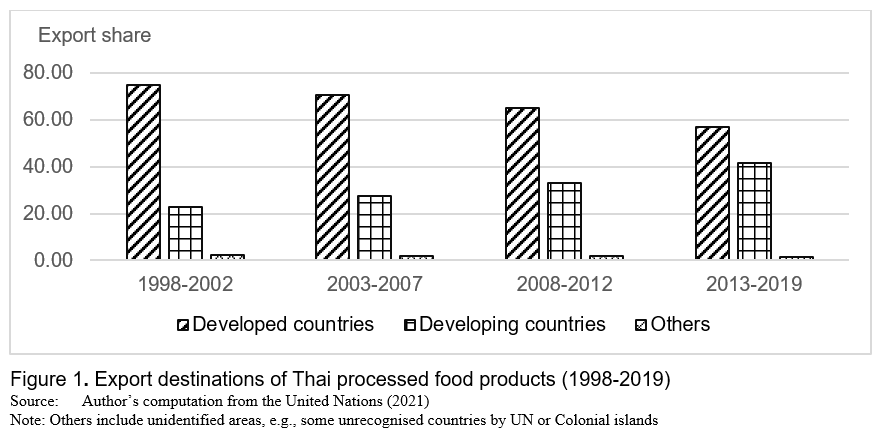
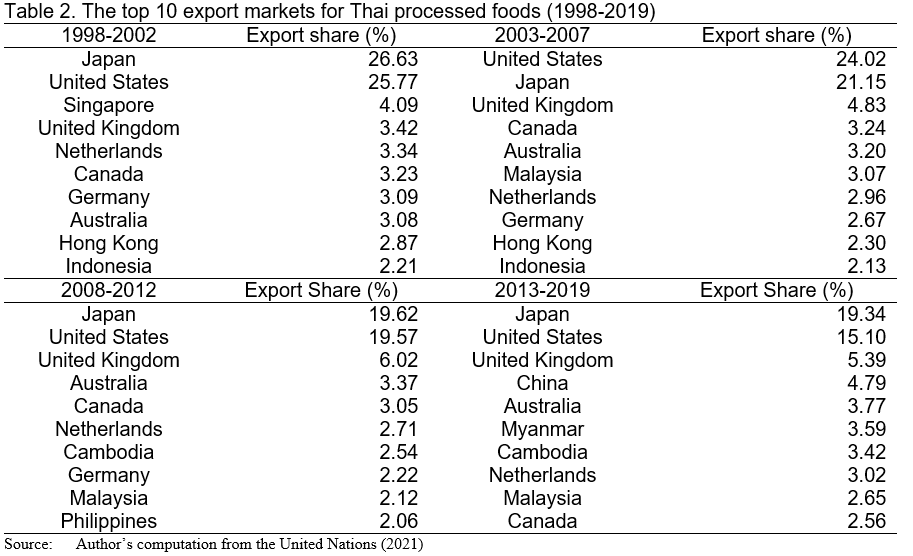
In terms of export destination, Figure 1 and Table 2 show that developed countries (i.e., the U.S., Japan and the UK) have been the main export markets of the TPFS. However, the percentage of TPFEs to developed countries has continuously been reduced. It decreased from 75.01% of exports over 1998-2002 to 56.94% over 2013-2019. Conversely, developing countries have increased in importance as export markets, especially ASEAN markets (Tanrattanaphong, 2020). The ratio of TPFEs to developing countries in total TPFEs has shifted from 22.62% over 1998-2002 to 41.63% over 2013-2019. Lipsey (2001) and Tanrattanaphong (2012) argue that when developing countries face a slump in traditional export markets (developed countries), the countries tend to maintain their export competitiveness as much as possible through export diversification, especially breaking into new export markets. This was particularly true when Thailand was faced with the effects of the 2008 global financial crisis, which contributed to the world economic recession. This is a good example of Thailand being forced to diversify its processed food exports to developing countries (especially neighboring countries). In addition, Thailand gains tariff privileges from the Asian Economic Community (AEC) agreement that has been fully implemented. This supports the expansion of TPFEs to ASEAN (Tanrattanaphong, 2020).
Production and the Business Environment
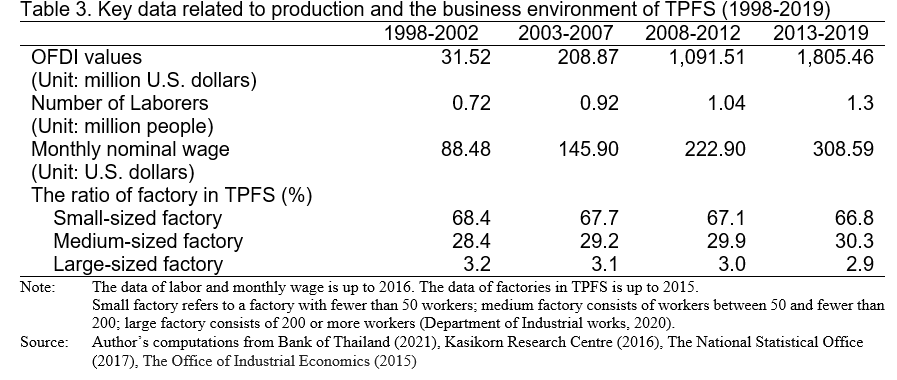
Most factories in the Thai processed food industry are small and medium-sized factories, which accounted for 97% during 1998-2019. Large factories accounted for only 3% during the same period (see Table 3). However, a few large Thai companies are key producers of processed food; for instance, the Charoen Pokphand (CP) group (which produces processed chicken and shrimp) and the Thai Union Frozen (TUF) group (which produces canned tuna). By contrast, other local firms (small and medium companies) in TPFS act as suppliers of those large Thai companies. Over 80% of TPFPs are exported (processed shrimp, processed chicken, canned tuna and canned pineapple). Besides, TPFPs are generally in the form of made-to-order products (The Office of Industrial Economics, 2015; Tanrattanaphong, 2020).
Some Thai processed food companies acquire global brands to increase their capacity of product distribution in overseas countries. For example, the TUF group, which produces canned tuna, acquired Chicken of the Sea (Errighi et al., 2016; Hamilton et al., 2011; Kohpaiboon, 2006; The Office of Industrial Economics, 2015). Also, large entrepreneurs in TPFS tend to invest in overseas countries to build sub-networks in the global network controlled by large multinational companies. As shown in Table 3, a significant increase of outward foreign direct investment (OFDI) in the food production sector was found during 1998-2019. It increased from US$31.52 million over 1998-2002, to US$1,805.46 million over 2013-2019.
Besides, TPFS has contributed to increased employment levels of Thailand. This is because the processed food sector is a labour-intensive industry (Tanrattanaphong, 2020). Table 3 shows that the number of laborers in the food industry has increased from 0.72 million people over 1998-2002 to 1.3 million people over 2013-2019. There has also been an increase in monthly wages in the TPFS, from an average of US$88.48 over 1998-2002 to US$308.59 over 2013-2019.
EXPORT STRUCTURE OF THE THAI PROCESSED FOOD SECTOR
Composition of exports
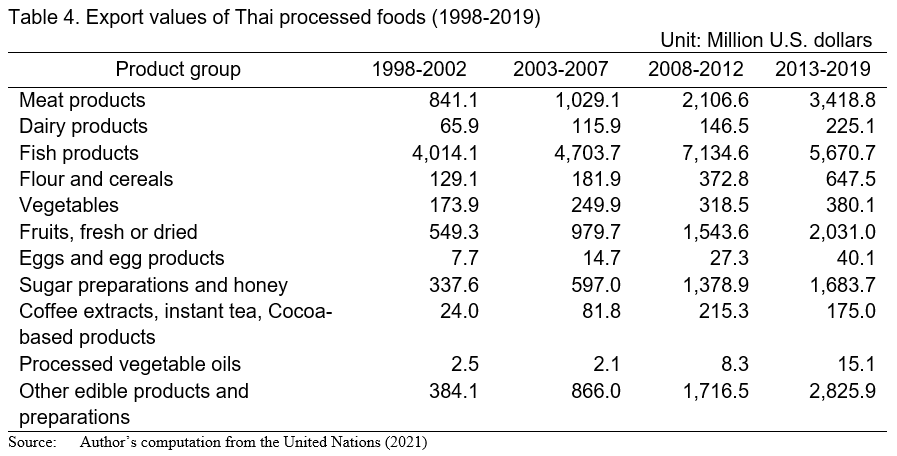
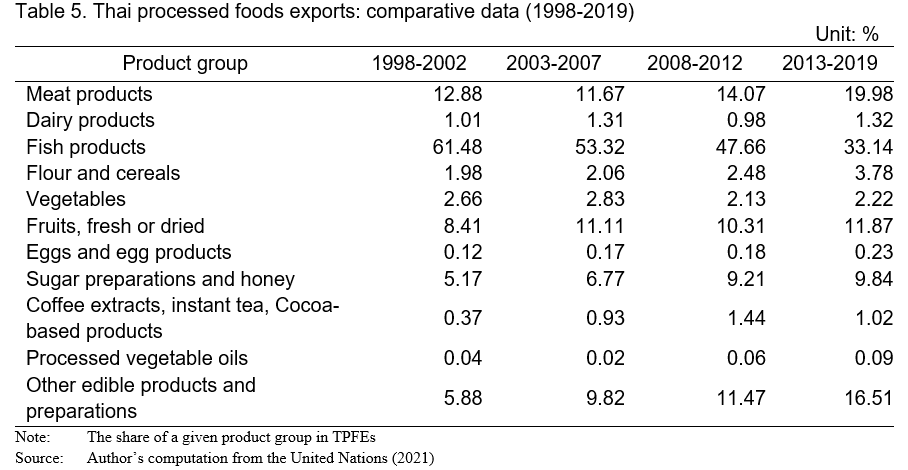
The export expansion of TPFS has been dominated by a few product categories, i.e., fish, meat and fruit products, over the period of 1998-2019. Table 4 shows that fish products have been placed at the first ranking of TPFEs. The export value of this product category increased from US$4,014.1 million over 1998-2002, to US$5,670.7 million over 2013-2016, and accounted for approximately 50% of all exports (Table 5). However, the importance of fish products as a significant export product in TPFS has been decreasing. That is, the export of share of fish products in TPFEs has reduced from 61.48% over 1998-2002, to 33.14% over 2013-2016.
By contrast, the meat and fruits products have increased their importance as key export products of TPFS during the same period. The export value of meat products increased from US$841.1 million during 1998-2002 to US$3,418.8 million during 2013-2019. Meat products’ export share in TPFS shifted from 12.88% during 1998-2002 to 19.98% during 2013-2019. In terms of fruit products, we found that their export value has increased from US$549.3 million to over US$2,000 million during the same period (Table 4). Fruit products’ export share of TPFS shifted from 8.41% to 11.87% during the same periods (Table 5). The export value of other products (e.g., dairy, flour, cereals, and vegetables) have continuously increased during 1998-2019. However, their export value has been relatively minor compared with fish, meat, and fruit products.
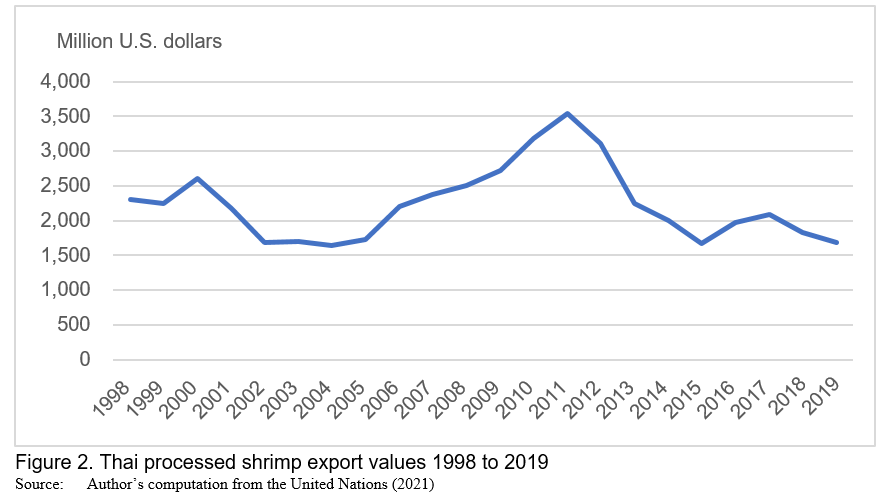
Focusing on the export of some key products of TPFS, processed shrimp, processed chicken, canned tuna, and canned pineapple have been major exporting product of TPFS, Thai agri-food and Thai agricultural sectors over the past few decades (Tanrattanaphong et al., 2020). Figure 2 displays that the export value of Thai processed shrimp products fluctuated because of several factors during 1998-2019 (i.e., world economic recession, the loss of the Generalised System of Privileges (GSP), and shrimp Early Mortality Syndrome (EMS)). In particular, Thai shrimp production suffered from an outbreak of EMS during 2012-2014. This reduced shrimp yields and raised some concerns about the food safety standards of Thai shrimp products (Kasikorn Research Centre, 2016; The Office of Industrial Economics, 2015; Tanrattanaphong, 2020). Consequently, the Thai processed shrimp export value reduced from US$3,104.7 million in 2012 to US$1,667.6 million in 2015. Moreover, the export share of Thai processed shrimp products in the agricultural sector, agri-food sector, and TPFS has significantly reduced. As displayed in Table 6, the export share of the processed shrimp in TPFEs decreased from 33.72% over 1998-2002 to 10.82% over 2013-2019. In addition, Tanrattanaphong (2020) suggests that the Thai processed shrimp industry has faced decreasing export competitiveness in world markets during the past two decades.
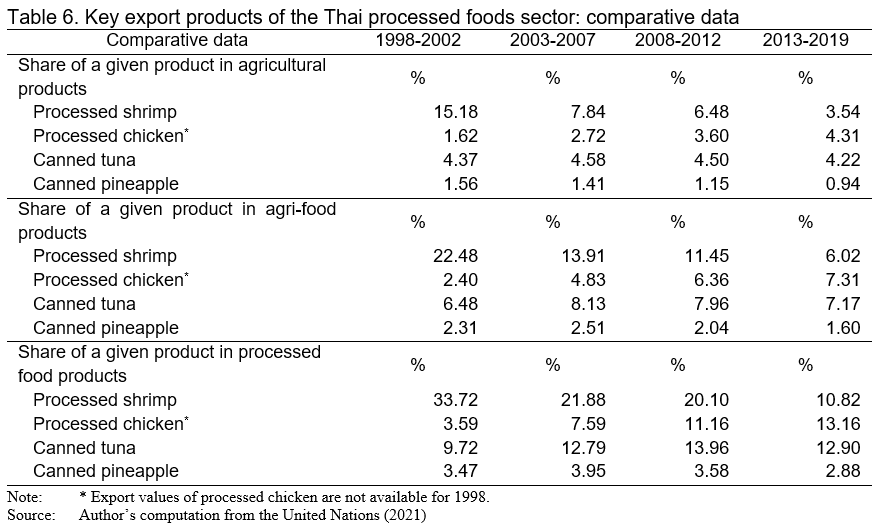
By contrast, the Thai processed chicken export value has achieved a predominantly upward trend between 1998 and 2019 even though Thailand was confronted by the world economic recession, new trade barriers, and the avian bird flu epidemic (2004 - 2005) (Krungsri Research, 2016). In particular, the bird flu outbreak during 2004-2005 led to a major change in the Thai chicken export structure. Because of the bird flu outbreak, all unprocessed forms of chicken were prohibited (i.e., fresh, chilled or frozen) (Krungsri Research, 2016). To overcome this issue, local firms in Thai chicken sector began to produce and export processed chicken products. This led to a noticeable increase in the export value of Thai processed chicken. The value shifted from US$684.3 million in 2005 to nearly US$1,900 million in 2011 (Figure 3). However, the export growth of Thai processed chicken slowed down during 2011-2016 since Thailand faced higher competition in world markets. Particularly, the EU, which is a major buyer of Thai processed chicken, applied tariff and non-tariff measures. For example, Thailand has received an export quota for processed chicken from the EU, approximately 160,033 tons/year with a tariff rate about 8%. Excess exports beyond the quota suffer a huge tariff rate, approximately €1,024/tons. These tariff and non-tariff measures have become key barriers to the Thai processed chicken export to the EU (Thailand’s Office of Agricultural Affairs, 2016). Table 6 also reports that the export share of the processed chicken in the Thai agricultural, agri-food and processed food sectors has continuously increased. For example, the export share in the agri-food (processed food) sector shifted from 2.4% (3.59%) over 1998-2002 to 7.31% (13.16%) over 2013-2019. Tanratttaphong (2020) also suggests that Thailand’s processed chicken industry has exhibited dominant export competitiveness in global markets during the last two decades.
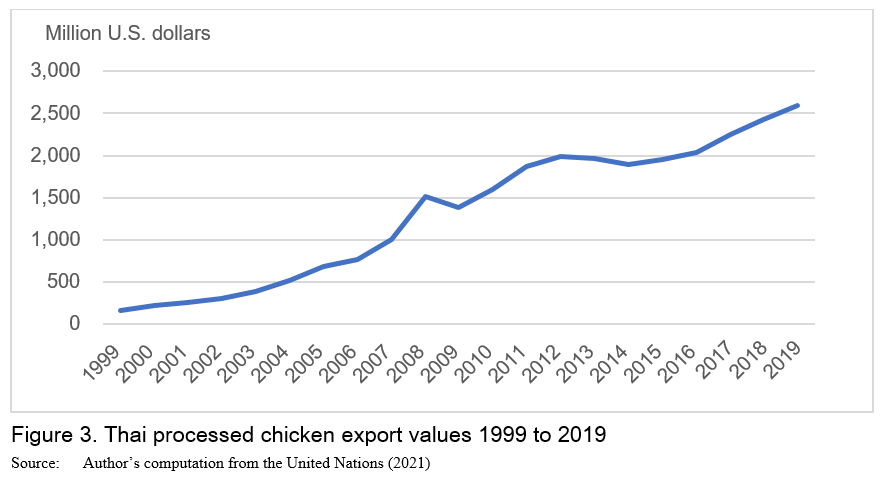
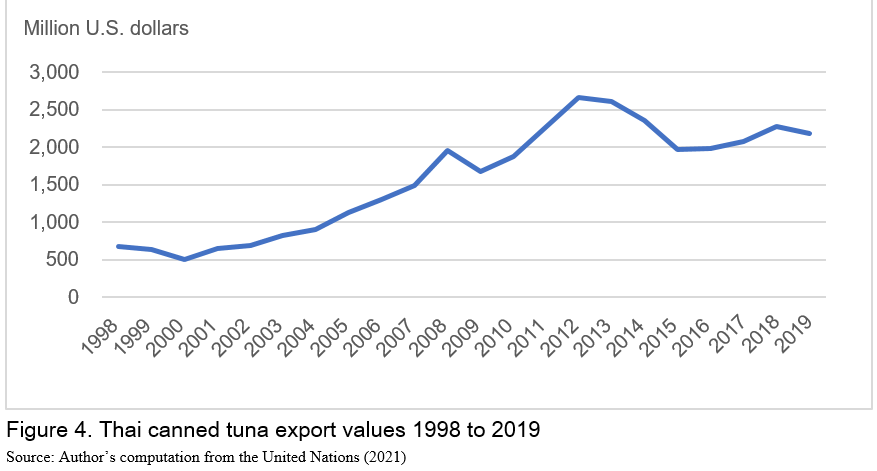
Figure 4 shows that the export value of Thai canned tuna continuously rose during 1998-2019 although Thailand faced negative impacts caused by the world economic recession and an increase in the cost of raw tuna (Hamilton et al., 2011; Tanrattanaphong, 2020). It reflects in a noticeable increase in the export value of Thai canned tuna from US$683 million in 1998 to US$2,185 million in 2019 (see Figure 4). Besides, Table 6 reports that the canned tuna exports’ share in the agricultural sector, agri-food sector, and processed food sectors increased between 1998 and 2019. For example, the export share of the Thai agri-food sector (TPFS) shifted from 6.48% (9.72%) over 1998-2002 to 7.17% (12.9%) over 2013-2019 (see Table 6). However, Tanratttanaphong (2020) argue that Thailand’s export competitiveness in canned tuna has decreased during the last two decades caused from the illegal, Unreported and Unregulated Fishing (IUU Fishing) problem, a lack of raw tuna, and the loss of the GSP (Hamilton et al., 2011; The Office of Industrial Economics, 2015).
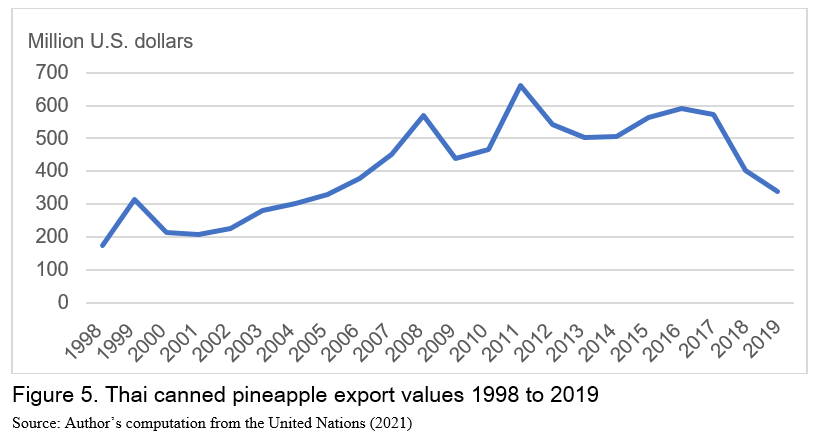
In terms of Thai canned pineapple products, the product’s export achieved an upward trend between 1998 and 2019, despite some fluctuations (Figure 5). Kasikorn Research Centre (2016) and Kohpaiboon (2006) suggest that reasons affecting the fluctuation of Thai canned pineapple export value include the world economic recession, a reduction in land available for the cultivation of pineapple in Thailand, and decreased yields. For instance, the export value of the Thai canned pineapple decreased from an average of US$314.8 million in 1999 to an average of US$214.6 million during 2000-2002. The export value expanded again between 2002 and 2006, from US$224.3 million in 2002 to US$378.6 million in 2006. However, fluctuations in export value recurred between 2008 and 2019. The export value reduced during 2008-2009, then climbed again during 2009-2011 (Figure 5). It was found that canned pineapple exports’ share in the agricultural sector, the agri-food sector, and TPFS slightly reduced during 1998-2019. For instance, the share in TPFS decreased from 3.47% over 1998-2002 to 2.88 % over 2013-2019 (Table 6). Likewise, Tanrattanaphong (2020) uses reveal comparative advantage (RCA) indices to examine export competitiveness of Thai canned pineapple and suggests that Thailand has faced decreasing export competitiveness in canned pineapple over the past two decades.
Export destinations
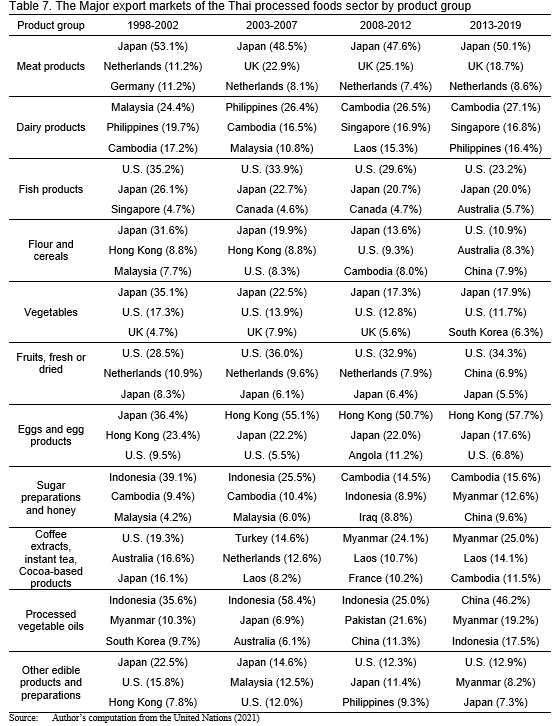
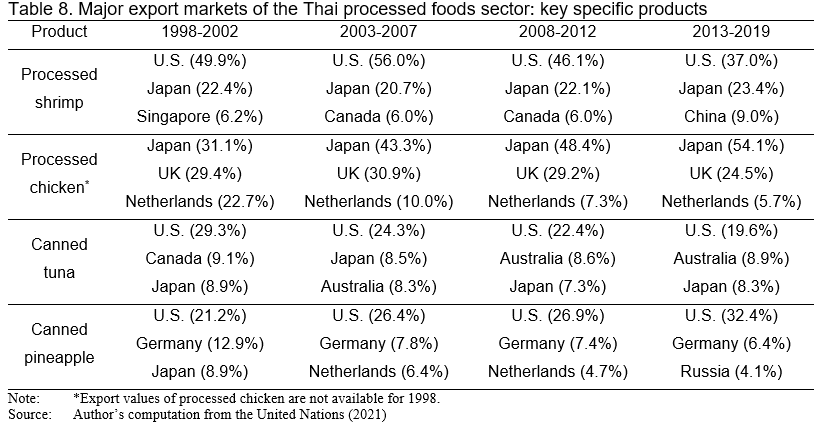
TPFPs were exported to both developed and developing countries during 1998-2019. On the one hand, developed countries were key importers of Thai meat and fish products, vegetables and fruit. Those countries are Japan, the EU, and the U.S. (Table7). On the other hand, developing countries imported other product categories (e.g., dairy products, sugar preparations and honey, and processed vegetable oils). Particularly, nearly 60% of exports of Thai dairy products was exported to ASEAN countries (e.g., Malaysia, the Philippines and Cambodia). Table 8 shows that developed countries are major importers of Thai processed shrimp, processed chicken, canned tuna, and canned pineapple. For example, about 70% of the total exports of Thai processed shrimp has been exported to the U.S. and Japan. In terms of Thai processed chicken, we found that Japan, the UK and the Netherlands were the top three trading partners of this product during 1998-2019. Table 8 also shows that about 84% of this product was exported to these three countries over the period of 1998-2019. For Thai canned tuna products, they were mainly exported to the U.S., Australian and Japanese markets, accounted for 40% of total exports of Thai canned tuna. In terms of Thai canned pineapple products, Table 8 shows that they have been mostly exported to the U.S., Germany, the Netherlands and Japan during the same period. In particular, more than 30% of Thai canned pineapple was exported to the U.S and Germany during 1998-2019. More interestingly, it was found that there have been no significant changes in export composition and export destination of TPFS over the study period. We may argue that the export growth of TPFS has been dominated by the expansion of the intensive margin rather than the export diversification[1], during 1998-2019.
CONCLUSION
TPFEs have become a key driver in Thai agricultural and agri-food sectors. This reflects in a noticeable increase in their export value during 1998-2019. Developed countries (i.e., the U.S., Japan, and the EU) are key importers of TPFPs. Interestingly, the importance of developing countries as an alternative export destination has been increased over the same period. In particular, Thailand exports processed food products to ASEAN countries where Thailand gains some tariff privileges from the AEC agreement. In terms of production and business environment, most TPFPs are produced for exports. Some TPFPs have been at the top of world ranking, such as processed shrimp, processed chicken, canned tuna, and canned pineapple. These products are usually produced and exported to the U.S., Japan, and the EU. Moreover, the expansion of TPFEs contributes to the domestic employment. More than a million workers are employed in TPFS. Most factories in TPFS are medium- and small-sized.
In-depth information related to export composition and destination of TPFS, the study found that a few product categories dominate the export growth of the sector during 1998-2019. Those categories are meat, fish, and fruits, (fresh or dried) products (e.g., processed shrimp, processed chicken, canned tuna, and canned pineapple). Moreover, the study found that there have been no significant changes in export destinations of these product categories. Japan, the U.S., the EU are key buyers of these products. This implies that the export growth of TPFS was dominated by the expansion of the intensive margin (export same products to same destinations), rather than export diversification. As a result, Thai private firms and Thai government should create proper strategies or policies that support the intensive margin, such as developing production process to meet current product standards required by traditional markets. In addition, Thai private firms and the government may raise the importance of export diversification as an alternative for expanding the processed food export when traditional export markets are stagnant.
REFERENCES
Athukorala, P. C., Gulati, A., Jayasuriya, S., Mehta, R. & Nidhiprabha, B. (2002, October). International food safety regulation and processed food exports from developing countries: The policy context, and the purpose and scope of the research project. Paper presented the Thammasat conference, Bangkok, Thailand.
Bank of Thailand. (2017). External sector statistics. http://www.bot.or.th
Department of Industrial works. (2020). The factory type. https://www.diw.go.th/hawk/content.php?mode=laws&tabid=1&secid=1
Errighi, L., Mamic, I. & Krogh-Poulsen, B. (2016, April). Global supply chains: Insights into the Thai seafood Sector. ILO Asia-Pacific Working Paper Series. www.ilo.org/asia/publications/WCMS_474896/lang--en/index.htm
Greenville, J. & Kawasaki, K. (2018, December). Agro-food trade, GVCs and agricultural development in ASEAN (No.116). OECD Food, Agriculture and Fisheries Papers. https://www.oecd-ilibrary.org/agriculture-and-food/agro-food-trade-gvcs-...
Hamilton, A., Lewis, A., McCoy, M. A., Havice, E. & Campling, L. (2011). Market and Industry Dynamicsin the Global Tuna Supply Chain. Honiara, Solomon Islands: Pacific Islands Forum Fisheries Agency.
Humphrey, J. & Memedovic, O. (2006). Global value chains in the agrifood sector. Vienna, Austria: United Nations Industrial Development Organization.
Jongwanich, J. (2009). Impact of food safety standards on processed food exports from developing countries. Food Policy, 34(5), 447-457. https://doi.org/10.1016/j.foodpol.2009.05.004
Kasikorn Research Centre. (2016). Thai processed food exports. http://www.kasikornbank.com/th/business/sme/KSMEKnowledge/article/KSMEAn... s/ExportProcessedFood.pdf
Kohpaiboon, A. (2006). Multinational Enterprises and Industrial Transformation. Edward Elgar Publishing, Inc.
Krungsri Research. (2016). Frozen and processed chicken. http://www.krungsri.com/bank getmedia/b183a13a-002b-4aa3-8318 ae74566d89b6/IO_Chicken_2016_TH.aspx
Lipsey, R. E. (2001, January). Foreign Direct Investors in Three Financial Crises (No.8084). NBER Working Paper. http://www.nber.org/papers/w8084
The National Statistical Office. (2017). Employment rate and wage of Thai processed food industry. http://statbbi.nso.go.th/staticreport/page/sector/th/02.aspx
The Office of Industrial Economics. (2015). Project examining the effects of global and supply chain (GSC) free trade agreements (FTAs) on Thai manufacturing (Final report).
Tanrattanaphong, B. (2012). Thai exports: Intensive versus extensive margins (Unpublished master thesis). Thammasat University, Bangkok, Thailand.
Tanrattanaphong, B. (2020). An analysis of Thailand's processed food global value chains [Doctoral thesis, Lincoln University]. Lincoln University. https://researcharchive.lincoln.ac.nz/handle/10182/12462
Tanrattanaphong, B., Baiding, H., & Gan, C. (2020). The impacts of value chain upgrading on the export of processed food. Food Policy, 93. https://doi.org/10.1016/j.foodpol.2020.101906
Thailand’s Office of Agricultural Affairs. (2016). Statistics of food and agricultural products between Europe and Thailand 2013-2016. http://www2.thaieurope.ne
The United Nations. (2021). International trade statistics database. https://comtrade.un.org/data/
[1] The growth of exports can be normally divided into the expansion of the intensive margin and the expansion of the extensive margin. The former refers to the circumstance where an export’s change of a country is accounted by exporting an already exported product to a destination country that it is the same as previous periods. By contrast, the latter is defined as the number of country-product relationships an exporting country increases (Tanrattanaphong, 2012).


Thailand's Processed Food Exports: Pattern and Structure
ABSTRACT
The importance of Thai processed food products (TPFPs) has increased as a major export product of Thai agricultural and agri-food sectors over the past few decades. Moreover, Thailand has become a key producer and exporter of traded processed food. In addition, the expansion of Thai processed food exports (TPFEs) contributes to increased levels of local domestic employment. To create a better understating about TPFEs, this paper collects and summarizes key data of TPFEs in many areas, i.e., export pattern and structure, during 1998-2019. It is shown that the export growth of Thai processed food sector (TPFS) is dominated by a few product categories. These product categories are usually exported to developed countries. In short, there are no significant changes in export compositions and destinations of TPFS. This evidence indicates that the export growth of TPFS is dominated by the expansion of the intensive margin (export same products to same destinations), rather than export diversification.
Keywords: Processed food exports, export pattern and structure, Thailand
INTRODUCTION
Processed food exports have become a rising star in global trade, especially for developing countries (i.e., Thailand, Chile, and India). These countries have become key producers and exporters in world markets. In particular, Thailand was a relatively early entrant to the processed food export trade (Athukorala et al., 2002; Kohpaiboon, 2006). Following rapid growth in exports for over three decades, Thailand has become a key exporter of processed food (The Office of Industrial Economics, 2015). Moreover, processed food has become a key export product for the Thai agricultural sector. These exports have replaced some of the classic export commodities (i.e., rice and sugar). Several product categories in TPFS have been placed at the top of world rankings. Those categories include processed shrimp, processed chicken, canned tuna and canned pineapple (Tanrattanaphong, 2020). This is because processed food production is classified as a labor-intensive industry and Thailand is a country with an abundance of skilled workers (Humphrey & Memedovic, 2006; Kohpaiboon, 2006; Greenville & Kawasaki, 2018). However, based on the literature, there have been rarely empirical studies which summarize key statistics related to TPFEs, especially in terms of business and production environment, export composition and destination. This paper contributes to the literature by presenting and summarizing key information about the TPFS. The rest of the paper is organized as follows. Sections 2 and 3 provide an overview of TPFS and export structure of the TPFS, respectively. Section 4 is conclusion.
AN OVERVIEW OF THAI PROCESSED FOODS SECTOR
Trade performance
Over the past several decades, Thailand’s processed foods export values have exhibited rapid growth. This occurred after changes to Thailand’s trade policy in the mid-1980s, and the shift from Import Substitution strategy (IS) to Export Promotion strategy (EP) (Tanrattanaphong et al., 2020). As found in Table 1, the export value of agricultural products from Thailand has shifted from 6,529.3 million U.S. dollars over 1998-2002, to 17,112.8 million U.S. dollars over 2013-2019. In terms of the comparative proportion, processed food exports’ share in the agri-food sector was greater than 60% over 1998-2019. By contrast, other traditional Thai export products (i.e., rice and tapioca), which had been major traded products before the mid-1980s (Kohpaiboon, 2006), have become a minor component of agri-food exports.
In terms of export destination, Figure 1 and Table 2 show that developed countries (i.e., the U.S., Japan and the UK) have been the main export markets of the TPFS. However, the percentage of TPFEs to developed countries has continuously been reduced. It decreased from 75.01% of exports over 1998-2002 to 56.94% over 2013-2019. Conversely, developing countries have increased in importance as export markets, especially ASEAN markets (Tanrattanaphong, 2020). The ratio of TPFEs to developing countries in total TPFEs has shifted from 22.62% over 1998-2002 to 41.63% over 2013-2019. Lipsey (2001) and Tanrattanaphong (2012) argue that when developing countries face a slump in traditional export markets (developed countries), the countries tend to maintain their export competitiveness as much as possible through export diversification, especially breaking into new export markets. This was particularly true when Thailand was faced with the effects of the 2008 global financial crisis, which contributed to the world economic recession. This is a good example of Thailand being forced to diversify its processed food exports to developing countries (especially neighboring countries). In addition, Thailand gains tariff privileges from the Asian Economic Community (AEC) agreement that has been fully implemented. This supports the expansion of TPFEs to ASEAN (Tanrattanaphong, 2020).
Production and the Business Environment
Most factories in the Thai processed food industry are small and medium-sized factories, which accounted for 97% during 1998-2019. Large factories accounted for only 3% during the same period (see Table 3). However, a few large Thai companies are key producers of processed food; for instance, the Charoen Pokphand (CP) group (which produces processed chicken and shrimp) and the Thai Union Frozen (TUF) group (which produces canned tuna). By contrast, other local firms (small and medium companies) in TPFS act as suppliers of those large Thai companies. Over 80% of TPFPs are exported (processed shrimp, processed chicken, canned tuna and canned pineapple). Besides, TPFPs are generally in the form of made-to-order products (The Office of Industrial Economics, 2015; Tanrattanaphong, 2020).
Some Thai processed food companies acquire global brands to increase their capacity of product distribution in overseas countries. For example, the TUF group, which produces canned tuna, acquired Chicken of the Sea (Errighi et al., 2016; Hamilton et al., 2011; Kohpaiboon, 2006; The Office of Industrial Economics, 2015). Also, large entrepreneurs in TPFS tend to invest in overseas countries to build sub-networks in the global network controlled by large multinational companies. As shown in Table 3, a significant increase of outward foreign direct investment (OFDI) in the food production sector was found during 1998-2019. It increased from US$31.52 million over 1998-2002, to US$1,805.46 million over 2013-2019.
Besides, TPFS has contributed to increased employment levels of Thailand. This is because the processed food sector is a labour-intensive industry (Tanrattanaphong, 2020). Table 3 shows that the number of laborers in the food industry has increased from 0.72 million people over 1998-2002 to 1.3 million people over 2013-2019. There has also been an increase in monthly wages in the TPFS, from an average of US$88.48 over 1998-2002 to US$308.59 over 2013-2019.
EXPORT STRUCTURE OF THE THAI PROCESSED FOOD SECTOR
Composition of exports
The export expansion of TPFS has been dominated by a few product categories, i.e., fish, meat and fruit products, over the period of 1998-2019. Table 4 shows that fish products have been placed at the first ranking of TPFEs. The export value of this product category increased from US$4,014.1 million over 1998-2002, to US$5,670.7 million over 2013-2016, and accounted for approximately 50% of all exports (Table 5). However, the importance of fish products as a significant export product in TPFS has been decreasing. That is, the export of share of fish products in TPFEs has reduced from 61.48% over 1998-2002, to 33.14% over 2013-2016.
By contrast, the meat and fruits products have increased their importance as key export products of TPFS during the same period. The export value of meat products increased from US$841.1 million during 1998-2002 to US$3,418.8 million during 2013-2019. Meat products’ export share in TPFS shifted from 12.88% during 1998-2002 to 19.98% during 2013-2019. In terms of fruit products, we found that their export value has increased from US$549.3 million to over US$2,000 million during the same period (Table 4). Fruit products’ export share of TPFS shifted from 8.41% to 11.87% during the same periods (Table 5). The export value of other products (e.g., dairy, flour, cereals, and vegetables) have continuously increased during 1998-2019. However, their export value has been relatively minor compared with fish, meat, and fruit products.
Focusing on the export of some key products of TPFS, processed shrimp, processed chicken, canned tuna, and canned pineapple have been major exporting product of TPFS, Thai agri-food and Thai agricultural sectors over the past few decades (Tanrattanaphong et al., 2020). Figure 2 displays that the export value of Thai processed shrimp products fluctuated because of several factors during 1998-2019 (i.e., world economic recession, the loss of the Generalised System of Privileges (GSP), and shrimp Early Mortality Syndrome (EMS)). In particular, Thai shrimp production suffered from an outbreak of EMS during 2012-2014. This reduced shrimp yields and raised some concerns about the food safety standards of Thai shrimp products (Kasikorn Research Centre, 2016; The Office of Industrial Economics, 2015; Tanrattanaphong, 2020). Consequently, the Thai processed shrimp export value reduced from US$3,104.7 million in 2012 to US$1,667.6 million in 2015. Moreover, the export share of Thai processed shrimp products in the agricultural sector, agri-food sector, and TPFS has significantly reduced. As displayed in Table 6, the export share of the processed shrimp in TPFEs decreased from 33.72% over 1998-2002 to 10.82% over 2013-2019. In addition, Tanrattanaphong (2020) suggests that the Thai processed shrimp industry has faced decreasing export competitiveness in world markets during the past two decades.
By contrast, the Thai processed chicken export value has achieved a predominantly upward trend between 1998 and 2019 even though Thailand was confronted by the world economic recession, new trade barriers, and the avian bird flu epidemic (2004 - 2005) (Krungsri Research, 2016). In particular, the bird flu outbreak during 2004-2005 led to a major change in the Thai chicken export structure. Because of the bird flu outbreak, all unprocessed forms of chicken were prohibited (i.e., fresh, chilled or frozen) (Krungsri Research, 2016). To overcome this issue, local firms in Thai chicken sector began to produce and export processed chicken products. This led to a noticeable increase in the export value of Thai processed chicken. The value shifted from US$684.3 million in 2005 to nearly US$1,900 million in 2011 (Figure 3). However, the export growth of Thai processed chicken slowed down during 2011-2016 since Thailand faced higher competition in world markets. Particularly, the EU, which is a major buyer of Thai processed chicken, applied tariff and non-tariff measures. For example, Thailand has received an export quota for processed chicken from the EU, approximately 160,033 tons/year with a tariff rate about 8%. Excess exports beyond the quota suffer a huge tariff rate, approximately €1,024/tons. These tariff and non-tariff measures have become key barriers to the Thai processed chicken export to the EU (Thailand’s Office of Agricultural Affairs, 2016). Table 6 also reports that the export share of the processed chicken in the Thai agricultural, agri-food and processed food sectors has continuously increased. For example, the export share in the agri-food (processed food) sector shifted from 2.4% (3.59%) over 1998-2002 to 7.31% (13.16%) over 2013-2019. Tanratttaphong (2020) also suggests that Thailand’s processed chicken industry has exhibited dominant export competitiveness in global markets during the last two decades.
Figure 4 shows that the export value of Thai canned tuna continuously rose during 1998-2019 although Thailand faced negative impacts caused by the world economic recession and an increase in the cost of raw tuna (Hamilton et al., 2011; Tanrattanaphong, 2020). It reflects in a noticeable increase in the export value of Thai canned tuna from US$683 million in 1998 to US$2,185 million in 2019 (see Figure 4). Besides, Table 6 reports that the canned tuna exports’ share in the agricultural sector, agri-food sector, and processed food sectors increased between 1998 and 2019. For example, the export share of the Thai agri-food sector (TPFS) shifted from 6.48% (9.72%) over 1998-2002 to 7.17% (12.9%) over 2013-2019 (see Table 6). However, Tanratttanaphong (2020) argue that Thailand’s export competitiveness in canned tuna has decreased during the last two decades caused from the illegal, Unreported and Unregulated Fishing (IUU Fishing) problem, a lack of raw tuna, and the loss of the GSP (Hamilton et al., 2011; The Office of Industrial Economics, 2015).
In terms of Thai canned pineapple products, the product’s export achieved an upward trend between 1998 and 2019, despite some fluctuations (Figure 5). Kasikorn Research Centre (2016) and Kohpaiboon (2006) suggest that reasons affecting the fluctuation of Thai canned pineapple export value include the world economic recession, a reduction in land available for the cultivation of pineapple in Thailand, and decreased yields. For instance, the export value of the Thai canned pineapple decreased from an average of US$314.8 million in 1999 to an average of US$214.6 million during 2000-2002. The export value expanded again between 2002 and 2006, from US$224.3 million in 2002 to US$378.6 million in 2006. However, fluctuations in export value recurred between 2008 and 2019. The export value reduced during 2008-2009, then climbed again during 2009-2011 (Figure 5). It was found that canned pineapple exports’ share in the agricultural sector, the agri-food sector, and TPFS slightly reduced during 1998-2019. For instance, the share in TPFS decreased from 3.47% over 1998-2002 to 2.88 % over 2013-2019 (Table 6). Likewise, Tanrattanaphong (2020) uses reveal comparative advantage (RCA) indices to examine export competitiveness of Thai canned pineapple and suggests that Thailand has faced decreasing export competitiveness in canned pineapple over the past two decades.
Export destinations
TPFPs were exported to both developed and developing countries during 1998-2019. On the one hand, developed countries were key importers of Thai meat and fish products, vegetables and fruit. Those countries are Japan, the EU, and the U.S. (Table7). On the other hand, developing countries imported other product categories (e.g., dairy products, sugar preparations and honey, and processed vegetable oils). Particularly, nearly 60% of exports of Thai dairy products was exported to ASEAN countries (e.g., Malaysia, the Philippines and Cambodia). Table 8 shows that developed countries are major importers of Thai processed shrimp, processed chicken, canned tuna, and canned pineapple. For example, about 70% of the total exports of Thai processed shrimp has been exported to the U.S. and Japan. In terms of Thai processed chicken, we found that Japan, the UK and the Netherlands were the top three trading partners of this product during 1998-2019. Table 8 also shows that about 84% of this product was exported to these three countries over the period of 1998-2019. For Thai canned tuna products, they were mainly exported to the U.S., Australian and Japanese markets, accounted for 40% of total exports of Thai canned tuna. In terms of Thai canned pineapple products, Table 8 shows that they have been mostly exported to the U.S., Germany, the Netherlands and Japan during the same period. In particular, more than 30% of Thai canned pineapple was exported to the U.S and Germany during 1998-2019. More interestingly, it was found that there have been no significant changes in export composition and export destination of TPFS over the study period. We may argue that the export growth of TPFS has been dominated by the expansion of the intensive margin rather than the export diversification[1], during 1998-2019.
CONCLUSION
TPFEs have become a key driver in Thai agricultural and agri-food sectors. This reflects in a noticeable increase in their export value during 1998-2019. Developed countries (i.e., the U.S., Japan, and the EU) are key importers of TPFPs. Interestingly, the importance of developing countries as an alternative export destination has been increased over the same period. In particular, Thailand exports processed food products to ASEAN countries where Thailand gains some tariff privileges from the AEC agreement. In terms of production and business environment, most TPFPs are produced for exports. Some TPFPs have been at the top of world ranking, such as processed shrimp, processed chicken, canned tuna, and canned pineapple. These products are usually produced and exported to the U.S., Japan, and the EU. Moreover, the expansion of TPFEs contributes to the domestic employment. More than a million workers are employed in TPFS. Most factories in TPFS are medium- and small-sized.
In-depth information related to export composition and destination of TPFS, the study found that a few product categories dominate the export growth of the sector during 1998-2019. Those categories are meat, fish, and fruits, (fresh or dried) products (e.g., processed shrimp, processed chicken, canned tuna, and canned pineapple). Moreover, the study found that there have been no significant changes in export destinations of these product categories. Japan, the U.S., the EU are key buyers of these products. This implies that the export growth of TPFS was dominated by the expansion of the intensive margin (export same products to same destinations), rather than export diversification. As a result, Thai private firms and Thai government should create proper strategies or policies that support the intensive margin, such as developing production process to meet current product standards required by traditional markets. In addition, Thai private firms and the government may raise the importance of export diversification as an alternative for expanding the processed food export when traditional export markets are stagnant.
REFERENCES
Athukorala, P. C., Gulati, A., Jayasuriya, S., Mehta, R. & Nidhiprabha, B. (2002, October). International food safety regulation and processed food exports from developing countries: The policy context, and the purpose and scope of the research project. Paper presented the Thammasat conference, Bangkok, Thailand.
Bank of Thailand. (2017). External sector statistics. http://www.bot.or.th
Department of Industrial works. (2020). The factory type. https://www.diw.go.th/hawk/content.php?mode=laws&tabid=1&secid=1
Errighi, L., Mamic, I. & Krogh-Poulsen, B. (2016, April). Global supply chains: Insights into the Thai seafood Sector. ILO Asia-Pacific Working Paper Series. www.ilo.org/asia/publications/WCMS_474896/lang--en/index.htm
Greenville, J. & Kawasaki, K. (2018, December). Agro-food trade, GVCs and agricultural development in ASEAN (No.116). OECD Food, Agriculture and Fisheries Papers. https://www.oecd-ilibrary.org/agriculture-and-food/agro-food-trade-gvcs-...
Hamilton, A., Lewis, A., McCoy, M. A., Havice, E. & Campling, L. (2011). Market and Industry Dynamicsin the Global Tuna Supply Chain. Honiara, Solomon Islands: Pacific Islands Forum Fisheries Agency.
Humphrey, J. & Memedovic, O. (2006). Global value chains in the agrifood sector. Vienna, Austria: United Nations Industrial Development Organization.
Jongwanich, J. (2009). Impact of food safety standards on processed food exports from developing countries. Food Policy, 34(5), 447-457. https://doi.org/10.1016/j.foodpol.2009.05.004
Kasikorn Research Centre. (2016). Thai processed food exports. http://www.kasikornbank.com/th/business/sme/KSMEKnowledge/article/KSMEAn... s/ExportProcessedFood.pdf
Kohpaiboon, A. (2006). Multinational Enterprises and Industrial Transformation. Edward Elgar Publishing, Inc.
Krungsri Research. (2016). Frozen and processed chicken. http://www.krungsri.com/bank getmedia/b183a13a-002b-4aa3-8318 ae74566d89b6/IO_Chicken_2016_TH.aspx
Lipsey, R. E. (2001, January). Foreign Direct Investors in Three Financial Crises (No.8084). NBER Working Paper. http://www.nber.org/papers/w8084
The National Statistical Office. (2017). Employment rate and wage of Thai processed food industry. http://statbbi.nso.go.th/staticreport/page/sector/th/02.aspx
The Office of Industrial Economics. (2015). Project examining the effects of global and supply chain (GSC) free trade agreements (FTAs) on Thai manufacturing (Final report).
Tanrattanaphong, B. (2012). Thai exports: Intensive versus extensive margins (Unpublished master thesis). Thammasat University, Bangkok, Thailand.
Tanrattanaphong, B. (2020). An analysis of Thailand's processed food global value chains [Doctoral thesis, Lincoln University]. Lincoln University. https://researcharchive.lincoln.ac.nz/handle/10182/12462
Tanrattanaphong, B., Baiding, H., & Gan, C. (2020). The impacts of value chain upgrading on the export of processed food. Food Policy, 93. https://doi.org/10.1016/j.foodpol.2020.101906
Thailand’s Office of Agricultural Affairs. (2016). Statistics of food and agricultural products between Europe and Thailand 2013-2016. http://www2.thaieurope.ne
The United Nations. (2021). International trade statistics database. https://comtrade.un.org/data/
[1] The growth of exports can be normally divided into the expansion of the intensive margin and the expansion of the extensive margin. The former refers to the circumstance where an export’s change of a country is accounted by exporting an already exported product to a destination country that it is the same as previous periods. By contrast, the latter is defined as the number of country-product relationships an exporting country increases (Tanrattanaphong, 2012).