ABSTRACT
In Myanmar, major oilseed crops are groundnut, sesame, sunflower, mustard and niger. Among the oilseed crops, groundnut is one of the most popular edible oil and protein producing crops in the world. The study attempted to analyze marketing margin of groundnut value-added products of groundnut farmers in the study area. A total of 150 sample groundnut farmers were chosen with purposive random sampling method in Myinmu Township, Sagaing Region in 2018. In the data analysis, descriptive analysis, cost and return analysis and marketing margin analysis were used. The findings indicated that sample groundnut farmers received the highest benefit cost ratio (BCR) from selling as seeds (1.97) and the lowest BCR from selling as pods (1.0) during the crop season. Although 73.81% of total groundnut production was sold by sample groundnut farmers, 26.19% of total groundnut production was excluded for home consumption and reserved seeds for next season. The marketed surplus of groundnut production consisted of highly purified grains (62.58%), low purified grains (27.68%), edible oil and oilcake (5.77%), and seed (3.97%). In marketing margin analysis, selling of groundnut seeds received the highest profit share (87.20%), followed by selling highly purified grains (39.30%), edible oil and oilcake (36.40%), low purified grains (29.2%) and pods (8.40%). Moreover, the profit per cost price of seed received the higher profit share than the other groundnut products. More processing steps contributed significantly to more profits. The results indicate that value adding is potential business for better income and profit of groundnut farmers. Therefore, groundnut farmers should consider embarking on creating value-added products of groundnut instead of merely selling raw products to earn more profits.
Keywords: Groundnut, value-added, marketing margins, Myinmu Township, Sagaing Region, Myanmar.
INTRODUCTION
In Myanmar, oilseed crops play a vital role due to high consumption of cooking oil compared to its neighbouring countries. The contribution of oilseed crops also plays a substantial role in Myanmar’s agricultural sector and domestic agricultural product markets as well as in international markets. Fifteen percent of the total crop sown area is covered with oilseeds which include sesame, groundnut, sunflower, mustard, niger etc. In many parts of central Myanmar, oilseeds, particularly sesame and groundnut stand for an important part in ensuring food security and providing cash income for education, health and other social necessities (MOALI, 2017).
Among the oilseed crops, groundnut is one of the most popular edible oil and protein producing crops in the world. Most of the groundnuts grown in the world are used to produce oil, groundnut butter, confectionaries, roasted groundnuts and snack products, extenders in meat product formulations, soups and desserts. Groundnut is directly consumed as raw nut or in processed form based on the different value chains (Dhanesh & Kochhar, 2015).
In Myanmar, groundnut cultivation occupies the second largest areas with the highest production among the oilseed crops. Myinmu Township is the largest area of groundnut production in Sagaing District of Myanmar. Opportunities can be explored by processing value-added products of groundnut. Groundnut farmers can increase income by processing value-added products of groundnut instead of selling raw product. Profitability is a significant consideration for farmers in processing value-added products of groundnut. Therefore, this study aims to analyze the marketing margin of groundnut value-added products of groundnut farmers in Myinmu Township, Sagaing Region. There are two specific objectives in this study:
- To explore the socio-economic characteristics of sample groundnut farmers and their opportunities to be able to make profits by processing groundnut based value-added products in Myinmu Township; and
- To analyze the marketing margin for each kind of value-added groundnut products of sample farmers in the study area
Research methodology
This study interviewed sample groundnut farmers during the period from November to December, 2018. Both primary and secondary sources of data were used in this study. As the primary data, a total 150 farm households were selected by using purposive random sampling technique and were interviewed with a structured questionnaires. Secondary data were taken from the published papers, official records, and other related theses from Ministry of Agriculture, Livestock and Irrigation (MOALI), Department of Agriculture (DOA) and Yezin Agricultural University (YAU) library.
Both qualitative and quantitative data were firstly compiled in the Microsoft Excel Program. Descriptive analysis, cost and return analysis, and marketing cost and marketing margin analysis were used in this study. The descriptive statistics were analyzed by using diagrams, percentages, frequencies, means and standard deviations in examining the value-added groundnut processing opportunities as well as farmer’s socio-economic characteristics. The profit per cost price was used to analyze the performances of farmers. Cost and return analysis, and marketing cost and marketing margin analysis were calculated by using Microsoft excel and SPSS version 25.0 software. Cost and return analysis was as follows;
|
1.
|
Return above variable cash cost
|
= Total gross benefit - Total variable cash cost
|
|
2.
|
Return above variable cost
|
= Total gross benefit - Total variable cost
|
|
3.
|
Return per unit of capital invested
|
= Total gross benefit/Total variable cost
|
|
4.
|
Return per unit cash cost
|
= Total gross benefit/Total variable cash cost
|
|
5.
|
Benefit cost ratio
|
= Gross benefit/Total variable cost
|
|
|
|
(Olson, 2003)
|
Marketing margin was calculated by using following equations;
|
1.
|
Marketing margin
|
= Average selling price - Average buying price
|
|
2.
|
Profit
|
= Gross marketing margin - Total marketing cost
|
|
3.
|
Cost price
|
= Buying price + Total marketing cost
|
|
4.
|
Percentage of profit
|
= Profit / Cost price x 100
|
|
|
|
(Olufokunbi, 1982)
|
RESULTS AND DISCUSSION
Demographic characteristics of sample groundnut farmers
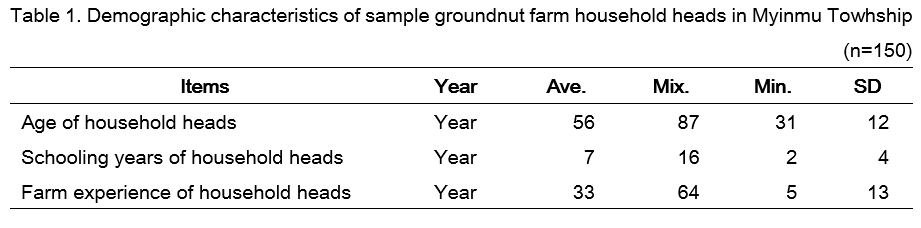
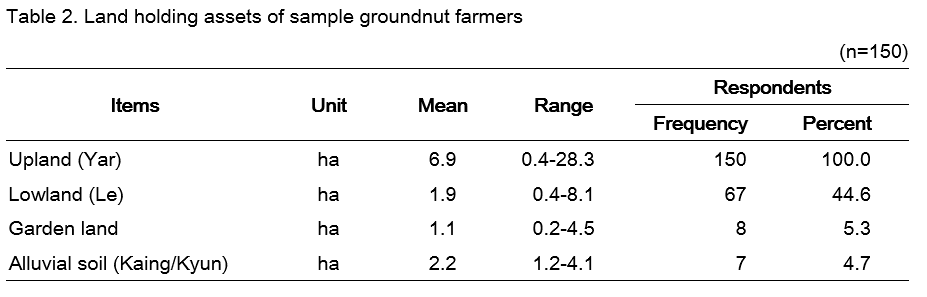
Demographic characteristics of sample groundnut farmers in the study area were presented in Table 1. In the study area, the average age of sample household heads was 56 years who obtained 7 schooling years and 33 years of farming experience on average. In the study area, all sample farmers owned upland farms with the average area of 6.9 hectares. Moreover, 44.6 % of sample farmers possessed 1.9 hectares of lowland, few sample farmers (5.3%) occupied 1.1 hectares of garden land, while 4.7% of sample farmers owned 2.2 hectares of alluvial soil (kaing/kyun) (Table 2).
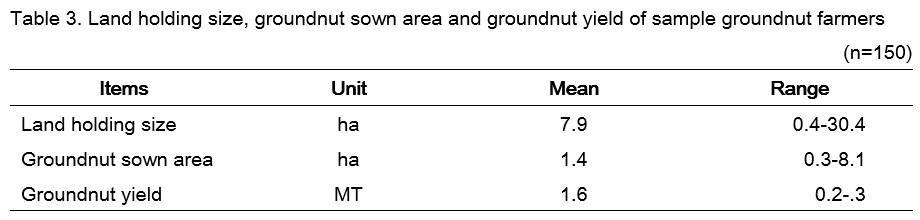
It is expected that households with large farms would spread production costs across a large output leading to economies of scale. The average land holding size was 7.9 hectares. It ranged between 0.4 hectare and 30.4 hectares. The average groundnut sown area of sample farmers was 1.4 hectares ranging from 0.3 hectare and 8.1 hectares. The average yield of groundnut with shell (pod) was about 1.6 metric tons ranging from 0.2 metric ton and 11.3 metric tons (Table 3).
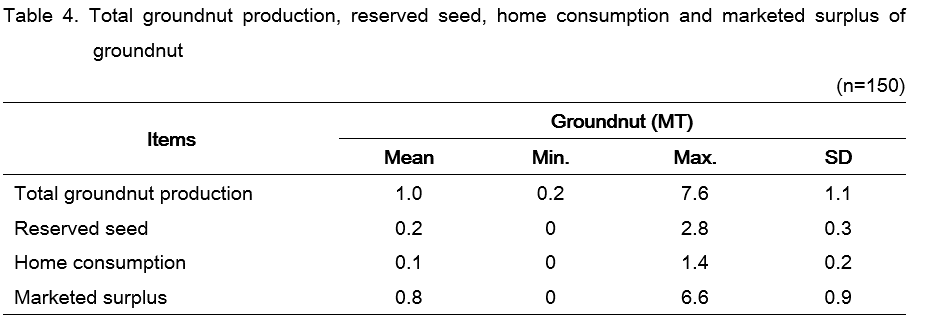
The average production of groundnut per unit household was 1.0 metric tons. And, the average reserved seed of total cultivated areas per household was 0.2 metric ton and the maximum reserved seed was 2.8 metric tons. Some households sold total groundnut products without reserving the seed for next season. The average amount of total cultivated areas for home consumption was 0.1 metric ton and the maximum was 1.4 metric tons. However, some households could not reserve part of their production for home consumption. The average marketed surplus of total cultivated areas per household was 0.8 metric ton and the maximum was 6.6 metric tons. In the case of marketed surplus, there was also no surplus for some sample farmers as they consumed and reserved their total products (Table 4).
Value-added opportunities for groundnut and supply chain
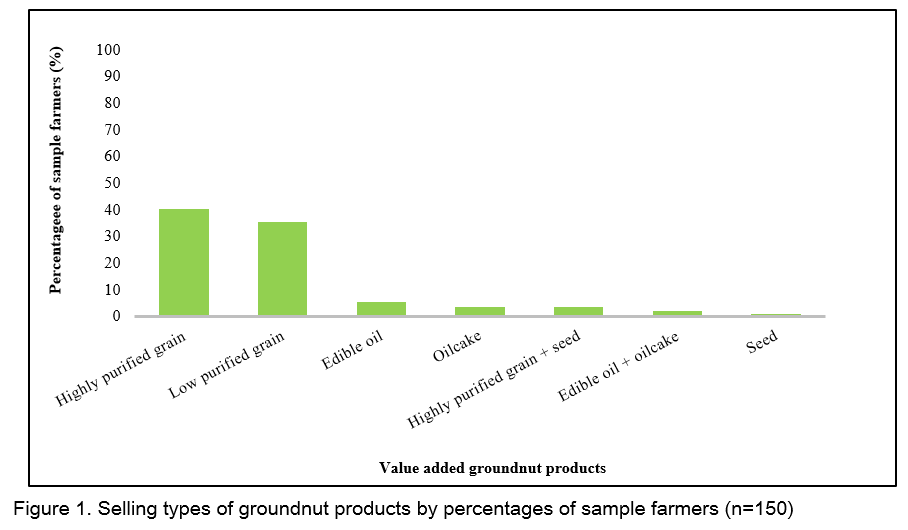
In the study area, groundnut-based value-added opportunities could be seen as low purified grains (which was obtained after hulling groundnut with shell (pod)), highly purified grains (which was obtained after cleaning groundnut without shell (low purified grains)), edible oil and oilcake, and seeds. Forty percent of sample farmers sold groundnut product as highly purified grains, and low purified grains and edible oil were sold by 35.3% and 5.3% of sample farmers. On the other hand, oilcake and highly purified grains plus seed were sold by both 3.3% of sample farmers respectively. Moreover, 2.0% and 0.8% of sample farmers sold edible oil plus oilcake and seeds (Figure 1). Particularly, sample farmers did not sell their products as pod in this study area.
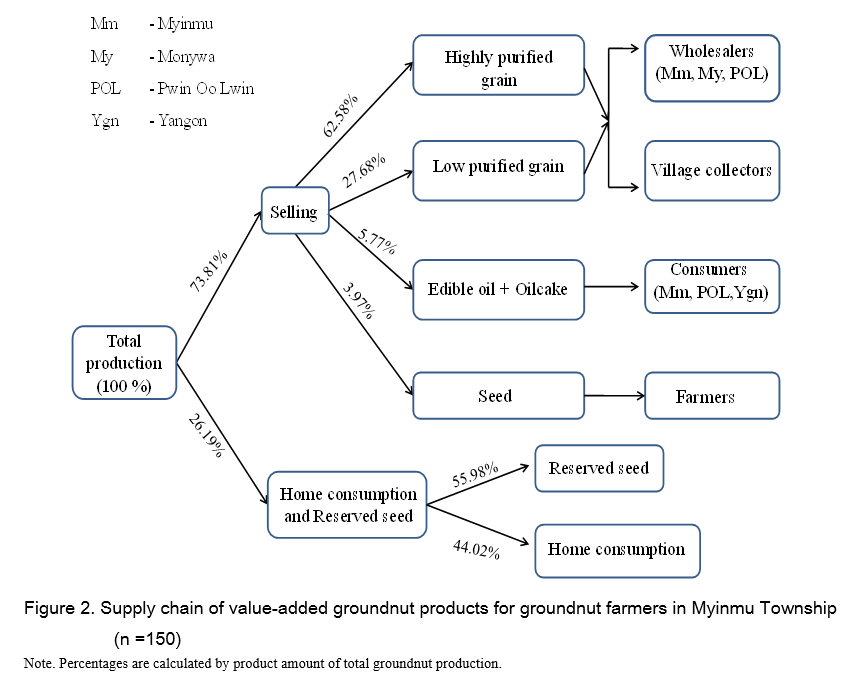
Although 73.81% of total groundnut production was sold by sample groundnut farmers, 26.19% of total groundnut production was excluded for home consumption and reserved seeds for next season. The marketed surplus of groundnut production consisted of 62.58% as highly purified grains, 27.68% as low purified grains, 5.77% as edible oil and oilcake and 3.97% as seeds. These products were sold to village collectors, consumers and wholesalers from Myinmu, Monywa, and Mandalay (Figure 2).
Gross margin analysis of groundnut production by sample groundnut farmers
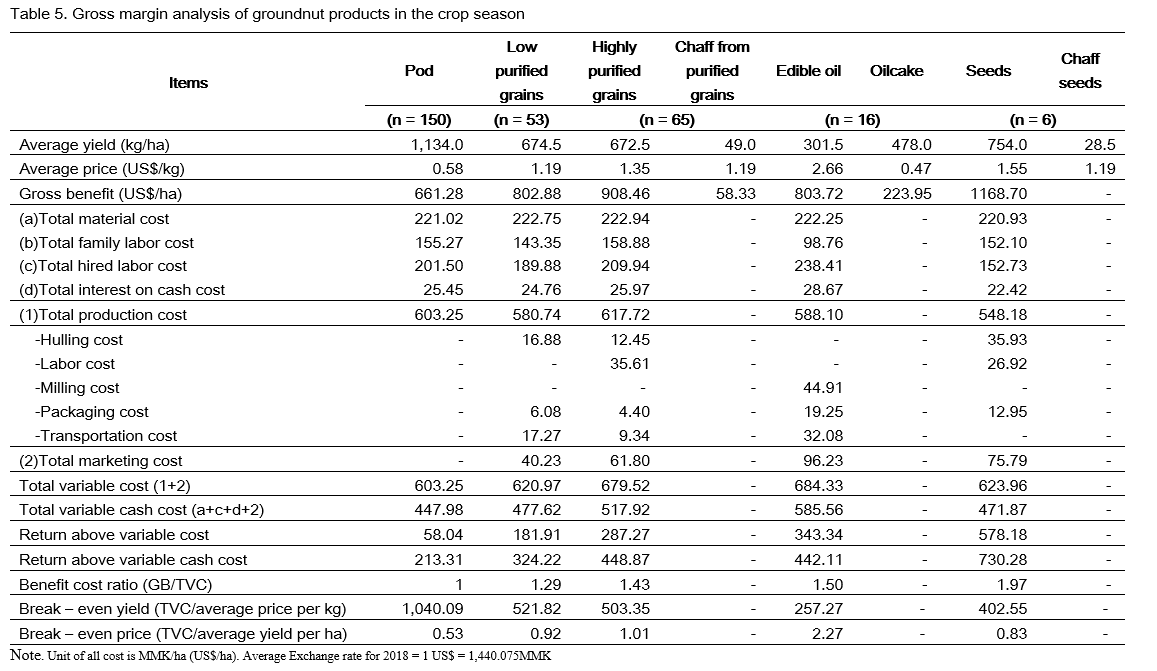
Gross margin analysis of groundnut production for raw product and value-added groundnut products was indicated in Table 5.
Total variable cost of production included material input costs, hired labor costs, opportunities costs for family labor, interest on cash cost and marketing cost. Material input costs included the costs for seeds, insecticides, fungicides, herbicides, compound fertilizer, urea, gypsum, farm yard manure (FYM) and foliar fertilizers. Family labor costs and hired labor costs included the costs for ploughing, harrowing, sowing, thinning, intercultivation, insecticide application, fertilizer application, harvesting, transportation and drying. Interest on cash cost consisted of interest rate on material cost and hired labor cost. Total marketing cost included the costs for hulling, labor, packaging and transportation. Return of groundnut production included the yield per hectare, return from sale with average current price of groundnut during that period.
In this calculation, the smallest benefit cost ratio (BCR) of pod was 1.0. It indicated that the return per unit equal to return above variable cost of pod, because it was sold as a raw product without transaction to value added product and lower yield in the study period than other period. The largest BCR was 1.97 from selling as seed. It pointed out that return per unit capital invested was 0.97 after all. So, seed production was economical for sample groundnut farmers.
In comparison of break-even yield and break-even price of pods, low purified grains, highly purified grains, edible oil and seeds, the largest and smallest break-even yield were pods (1,040.09 kg/ha) and seeds (402.55 kg/ha). And also, the break-even price of pods and seeds were 0.53 and 0.83 US$/kg. It means that total revenue is equal to total cost.
Marketing margin, marketing cost and profit of sample groundnut farmers
The services of various agencies constituting in a supply chain are remunerated out of the marketing “margin”. This term is used to denote the difference between the price paid to the first seller and that paid by the final buyer (Kohls, 2002). Trends in commodity prices and domestic marketing margins are important indicators of market performances. In this section the marketing margins of groundnut was examined.
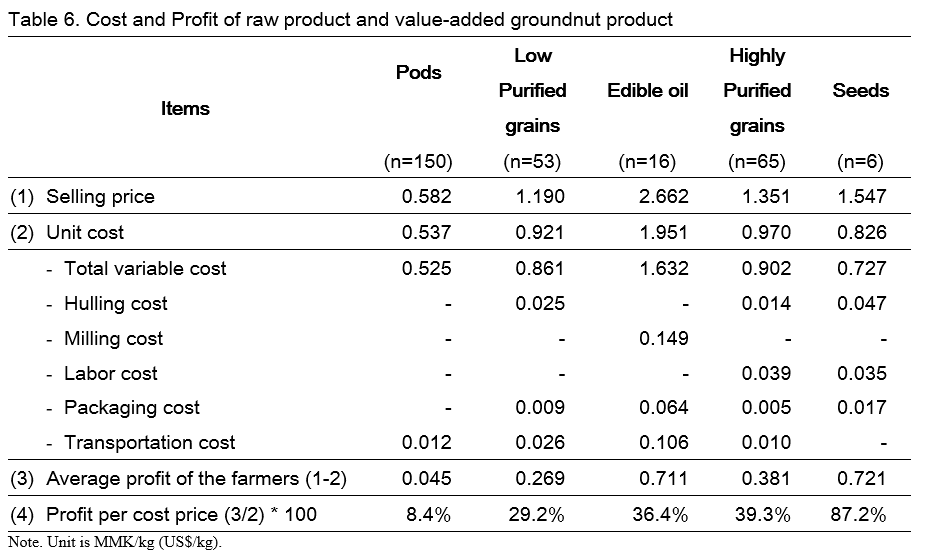
In the marketing channel, the commodity types handled by the middlemen were different. For example, the wholesalers handled the commodity as the groundnut seeds and the consumers handled the commodity as edible oil and oilcake, and seed. Groundnut seeds were differentiated into two types such as highly purified grains and low purified grains. Therefore, the percentage of profit per cost price was used to analyze the specific groundnut products of sample farmers were presented in Table 6.
In calculating the different margins, the production cost and the price received from selling as pods were 0.537 US$/kg and 0.582 US$/kg. So, the net return was 0.045 US$/kg. The price received from selling as low purified grains was 1.190 US$/kg, while production cost was 0.921 US$/kg. Therefore, the net return was 0.269 US$/kg. Then, farmers received from selling price of edible oil was 2.662 US$/kg, while the production cost was 1.951 US$/kg and therefore, the net return was 0.711 US$/kg. The production costs and price received from selling of highly purified grains were 0.970 US$/kg and 1.351 US$/kg while the net return was 0.381 US$/kg. Moreover, the transaction cost and the price received from selling as seed were 0.826 US$/kg and 1.547 US$/kg. Therefore, the net return was 0.721 US$/kg.
The farmers received 8.4% of profit per cost price by selling as pod, about 29.2% for selling as low purified grains, and 36.4% from selling as edible oil and oilcake. The higher profit per cost price 39.3% and 87.2% were received by selling as highly purified grains and seeds (Table 6). According to the marketing cost and marketing margin analysis, farmers earned the highest profit share by selling of seed for any variety.
SUMMARY AND CONCLUSION
This study attempted to identify the marketing margin of value-added products of groundnut farmers in Myinmu Township. In the study area, value-added processing opportunities were found in sample groundnut farmers with the products of low purified grains, highly purified grains, edible oil and oilcake, and seeds. Particularly, sample farmers did not sell their products as raw products (pods). Moreover, in total production of groundnut, the marketed surplus was larger than the reserved seeds for sowing in next season and home consumption in the study area. As a result, majority of sample farmers sold their products after keeping a required amount of reserved seeds and home consumption.
According to the cost and return analysis, total variable cost of highly purified grains was higher than other groundnut products during the crop season. Additionally, gross benefit of seeds was higher than others due to the higher price received. The benefit cost ratio of pods, low purified grains and highly purified grains were 1.0, 1.29 and 1.43. And, the benefit cost ratio of edible oil and seeds were 1.50 and 1.97. Among them, the BCR of seeds was the highest (1.97) and resulted in 0.97 returns per unit capital invested. This means that farmers can earn profit about one unit from groundnut production if US$ 1.0 invested on variable cash cost. Therefore, net return for capital invested was US$ 0.97. Therefore, the results showed that seed production was economically more attractive for farmers than other groundnut products during the study period.
As the result of the marketing costs and marketing margin analysis of the raw product (pod), and value- added groundnut products, seeds obtained the highest percent of profit per cost price (87.2%), much higher than that of selling of low purified grains (29.2%), edible oil (36.4%), and highly purified grains (39.3%). Therefore, groundnut farmers should consider creating value-added products of groundnuts instead of selling their raw products to earn more profit. This study pointed out that seeds as well as highly purified grains, and edible oil and oilcake were more profitable value-added groundnut products in the study area.
REFERENCES
Bindhya, D. and Anita K. (2015). Peanut processing and it’s potential food applications. International Journal of Science and Research (IJSR). Vol. 4. 6. 6 (1). 2319-7064.
MOALI. (2017). Myanmar Agriculture at a glance, Department of Planning. Ministry of Agriculture, Livestock and Irrigation, Myanmar.
Olufokunbi, B. (1982). Marketing margin analysis as a tool for decision making: The case of marketing Guinea Corn and Yam in Kaduna and Kano states of Nigeria. Oxford Agrarian Studies, 11(1), 48-64. Retrieved from https://doi.org/10. 1080/13600818208423922
Olson, K. (2003). Farm management principles and strategies. The textbook of farm management: principles and strategies.
Richard L. K. and Joseph N. U. (2002). Marketing of Agricultural Products. 9th edition. Upper Saddle River, N.J: Prentice Hall.


Marketing Margin of Groundnut Value-Added Products of Groundnut Farmers in Myinmu Township, Sagaing Region, Myanmar
ABSTRACT
In Myanmar, major oilseed crops are groundnut, sesame, sunflower, mustard and niger. Among the oilseed crops, groundnut is one of the most popular edible oil and protein producing crops in the world. The study attempted to analyze marketing margin of groundnut value-added products of groundnut farmers in the study area. A total of 150 sample groundnut farmers were chosen with purposive random sampling method in Myinmu Township, Sagaing Region in 2018. In the data analysis, descriptive analysis, cost and return analysis and marketing margin analysis were used. The findings indicated that sample groundnut farmers received the highest benefit cost ratio (BCR) from selling as seeds (1.97) and the lowest BCR from selling as pods (1.0) during the crop season. Although 73.81% of total groundnut production was sold by sample groundnut farmers, 26.19% of total groundnut production was excluded for home consumption and reserved seeds for next season. The marketed surplus of groundnut production consisted of highly purified grains (62.58%), low purified grains (27.68%), edible oil and oilcake (5.77%), and seed (3.97%). In marketing margin analysis, selling of groundnut seeds received the highest profit share (87.20%), followed by selling highly purified grains (39.30%), edible oil and oilcake (36.40%), low purified grains (29.2%) and pods (8.40%). Moreover, the profit per cost price of seed received the higher profit share than the other groundnut products. More processing steps contributed significantly to more profits. The results indicate that value adding is potential business for better income and profit of groundnut farmers. Therefore, groundnut farmers should consider embarking on creating value-added products of groundnut instead of merely selling raw products to earn more profits.
Keywords: Groundnut, value-added, marketing margins, Myinmu Township, Sagaing Region, Myanmar.
INTRODUCTION
In Myanmar, oilseed crops play a vital role due to high consumption of cooking oil compared to its neighbouring countries. The contribution of oilseed crops also plays a substantial role in Myanmar’s agricultural sector and domestic agricultural product markets as well as in international markets. Fifteen percent of the total crop sown area is covered with oilseeds which include sesame, groundnut, sunflower, mustard, niger etc. In many parts of central Myanmar, oilseeds, particularly sesame and groundnut stand for an important part in ensuring food security and providing cash income for education, health and other social necessities (MOALI, 2017).
Among the oilseed crops, groundnut is one of the most popular edible oil and protein producing crops in the world. Most of the groundnuts grown in the world are used to produce oil, groundnut butter, confectionaries, roasted groundnuts and snack products, extenders in meat product formulations, soups and desserts. Groundnut is directly consumed as raw nut or in processed form based on the different value chains (Dhanesh & Kochhar, 2015).
In Myanmar, groundnut cultivation occupies the second largest areas with the highest production among the oilseed crops. Myinmu Township is the largest area of groundnut production in Sagaing District of Myanmar. Opportunities can be explored by processing value-added products of groundnut. Groundnut farmers can increase income by processing value-added products of groundnut instead of selling raw product. Profitability is a significant consideration for farmers in processing value-added products of groundnut. Therefore, this study aims to analyze the marketing margin of groundnut value-added products of groundnut farmers in Myinmu Township, Sagaing Region. There are two specific objectives in this study:
Research methodology
This study interviewed sample groundnut farmers during the period from November to December, 2018. Both primary and secondary sources of data were used in this study. As the primary data, a total 150 farm households were selected by using purposive random sampling technique and were interviewed with a structured questionnaires. Secondary data were taken from the published papers, official records, and other related theses from Ministry of Agriculture, Livestock and Irrigation (MOALI), Department of Agriculture (DOA) and Yezin Agricultural University (YAU) library.
Both qualitative and quantitative data were firstly compiled in the Microsoft Excel Program. Descriptive analysis, cost and return analysis, and marketing cost and marketing margin analysis were used in this study. The descriptive statistics were analyzed by using diagrams, percentages, frequencies, means and standard deviations in examining the value-added groundnut processing opportunities as well as farmer’s socio-economic characteristics. The profit per cost price was used to analyze the performances of farmers. Cost and return analysis, and marketing cost and marketing margin analysis were calculated by using Microsoft excel and SPSS version 25.0 software. Cost and return analysis was as follows;
1.
Return above variable cash cost
= Total gross benefit - Total variable cash cost
2.
Return above variable cost
= Total gross benefit - Total variable cost
3.
Return per unit of capital invested
= Total gross benefit/Total variable cost
4.
Return per unit cash cost
= Total gross benefit/Total variable cash cost
5.
Benefit cost ratio
= Gross benefit/Total variable cost
(Olson, 2003)
Marketing margin was calculated by using following equations;
1.
Marketing margin
= Average selling price - Average buying price
2.
Profit
= Gross marketing margin - Total marketing cost
3.
Cost price
= Buying price + Total marketing cost
4.
Percentage of profit
= Profit / Cost price x 100
(Olufokunbi, 1982)
RESULTS AND DISCUSSION
Demographic characteristics of sample groundnut farmers
Demographic characteristics of sample groundnut farmers in the study area were presented in Table 1. In the study area, the average age of sample household heads was 56 years who obtained 7 schooling years and 33 years of farming experience on average. In the study area, all sample farmers owned upland farms with the average area of 6.9 hectares. Moreover, 44.6 % of sample farmers possessed 1.9 hectares of lowland, few sample farmers (5.3%) occupied 1.1 hectares of garden land, while 4.7% of sample farmers owned 2.2 hectares of alluvial soil (kaing/kyun) (Table 2).
It is expected that households with large farms would spread production costs across a large output leading to economies of scale. The average land holding size was 7.9 hectares. It ranged between 0.4 hectare and 30.4 hectares. The average groundnut sown area of sample farmers was 1.4 hectares ranging from 0.3 hectare and 8.1 hectares. The average yield of groundnut with shell (pod) was about 1.6 metric tons ranging from 0.2 metric ton and 11.3 metric tons (Table 3).
The average production of groundnut per unit household was 1.0 metric tons. And, the average reserved seed of total cultivated areas per household was 0.2 metric ton and the maximum reserved seed was 2.8 metric tons. Some households sold total groundnut products without reserving the seed for next season. The average amount of total cultivated areas for home consumption was 0.1 metric ton and the maximum was 1.4 metric tons. However, some households could not reserve part of their production for home consumption. The average marketed surplus of total cultivated areas per household was 0.8 metric ton and the maximum was 6.6 metric tons. In the case of marketed surplus, there was also no surplus for some sample farmers as they consumed and reserved their total products (Table 4).
Value-added opportunities for groundnut and supply chain
In the study area, groundnut-based value-added opportunities could be seen as low purified grains (which was obtained after hulling groundnut with shell (pod)), highly purified grains (which was obtained after cleaning groundnut without shell (low purified grains)), edible oil and oilcake, and seeds. Forty percent of sample farmers sold groundnut product as highly purified grains, and low purified grains and edible oil were sold by 35.3% and 5.3% of sample farmers. On the other hand, oilcake and highly purified grains plus seed were sold by both 3.3% of sample farmers respectively. Moreover, 2.0% and 0.8% of sample farmers sold edible oil plus oilcake and seeds (Figure 1). Particularly, sample farmers did not sell their products as pod in this study area.
Although 73.81% of total groundnut production was sold by sample groundnut farmers, 26.19% of total groundnut production was excluded for home consumption and reserved seeds for next season. The marketed surplus of groundnut production consisted of 62.58% as highly purified grains, 27.68% as low purified grains, 5.77% as edible oil and oilcake and 3.97% as seeds. These products were sold to village collectors, consumers and wholesalers from Myinmu, Monywa, and Mandalay (Figure 2).
Gross margin analysis of groundnut production by sample groundnut farmers
Gross margin analysis of groundnut production for raw product and value-added groundnut products was indicated in Table 5.
Total variable cost of production included material input costs, hired labor costs, opportunities costs for family labor, interest on cash cost and marketing cost. Material input costs included the costs for seeds, insecticides, fungicides, herbicides, compound fertilizer, urea, gypsum, farm yard manure (FYM) and foliar fertilizers. Family labor costs and hired labor costs included the costs for ploughing, harrowing, sowing, thinning, intercultivation, insecticide application, fertilizer application, harvesting, transportation and drying. Interest on cash cost consisted of interest rate on material cost and hired labor cost. Total marketing cost included the costs for hulling, labor, packaging and transportation. Return of groundnut production included the yield per hectare, return from sale with average current price of groundnut during that period.
In this calculation, the smallest benefit cost ratio (BCR) of pod was 1.0. It indicated that the return per unit equal to return above variable cost of pod, because it was sold as a raw product without transaction to value added product and lower yield in the study period than other period. The largest BCR was 1.97 from selling as seed. It pointed out that return per unit capital invested was 0.97 after all. So, seed production was economical for sample groundnut farmers.
In comparison of break-even yield and break-even price of pods, low purified grains, highly purified grains, edible oil and seeds, the largest and smallest break-even yield were pods (1,040.09 kg/ha) and seeds (402.55 kg/ha). And also, the break-even price of pods and seeds were 0.53 and 0.83 US$/kg. It means that total revenue is equal to total cost.
Marketing margin, marketing cost and profit of sample groundnut farmers
The services of various agencies constituting in a supply chain are remunerated out of the marketing “margin”. This term is used to denote the difference between the price paid to the first seller and that paid by the final buyer (Kohls, 2002). Trends in commodity prices and domestic marketing margins are important indicators of market performances. In this section the marketing margins of groundnut was examined.
In the marketing channel, the commodity types handled by the middlemen were different. For example, the wholesalers handled the commodity as the groundnut seeds and the consumers handled the commodity as edible oil and oilcake, and seed. Groundnut seeds were differentiated into two types such as highly purified grains and low purified grains. Therefore, the percentage of profit per cost price was used to analyze the specific groundnut products of sample farmers were presented in Table 6.
In calculating the different margins, the production cost and the price received from selling as pods were 0.537 US$/kg and 0.582 US$/kg. So, the net return was 0.045 US$/kg. The price received from selling as low purified grains was 1.190 US$/kg, while production cost was 0.921 US$/kg. Therefore, the net return was 0.269 US$/kg. Then, farmers received from selling price of edible oil was 2.662 US$/kg, while the production cost was 1.951 US$/kg and therefore, the net return was 0.711 US$/kg. The production costs and price received from selling of highly purified grains were 0.970 US$/kg and 1.351 US$/kg while the net return was 0.381 US$/kg. Moreover, the transaction cost and the price received from selling as seed were 0.826 US$/kg and 1.547 US$/kg. Therefore, the net return was 0.721 US$/kg.
The farmers received 8.4% of profit per cost price by selling as pod, about 29.2% for selling as low purified grains, and 36.4% from selling as edible oil and oilcake. The higher profit per cost price 39.3% and 87.2% were received by selling as highly purified grains and seeds (Table 6). According to the marketing cost and marketing margin analysis, farmers earned the highest profit share by selling of seed for any variety.
SUMMARY AND CONCLUSION
This study attempted to identify the marketing margin of value-added products of groundnut farmers in Myinmu Township. In the study area, value-added processing opportunities were found in sample groundnut farmers with the products of low purified grains, highly purified grains, edible oil and oilcake, and seeds. Particularly, sample farmers did not sell their products as raw products (pods). Moreover, in total production of groundnut, the marketed surplus was larger than the reserved seeds for sowing in next season and home consumption in the study area. As a result, majority of sample farmers sold their products after keeping a required amount of reserved seeds and home consumption.
According to the cost and return analysis, total variable cost of highly purified grains was higher than other groundnut products during the crop season. Additionally, gross benefit of seeds was higher than others due to the higher price received. The benefit cost ratio of pods, low purified grains and highly purified grains were 1.0, 1.29 and 1.43. And, the benefit cost ratio of edible oil and seeds were 1.50 and 1.97. Among them, the BCR of seeds was the highest (1.97) and resulted in 0.97 returns per unit capital invested. This means that farmers can earn profit about one unit from groundnut production if US$ 1.0 invested on variable cash cost. Therefore, net return for capital invested was US$ 0.97. Therefore, the results showed that seed production was economically more attractive for farmers than other groundnut products during the study period.
As the result of the marketing costs and marketing margin analysis of the raw product (pod), and value- added groundnut products, seeds obtained the highest percent of profit per cost price (87.2%), much higher than that of selling of low purified grains (29.2%), edible oil (36.4%), and highly purified grains (39.3%). Therefore, groundnut farmers should consider creating value-added products of groundnuts instead of selling their raw products to earn more profit. This study pointed out that seeds as well as highly purified grains, and edible oil and oilcake were more profitable value-added groundnut products in the study area.
REFERENCES
Bindhya, D. and Anita K. (2015). Peanut processing and it’s potential food applications. International Journal of Science and Research (IJSR). Vol. 4. 6. 6 (1). 2319-7064.
MOALI. (2017). Myanmar Agriculture at a glance, Department of Planning. Ministry of Agriculture, Livestock and Irrigation, Myanmar.
Olufokunbi, B. (1982). Marketing margin analysis as a tool for decision making: The case of marketing Guinea Corn and Yam in Kaduna and Kano states of Nigeria. Oxford Agrarian Studies, 11(1), 48-64. Retrieved from https://doi.org/10. 1080/13600818208423922
Olson, K. (2003). Farm management principles and strategies. The textbook of farm management: principles and strategies.
Richard L. K. and Joseph N. U. (2002). Marketing of Agricultural Products. 9th edition. Upper Saddle River, N.J: Prentice Hall.