ABSTRACT
Vietnam has become a middle-income country with diversified consumption structure and many challenges in food security. This study aims to identify food consumption trends and point out some policy implications for controlling food security in Vietnam. The study uses a 12-year series of survey data on the Vietnam Household Living Standard Survey (VHLSS) of the General Statistics Office from 2004 to 2016 to compare consumption trends in two major cities, Hanoi and Ho Chi Minh City. Research shows that their household living standards and food expenditure has risen in both cities. The average calorie per capita increases in both cities and is higher than the national level. The tendency of fruit consumption increased sharply, while vegetable consumption was relatively stable over time. Pork is the most common food in Vietnamese diets which tends to decrease in the amount and percentage of calorie contributions. In contrast, other protein-rich foods such as seafood and chicken have been on the rise, but the prices of these products are still relatively expensive and have increased dramatically over the years, especially seafood. The results of this study provide an important basis for recommendations on food security control policies in Vietnam.
Keywords: Access to food, essential foods, food security, nutrition, food prices
FOOD CONSUMPTION TRANSITION FROM “EAT FULLY, DRESS WARMLY” TO “EAT DELICIOUSLY, DRESS NICELY”
Vietnam's economy has made great achievements after more than 30 years from the "Doi Moi" policy in 1986, Vietnam has risen to join the group of middle income countries. People are richer and their diets also change gradually, from "eat fully, dress warmly" to "eat deliciously, dress nicely" (Hoang, 2009; Mishra and Ray, 2009). At the same time, Vietnamese people also face a large increase in non-communicable diseases such as overweight, obesity, and malnutrition. In order to overcome nutritional problems, the Government issued the "National Strategy on Nutrition for the period 2011 - 2020 and Vision to 2030" for comprehensive development of humans in terms of stature, physicality and intelligence as well as improving the quality of life (Ministry of Health, 2012).
According to the Food and Agriculture Organization of the United Nations (FAO), food security in the current context is a combination of four main factors: availability; accessibility; utility; and stability (FAO, 2008). In which, the stability of food security is constituted from the stability of the previous three factors. Availability is usually measured at the national level and represents the level of food supplies of the entire economy over the total population. Accessibility is considered at the household level (i.e. the food available in the family), and accessibility to food depends on socioeconomic characteristics, income, and expenditure of the household and the market price. In this paper, we focus on the food security approach in terms of usability and stability, i.e., access to food available at the household level and food prices associated with food expenditure. Accessibility will differ from usability, which is often recommended by nutritionists with regard to the macronutrients and micronutrients of foods. In this paper, the term “average available energy” is used to describe the level of calorie access in the household and takes into account the demographic characteristics of the household by the average in the two largest cities in Vietnam, Hanoi and Ho Chi Minh City.
RISK OF “URBAN POOR” AND FOOD SECURITY PROBLEM IN URBAN AREA
People change their diets for many reasons. First, the food problems in these two big cities are somewhat more complicated because economic development, urban development and food depend on the supply of neighboring cities. Second, the share of food expenditure in living expenses is still high (i.e., national average 52.6%) (General Statistics Office, 2016) and food continuation may be more difficult due to high cost of living in urban areas. Third, there is a growing gap between the rich and the poor in the big cities and the "urban poor" are facing more food security and nutrition problems. Currently, there are no reports of food consumption in these two cities over a long time. Therefore, this study has four main contributions: i) the availability and stability of food security is proposed and illustrated through two major cities of Vietnam; ii) this study compares the real situation and trends of food consumption in the two cities, from 2004 to 2016; iii) This study implies policy to national food security and promote research on food consumption and nutrition in the National Nutrition Action Plan to 2020 (Ministry of Health, 2018); iv) This study applies data science in order to support National Action Program "Zero Hunger" in Vietnam until 2025 (Government, 2018).
INCREASING EXPENDITURE FOR ESSENTIAL FOODS
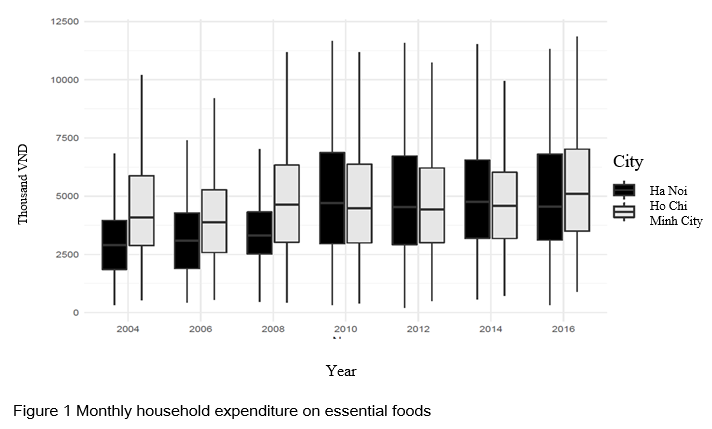
Figure 1 shows the amount of recurrent expenditure on household food over the years in the two cities. In general, the average monthly food expenditure increased over the years, from 2004 to 2016. The level of food spending in Ho Chi Minh City was higher than in Hanoi in 2004, 2006, 2008 and 2016. In the remaining years, the food expenditure levels of the two cities were similar. Using the fixed price in 2016, the average in each city and each year, each household spent an average of 85 USD to 257 USD per month. However, food expenditure is also varied among households in each year, from 21 USD to 514 USD on average. Furthermore, the common value (i.e., from the 25% to 75%) ranges from 107 USD to 300 USD. Trinh et al. (2018b) indicated that the average spending on food in the whole country in 2014 was double that of 2004. Thus, the increase in these two big cities is lower than the average rate in nationwide terms.
MORE CALORIE AND NUTRITIOUS CONSUMPTION IN FAMILY
The amount of calorie consumed in the data series of the VHLSS is the level of calorie available in the households. Meanwhile, the energy consumption from the National Institute of Nutrition comes from the 24-hour diet survey. Although the VHLSS dataset may show the above differential results, this dataset is still used to assess the level of food security in developing countries, including Vietnam (Deaton, 1997). This study uses the same average energy method at the national level (Trinh et al. 2018a). Overall, the average energy consumption in both cities has steadily increased over the past 12 years. The energy consumption of Ho Chi Minh City is always higher than that of Hanoi, except for 2010. From 2004 to 2016, compared to Trinh et al. (2018a), the average energy consumption in both cities are between 1.2% and 4% higher than the national average (except for 2010 and Hanoi with lower average than the national average).
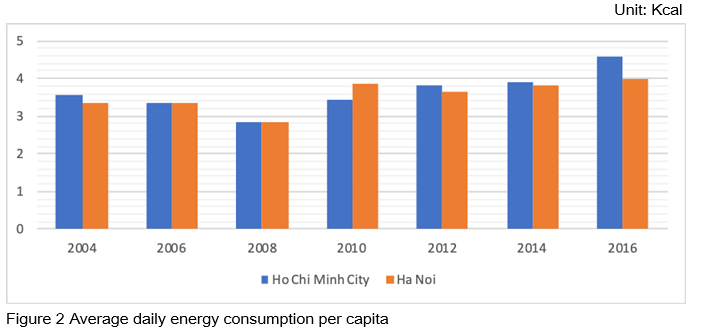
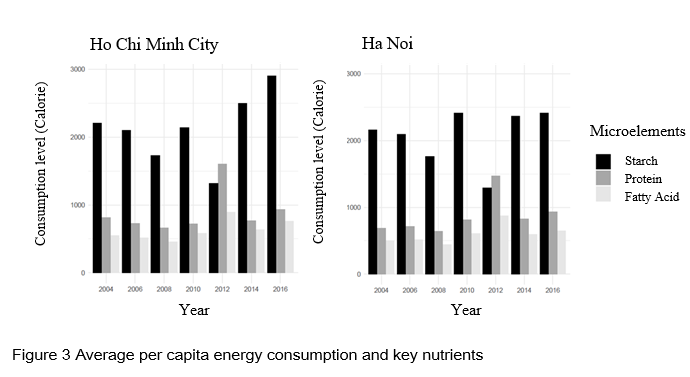
Figure 3 shows the average per capita of macronutrients consumption in the two cities over the years. In general, starch-derived energy plays the most important role in the diets in both cities. This trend is similar to the general trend of the entire Vietnamese people (Trinh et al., 2018b). The general trends in both cities are: i) The average of the three main nutrients (starch, protein and fat) per capita has increased steadily over the years from 2004 to 2016; ii) In 2008, in the same trend as energy per capita decreased, energy from all three main nutrients also decreased; iii) Protein-derived energy makes up the smallest of all three main nutrients. In addition, energy derived from fat peaked in 2012. Regarding the comparison between the two cities, in general, the consumption of the three macronutrients in Ho Chi Minh City is greater than that in Hanoi in all years. However, the differences in calorie derived from fat and protein of the two cities are not much different. Ho Chi Minh City tends to consume more starch than Hanoi in recent times.
INCREASE IN FRUIT CONSUMPTION, WHILE SLIGHT REDUCTION IN VEGETABLE AND SOME TYPES OF MEATS
This section examines the current state of food consumption, in terms of per capita, and the food prices of the two major cities. From different foods, focus on the following main food groups: i) Vegetables including beans, leafy vegetables (water spinach, mosquito net, etc.), cabbage, kohlrabi, tomatoes and other vegetables; ii) Fruits including oranges, bananas, mangoes and other fruits (rambutan, melon, papaya, lychee, guava, grapes, ...); iii) Pork (including all pork and lean meat equivalent); iv) Poultry meat, including chicken, duck and other poultry; v) Aquatic products: Fresh fish shrimp, processed dried fish and shrimp and other seafood.
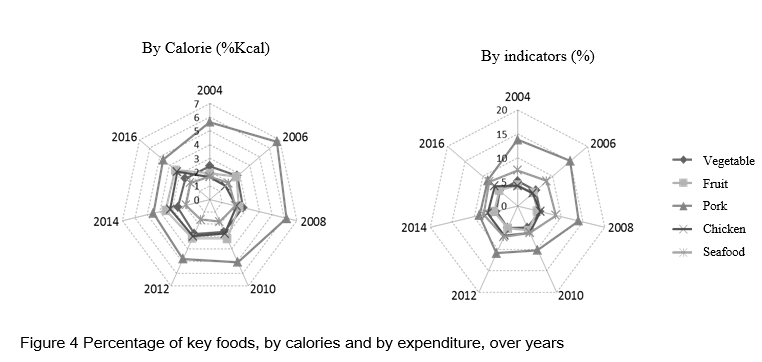
Figure 4 shows the percentages of the main foods in the diet, in terms of energy levels and consumption, from 2004 to 2016. In terms of energy levels, overall, energy derived from vegetables and poultry increased, while energy derived from meat decreased. Specifically, the energy derived from the fruit increased sharply from 1.90% to 3.44%. Energy derived from vegetables increased slightly. In particular, pork-derived energy has decreased significantly from 2004 to 2016. Pork-derived energy decreased from 5.65% in 2004 to 4.65% in 2016, while the amount derived from poultry types increased from 1.64% in 2004 to 3.25% in 2016. In terms of spending on major food groups, pork and seafood make up the largest share of household expenditure in all years. However, spending on pork has plummeted by nearly half, from 13.8% in 2004 to 8.56% in 2016. The largest amount of spending on pork corresponds to the largest amount of energy derived from pork. On the other hand, energy derived from seafood accounts for the smallest share of the main energy sources (except 2008), which shows that seafood is the most expensive in the two main cities of Vietnam’s energy source. Spending on fruits and poultry groups also increased significantly from 2004 to 2016. This shows that spending on main food groups is more diversified and balanced, while spending on vegetables remained relatively stable.
INCREASE IN ALL PRICE OF ESSENTIAL FOODS IN BIG CITIES
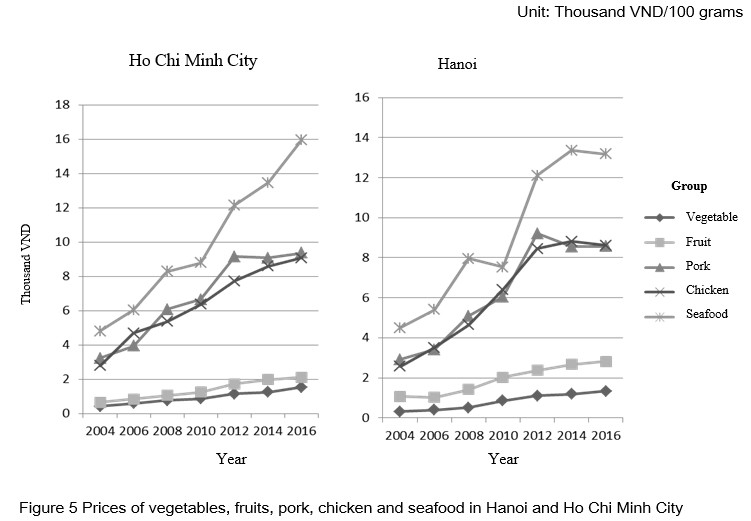
Finally, the prices of 100g of the main food groups are calculated. Using the unit of measure by gram or kg is reasonable with the buying - selling mentality of Vietnamese people is in kg or grams without paying much attention to the nutritional content of foods. The price shown is the constant 2016 price. The price of food is very important, as it affects households' access to food, i.e. increase their spending or keep them stable. Figure 5 show that the prices of seafood, measured in both types of units, are the most expensive in years and have also increased the most. Overall, in both cities, there were more distinct food groups. The price of the seafood group is the most expensive. The pork and poultry categories are of average value and have more than doubled over the past 12 years. The price for 100 grams of fruit and vegetables has increased only slightly and is relatively stable. In 2004, seafood prices in the two cities were similar, however, over the years, seafood prices in Ho Chi Minh City were much more expensive than those in Hanoi. In particular, the price of fruit in Ho Chi Minh City increased very little over the years and less than in Hanoi. This may stem from the fact that Ho Chi Minh City has a diverse and abundant supply of fruit from the western provinces.
IMPLICATIONS FOR FOOD SECURITY CONTROL POLICY IN VIETNAM
The trend of people consuming food in the two cities has changed in a positive direction. The findings of this study imply food security control policy as follows: i) People tend to increase food spending, so it is necessary to continue educating household consumption in terms of diverse and full meals. At the same time, it is necessary to choose healthy foods associated with family’s economic conditions. In particular, the communication policy needs to be renovated in the digital age of 4.0; ii) People in the two cities tend to diversify animal-based foods such as seafood and chicken to replace pork. Thus, food security policy makers should have programs to assist producers in diversifying the supply of foods of animal and aquatic origin; iii) People tend to increase consumption of fruits, while consumption of vegetables is quite stable. However, preserving these foods is more difficult under hygienic and food safety conditions, which is a challenge for smallholders. Therefore, there is a need for effective food safety control policy for ensuring and monitoring to increase consumer confidence in the source of clean vegetables.
CONCLUSION
This study examines the consumption trends of some essential foods and their nutritional value in two major cities of Vietnam: Hanoi and Ho Chi Minh City, from 2004 to 2016 based on the data of the VLHSS. The findings indicated that food regularly consumed by households include two factors of food security: accessibility and sustainability. The study uses the method of calculating energy per capita, considering the age structure and gender of the household from the applied energy consumption of the whole household. There is also a rising household living standards, food spending has risen in both cities. The per capita energy availability increased in both cities and the supply of macronutrients increased. The study also focuses on analyzing consumption trends for 5 main food groups, including vegetables, fruits, pork, chicken and seafood shredders. Pork is the most common food of animal origin in Vietnamese diets with reduced energy expenditure and share. In contrast, other protein-rich foods like seafood and chicken are fortified. For the group of vegetables and fruits, the trend of fruit consumption increased sharply, while the consumption of vegetables was quite stable over time. However, the price of food of animal origin and seafood is still relatively expensive and has increased very high over the years, especially seafood. Seafood prices in Ho Chi Minh City increased higher than in Hanoi, while fruit prices tended to be mixed. This study provides several food security implications in Vietnam. These policy implications may contribute to the success of the Sustainable Development Goals (specifically Goals 1, 2 and 3) of the United Nations (SDGs). Moreover, this research is also a scientific document contribute to planning and implementing the National Action Program "Zero Hunger" in Vietnam until 2025 and this is also a basis for building policy for sustainable food security control in Vietnam.
REFERENCES
Ministry of Health, 2012. National Nutrition Strategy 2011 - 2020, Vision 2030, Hanoi.
Ministry of Health - Institute of Nutrition, 2013. Table of food ingredients in Vietnam. Medical Publishing House.
Ministry of Health, 2018. Decision No. 718 / QD-BYT on Approval of National Action Plan on Nutrition up to 2020, Hanoi. Retrieved October 30, 2018.
Government, 2012. Decision No. 226 / QD-TTg, dated February 22, 2012, on "Approval of the National Strategy for Nutrition for the 2011-2020 period and a vision to 2030".
Prime Minister, 2018. Decision No. 712 / QD-TTg on Promulgating the National Plan of Action "Zero Hunger" in Vietnam until 2025.
General Statistics Office, 2015. Decision No. 1095 / QD-TCTK, dated November 18, 2015 on the implementation of the Survey on living standards of the 2016 population.
General Statistics Office, 2016. Results of the Vietnam Household Living Standard Survey, Statistical Publishing House.Aguiar, M., & Hurst, E., 2013. Deconstructing life cycle expenditure. Journal of Political Economy, 121(3), 437-492.
Deaton, A., 1997. The analysis of household surveys: a microeconometric approach to development policy. The World Bank.
FAO, 2008. An Introduction to the Basic Concepts of Food Security, Published by the EC - FAO Food Security Program
FAO, IFAD and WFP, 2015. The State of Food Insecurity in the World 2015. Meeting the 2015 international hunger targets: taking stock of uneven progress. Rome, FAO.
Hoang, L. V., 2009. Analysis of calorie and micronutrient consumption in Vietnam, Technical report, DEPOCEN working paper 2009/14.
Nguyen, M.C. and Winters, P., 2011. The impact of migration on food consumption patterns: The case of Vietnam. Food policy, 36 (1), pp.71-87.
Mishra, V. and Ray, R., 2009. Dietary diversity, food security and undernourishment: the Vietnamese evidence. Asian Economic Journal, 23 (2), pp.225-247.
OECD, 2013. OECD framework for statistics on the distribution of household income. Consumption and wealth. Paris: OECD Publishing.
Trinh, H.T., Simioni, M. and Thomas-Agnan, C., 2018a. Assessing the nonlinearity of the calorie-income relationship: An estimation strategy–With new insights on nutritional transition in Vietnam. World Development, 110, pp.192-204.
Trinh, H.T., Morais, J., Thomas-Agnan, C. and Simioni, M., 2018b. Relations between socio-economic factors and nutritional diet in Vietnam from 2004 to 2014: New insights using compositional data analysis. Statistical methods in medical research, p.0962280218770223.
World Bank, 2018. http://data.worldbank.org/indicator/PA.NUS.FCRF?page=1.


A Comparative Study on the Tendency of Food Consumption and Implications for Food Security Control Policy in Vietnam
ABSTRACT
Vietnam has become a middle-income country with diversified consumption structure and many challenges in food security. This study aims to identify food consumption trends and point out some policy implications for controlling food security in Vietnam. The study uses a 12-year series of survey data on the Vietnam Household Living Standard Survey (VHLSS) of the General Statistics Office from 2004 to 2016 to compare consumption trends in two major cities, Hanoi and Ho Chi Minh City. Research shows that their household living standards and food expenditure has risen in both cities. The average calorie per capita increases in both cities and is higher than the national level. The tendency of fruit consumption increased sharply, while vegetable consumption was relatively stable over time. Pork is the most common food in Vietnamese diets which tends to decrease in the amount and percentage of calorie contributions. In contrast, other protein-rich foods such as seafood and chicken have been on the rise, but the prices of these products are still relatively expensive and have increased dramatically over the years, especially seafood. The results of this study provide an important basis for recommendations on food security control policies in Vietnam.
Keywords: Access to food, essential foods, food security, nutrition, food prices
FOOD CONSUMPTION TRANSITION FROM “EAT FULLY, DRESS WARMLY” TO “EAT DELICIOUSLY, DRESS NICELY”
Vietnam's economy has made great achievements after more than 30 years from the "Doi Moi" policy in 1986, Vietnam has risen to join the group of middle income countries. People are richer and their diets also change gradually, from "eat fully, dress warmly" to "eat deliciously, dress nicely" (Hoang, 2009; Mishra and Ray, 2009). At the same time, Vietnamese people also face a large increase in non-communicable diseases such as overweight, obesity, and malnutrition. In order to overcome nutritional problems, the Government issued the "National Strategy on Nutrition for the period 2011 - 2020 and Vision to 2030" for comprehensive development of humans in terms of stature, physicality and intelligence as well as improving the quality of life (Ministry of Health, 2012).
According to the Food and Agriculture Organization of the United Nations (FAO), food security in the current context is a combination of four main factors: availability; accessibility; utility; and stability (FAO, 2008). In which, the stability of food security is constituted from the stability of the previous three factors. Availability is usually measured at the national level and represents the level of food supplies of the entire economy over the total population. Accessibility is considered at the household level (i.e. the food available in the family), and accessibility to food depends on socioeconomic characteristics, income, and expenditure of the household and the market price. In this paper, we focus on the food security approach in terms of usability and stability, i.e., access to food available at the household level and food prices associated with food expenditure. Accessibility will differ from usability, which is often recommended by nutritionists with regard to the macronutrients and micronutrients of foods. In this paper, the term “average available energy” is used to describe the level of calorie access in the household and takes into account the demographic characteristics of the household by the average in the two largest cities in Vietnam, Hanoi and Ho Chi Minh City.
RISK OF “URBAN POOR” AND FOOD SECURITY PROBLEM IN URBAN AREA
People change their diets for many reasons. First, the food problems in these two big cities are somewhat more complicated because economic development, urban development and food depend on the supply of neighboring cities. Second, the share of food expenditure in living expenses is still high (i.e., national average 52.6%) (General Statistics Office, 2016) and food continuation may be more difficult due to high cost of living in urban areas. Third, there is a growing gap between the rich and the poor in the big cities and the "urban poor" are facing more food security and nutrition problems. Currently, there are no reports of food consumption in these two cities over a long time. Therefore, this study has four main contributions: i) the availability and stability of food security is proposed and illustrated through two major cities of Vietnam; ii) this study compares the real situation and trends of food consumption in the two cities, from 2004 to 2016; iii) This study implies policy to national food security and promote research on food consumption and nutrition in the National Nutrition Action Plan to 2020 (Ministry of Health, 2018); iv) This study applies data science in order to support National Action Program "Zero Hunger" in Vietnam until 2025 (Government, 2018).
INCREASING EXPENDITURE FOR ESSENTIAL FOODS
Figure 1 shows the amount of recurrent expenditure on household food over the years in the two cities. In general, the average monthly food expenditure increased over the years, from 2004 to 2016. The level of food spending in Ho Chi Minh City was higher than in Hanoi in 2004, 2006, 2008 and 2016. In the remaining years, the food expenditure levels of the two cities were similar. Using the fixed price in 2016, the average in each city and each year, each household spent an average of 85 USD to 257 USD per month. However, food expenditure is also varied among households in each year, from 21 USD to 514 USD on average. Furthermore, the common value (i.e., from the 25% to 75%) ranges from 107 USD to 300 USD. Trinh et al. (2018b) indicated that the average spending on food in the whole country in 2014 was double that of 2004. Thus, the increase in these two big cities is lower than the average rate in nationwide terms.
MORE CALORIE AND NUTRITIOUS CONSUMPTION IN FAMILY
The amount of calorie consumed in the data series of the VHLSS is the level of calorie available in the households. Meanwhile, the energy consumption from the National Institute of Nutrition comes from the 24-hour diet survey. Although the VHLSS dataset may show the above differential results, this dataset is still used to assess the level of food security in developing countries, including Vietnam (Deaton, 1997). This study uses the same average energy method at the national level (Trinh et al. 2018a). Overall, the average energy consumption in both cities has steadily increased over the past 12 years. The energy consumption of Ho Chi Minh City is always higher than that of Hanoi, except for 2010. From 2004 to 2016, compared to Trinh et al. (2018a), the average energy consumption in both cities are between 1.2% and 4% higher than the national average (except for 2010 and Hanoi with lower average than the national average).
Figure 3 shows the average per capita of macronutrients consumption in the two cities over the years. In general, starch-derived energy plays the most important role in the diets in both cities. This trend is similar to the general trend of the entire Vietnamese people (Trinh et al., 2018b). The general trends in both cities are: i) The average of the three main nutrients (starch, protein and fat) per capita has increased steadily over the years from 2004 to 2016; ii) In 2008, in the same trend as energy per capita decreased, energy from all three main nutrients also decreased; iii) Protein-derived energy makes up the smallest of all three main nutrients. In addition, energy derived from fat peaked in 2012. Regarding the comparison between the two cities, in general, the consumption of the three macronutrients in Ho Chi Minh City is greater than that in Hanoi in all years. However, the differences in calorie derived from fat and protein of the two cities are not much different. Ho Chi Minh City tends to consume more starch than Hanoi in recent times.
INCREASE IN FRUIT CONSUMPTION, WHILE SLIGHT REDUCTION IN VEGETABLE AND SOME TYPES OF MEATS
This section examines the current state of food consumption, in terms of per capita, and the food prices of the two major cities. From different foods, focus on the following main food groups: i) Vegetables including beans, leafy vegetables (water spinach, mosquito net, etc.), cabbage, kohlrabi, tomatoes and other vegetables; ii) Fruits including oranges, bananas, mangoes and other fruits (rambutan, melon, papaya, lychee, guava, grapes, ...); iii) Pork (including all pork and lean meat equivalent); iv) Poultry meat, including chicken, duck and other poultry; v) Aquatic products: Fresh fish shrimp, processed dried fish and shrimp and other seafood.
Figure 4 shows the percentages of the main foods in the diet, in terms of energy levels and consumption, from 2004 to 2016. In terms of energy levels, overall, energy derived from vegetables and poultry increased, while energy derived from meat decreased. Specifically, the energy derived from the fruit increased sharply from 1.90% to 3.44%. Energy derived from vegetables increased slightly. In particular, pork-derived energy has decreased significantly from 2004 to 2016. Pork-derived energy decreased from 5.65% in 2004 to 4.65% in 2016, while the amount derived from poultry types increased from 1.64% in 2004 to 3.25% in 2016. In terms of spending on major food groups, pork and seafood make up the largest share of household expenditure in all years. However, spending on pork has plummeted by nearly half, from 13.8% in 2004 to 8.56% in 2016. The largest amount of spending on pork corresponds to the largest amount of energy derived from pork. On the other hand, energy derived from seafood accounts for the smallest share of the main energy sources (except 2008), which shows that seafood is the most expensive in the two main cities of Vietnam’s energy source. Spending on fruits and poultry groups also increased significantly from 2004 to 2016. This shows that spending on main food groups is more diversified and balanced, while spending on vegetables remained relatively stable.
INCREASE IN ALL PRICE OF ESSENTIAL FOODS IN BIG CITIES
Finally, the prices of 100g of the main food groups are calculated. Using the unit of measure by gram or kg is reasonable with the buying - selling mentality of Vietnamese people is in kg or grams without paying much attention to the nutritional content of foods. The price shown is the constant 2016 price. The price of food is very important, as it affects households' access to food, i.e. increase their spending or keep them stable. Figure 5 show that the prices of seafood, measured in both types of units, are the most expensive in years and have also increased the most. Overall, in both cities, there were more distinct food groups. The price of the seafood group is the most expensive. The pork and poultry categories are of average value and have more than doubled over the past 12 years. The price for 100 grams of fruit and vegetables has increased only slightly and is relatively stable. In 2004, seafood prices in the two cities were similar, however, over the years, seafood prices in Ho Chi Minh City were much more expensive than those in Hanoi. In particular, the price of fruit in Ho Chi Minh City increased very little over the years and less than in Hanoi. This may stem from the fact that Ho Chi Minh City has a diverse and abundant supply of fruit from the western provinces.
IMPLICATIONS FOR FOOD SECURITY CONTROL POLICY IN VIETNAM
The trend of people consuming food in the two cities has changed in a positive direction. The findings of this study imply food security control policy as follows: i) People tend to increase food spending, so it is necessary to continue educating household consumption in terms of diverse and full meals. At the same time, it is necessary to choose healthy foods associated with family’s economic conditions. In particular, the communication policy needs to be renovated in the digital age of 4.0; ii) People in the two cities tend to diversify animal-based foods such as seafood and chicken to replace pork. Thus, food security policy makers should have programs to assist producers in diversifying the supply of foods of animal and aquatic origin; iii) People tend to increase consumption of fruits, while consumption of vegetables is quite stable. However, preserving these foods is more difficult under hygienic and food safety conditions, which is a challenge for smallholders. Therefore, there is a need for effective food safety control policy for ensuring and monitoring to increase consumer confidence in the source of clean vegetables.
CONCLUSION
This study examines the consumption trends of some essential foods and their nutritional value in two major cities of Vietnam: Hanoi and Ho Chi Minh City, from 2004 to 2016 based on the data of the VLHSS. The findings indicated that food regularly consumed by households include two factors of food security: accessibility and sustainability. The study uses the method of calculating energy per capita, considering the age structure and gender of the household from the applied energy consumption of the whole household. There is also a rising household living standards, food spending has risen in both cities. The per capita energy availability increased in both cities and the supply of macronutrients increased. The study also focuses on analyzing consumption trends for 5 main food groups, including vegetables, fruits, pork, chicken and seafood shredders. Pork is the most common food of animal origin in Vietnamese diets with reduced energy expenditure and share. In contrast, other protein-rich foods like seafood and chicken are fortified. For the group of vegetables and fruits, the trend of fruit consumption increased sharply, while the consumption of vegetables was quite stable over time. However, the price of food of animal origin and seafood is still relatively expensive and has increased very high over the years, especially seafood. Seafood prices in Ho Chi Minh City increased higher than in Hanoi, while fruit prices tended to be mixed. This study provides several food security implications in Vietnam. These policy implications may contribute to the success of the Sustainable Development Goals (specifically Goals 1, 2 and 3) of the United Nations (SDGs). Moreover, this research is also a scientific document contribute to planning and implementing the National Action Program "Zero Hunger" in Vietnam until 2025 and this is also a basis for building policy for sustainable food security control in Vietnam.
REFERENCES
Ministry of Health, 2012. National Nutrition Strategy 2011 - 2020, Vision 2030, Hanoi.
Ministry of Health - Institute of Nutrition, 2013. Table of food ingredients in Vietnam. Medical Publishing House.
Ministry of Health, 2018. Decision No. 718 / QD-BYT on Approval of National Action Plan on Nutrition up to 2020, Hanoi. Retrieved October 30, 2018.
Government, 2012. Decision No. 226 / QD-TTg, dated February 22, 2012, on "Approval of the National Strategy for Nutrition for the 2011-2020 period and a vision to 2030".
Prime Minister, 2018. Decision No. 712 / QD-TTg on Promulgating the National Plan of Action "Zero Hunger" in Vietnam until 2025.
General Statistics Office, 2015. Decision No. 1095 / QD-TCTK, dated November 18, 2015 on the implementation of the Survey on living standards of the 2016 population.
General Statistics Office, 2016. Results of the Vietnam Household Living Standard Survey, Statistical Publishing House.Aguiar, M., & Hurst, E., 2013. Deconstructing life cycle expenditure. Journal of Political Economy, 121(3), 437-492.
Deaton, A., 1997. The analysis of household surveys: a microeconometric approach to development policy. The World Bank.
FAO, 2008. An Introduction to the Basic Concepts of Food Security, Published by the EC - FAO Food Security Program
FAO, IFAD and WFP, 2015. The State of Food Insecurity in the World 2015. Meeting the 2015 international hunger targets: taking stock of uneven progress. Rome, FAO.
Hoang, L. V., 2009. Analysis of calorie and micronutrient consumption in Vietnam, Technical report, DEPOCEN working paper 2009/14.
Nguyen, M.C. and Winters, P., 2011. The impact of migration on food consumption patterns: The case of Vietnam. Food policy, 36 (1), pp.71-87.
Mishra, V. and Ray, R., 2009. Dietary diversity, food security and undernourishment: the Vietnamese evidence. Asian Economic Journal, 23 (2), pp.225-247.
OECD, 2013. OECD framework for statistics on the distribution of household income. Consumption and wealth. Paris: OECD Publishing.
Trinh, H.T., Simioni, M. and Thomas-Agnan, C., 2018a. Assessing the nonlinearity of the calorie-income relationship: An estimation strategy–With new insights on nutritional transition in Vietnam. World Development, 110, pp.192-204.
Trinh, H.T., Morais, J., Thomas-Agnan, C. and Simioni, M., 2018b. Relations between socio-economic factors and nutritional diet in Vietnam from 2004 to 2014: New insights using compositional data analysis. Statistical methods in medical research, p.0962280218770223.
World Bank, 2018. http://data.worldbank.org/indicator/PA.NUS.FCRF?page=1.