INTRODUCTION
Thailand is an agricultural country with a total area of about 51.31 million hectares. More than 23.88 million hectares are used for agricultural production, which is equivalent to 46.54% of the country’s total agriculture land (Ministry of Natural Resources and Environment, 2015). Among these, 96,099 hectares is vegetable production area which is equilivent to 0.45% of the total agriculture land in 2016 (FAOSTAT, 2018).
Thailand is among the top 10 agricultural exporters in the world, among these, the main exported vegetable is baby corn which accounts for a large part of world trade supplies. Recently, the development of Thai vegetables has focused on improving safety and quality of vegetable products to meet the demand of the buyers in the domestic market and the export of vegetable products to a higher standard market, especially, organic vegetable production. Thus, organic agriculture has become a major policy in the agricultural development of Thailand.
DEVELOPMENT OF VEGETABLE PRODUCTION
Harvested area, production and vegetable yield
The long-term trend in the vegetable producing areas fluctuated with a slight increase from 1999 - 2010 (Table 1), the increase in this stage came from expansion of production into new areas in the cooler regions of the North, Northeast and some arid regions (Prem Nath et al., 1999) but it has decreased significantly since 2011. However, vegetable production presented an increase thanks to the increase of the mean yield. It also improved yield from using higher levels of technology, such as the increased use of fertilizers, agronomic techniques, improved seeds and other planting materials.
Prem Nath et al. (1999) showed that by using hybrid vegetable seeds, it should be possible to double the yields. The reason why the current vegetable output is still approximately same as that of 2010 when the area of vegetables was the highest in Thailand. One the other hand, with improving productivity and yield, current situation is still faced with major challenges which are the overuse and improper use of chemicals in vegetable production by Thai farmers. Vegetables are very important foodstuffs but they account for the majority of pesticide residues and risks in every day diet (Charles Benbrook, 2008). Vegetables often have a short growth cycle so they have highest pesticides risks. As a result, the general public is more concerned about pesticide residues in vegetables than other fresh products (Nicetic et al., 2016). Thus, the demand for safe vegetables was increasing significantly day by day, especially in the context of increases in the income of people.
Table 1. Development of harvested area, production and yield of vegetable
|
Year
|
Area
(Ha)
|
Yield
(Hg/Ha)
|
Production
(Tonnes)
|
Year
|
Area
(Ha)
|
Yield
(Hg/Ha)
|
Production
(Tonnes)
|
|
1999
|
121,518
|
78,178
|
950,000
|
2008
|
126,785
|
84,233
|
1,067,949
|
|
2000
|
103,610
|
86,071
|
891,782
|
2009
|
126,225
|
85,352
|
1,077,361
|
|
2001
|
111,764
|
90,732
|
1,014,058
|
2010
|
128,185
|
85,615
|
1,097,452
|
|
2002
|
110,328
|
85,668
|
945,163
|
2011
|
111,933
|
98,380
|
1,101,192
|
|
2003
|
116,662
|
87,520
|
1,021,024
|
2012
|
103,991
|
115,072
|
1,196,646
|
|
2004
|
121,616
|
89,377
|
1,086,966
|
2013
|
88,940
|
115,012
|
1,022,921
|
|
2005
|
118,968
|
85,987
|
1,022,968
|
2014
|
85,984
|
114,952
|
988,402
|
|
2006
|
119,072
|
83,213
|
990,833
|
2015
|
91,830
|
113,558
|
1,042,804
|
|
2007
|
125,381
|
88,817
|
1,113,602
|
2016
|
96,099
|
113,268
|
1,088,490
|
Source: FAO statistic (2018)
DEVELOPMENT OF ORGANIC VEGETABLE PRODUCTION
In that context, NGOs and some business sectors saw the opportunities in organic trade. Thus, Thai organic agriculture is started by NGOs to support local farmers to adopt sustainable farming practices and the organic standards and certification system was also initiated by the early 1990s. Business started organic farming projects by transforming their farms into organic farms or supporting their farmers to convert from conventional to organic farming. After that, the Thai government has made strong efforts to promote organic agriculture. Its goal is not only to meet the needs of the domestic market but also to expand its exports to the European market where it has strict requirements on imports. The King had a program to encourage vegetable producers to grow vegetables without the use of any chemical inputs. There were several projects which were being initiated by the Ministry of Agriculture and some private organizations to produce and market chemical-free vegetables. The Department of Agriculture was also supporting farmers by providing net-houses to prevent insects without spraying during production. Most of the organic production system is simple and without the use of sophisticated farming technologies or machineries. Based on the report of Research Institue of Organic Agriculture FiBL, we can see clearly that agriculture area under organic production system is increasing over time. Until now, its area was 57,189 hectares in 2016 which is equivalent to 0.27% of total agriculture land, but it just only increased 0.16% after 10 years compared with 0.11% in 2006, therefore, its development is still quite slow. In addition, while total of organic agriculture was going up, organic vegetable area declined strongly trend, in the initial phase, there was a slight increase trend of organic vegetable area from 2004 to 2009 (Figure 1), but it has decreased strongly in 2010 from 2,892 hectares to 1,128 hectares, which was only half of the previous year and continued to decline three years later. In 2013, the area was 709 hectares and has been insignificantly increasing since 2013 then. The total area of organic vegetables in Thailand was 735 heactares in 2016.
Vegetables are the second most important organic crops after rice in Thaialnd. However, percentage of ogranic vegetable areas in total organic agriculture production have decreased significantly over time.
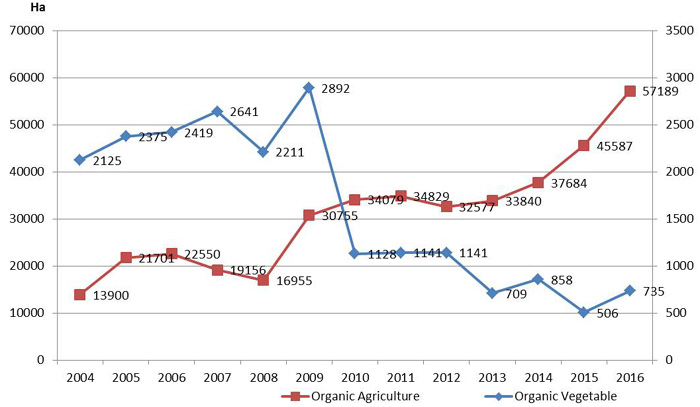
Fig. 1. Development of organic agriculture and vegetables
Source: Based on Reasearch Institue of Organic Agriculture FiBL (2007-2018)
In Fig. 2, we can see that in 2004, organic vegetable land share of the whole organic agriculture was 15.29%, but it was only around 1% in 2016. This trend reflected that there isn’t enough motivation for farmers to transfrom from conventional production to organic vegetable production systerm.
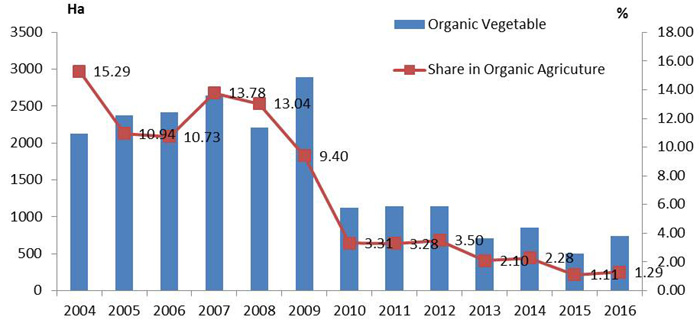
Fig. 2. Development of organic vegetable rate from 2004 to 2016
Source: Based on Reasearch Institue of Organic Agriculture FiBL (2007 -2018)
This trend has also contrasted with the development of vegetable areas in 2010. While the vegetatable areas have grown slightly, the areas of organic vegetables reduced dramatically. In 2009, organic vegetables area was 2.2% of the total area of vegetable production, but it was only 0.88% in 2010 and has only had a slight fluctuation from 2010 until now. In 2016, organic vegetable area accounts for 0.76% of total vegetable areas (Fig. 3).
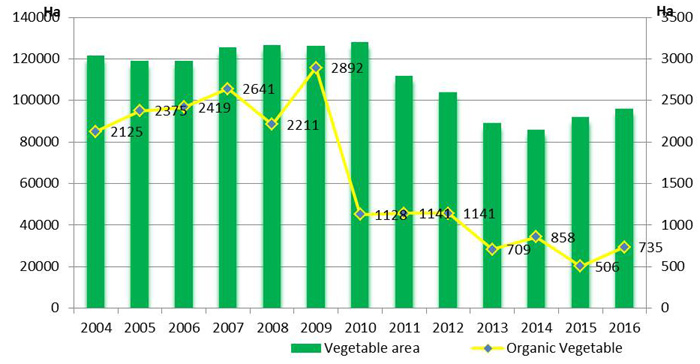
Fig. 3. Development of the areas of organic vegetable compared with vegetable area (2004-2016)
Source: FAOSTAT (2018) and Reasearch Institue of Organic Agriculture FiBL (2007 -2018)
This situation can be explained by the following reasons : Methods to prevent and control pests and diseases were difficult to be implemented such as IPM application, moreover, cost for pest control using IPM was high, while support for it is currently minimal, farmers still want to practice (Praneetvatakul et al., 2013). Methods such as using the net houses to prevent insects were considered as an effective method but its ability to cover larger ranges has been limited. Besides, most of the vegetable varieties are imported into local markets from different sources. Therefore, they have no resistance to most pests and diseases that are indigenous, which was why farmers wern’t able to grow successfully without chemical inputs. As a result, areas of organic vegetable s are decreasing over time.
Besides the decrease in organic vegetable areas, the number of this production also went down over time. There were 5,336.8 tons in 2007 but it went down to 1,330 in 2013, which led to a decrease in production value from 297.2 million Baht in 2007 to 53.2 million Baht in 2013 (Chaiwat Kongsom, Vitoon Panyakul, 2016).
Exported Thai vegetables to the world market
With the comparative advantage in production, Thailand is well placed to export to the world market. During the past few years, the exported value of Thai vegetable increased. However, it has a decreasing trend since 2016 because of the reduction in production (Figure 4).
The main export markets of Thailand vegetable are China with 77.5%, followed by Japan (7.4%) and Vietnam (1.2%) (Figure 5). Among these, China is the largest global market for Thai vegetable with 77.5% of total export values in 2017. The export value of vegetables to China has grown significantly from 2008 to 2015 and reached 85.4% in 2015 in total values of exported vegetables of Thailand.
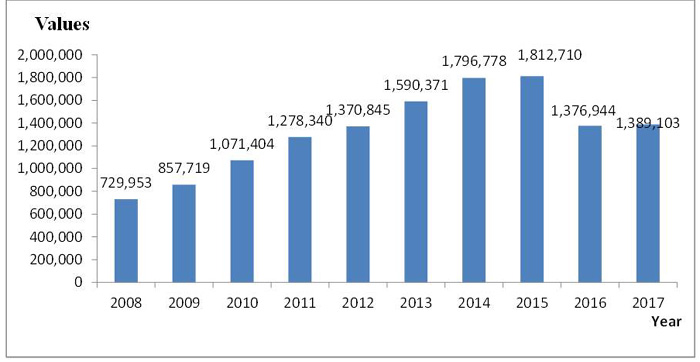
Fig. 4. Exported values of Thai Vegetable from 2008 to 2017 (US$)
Source: TRADEMAP (2018)
However, in recent three years, export value to China has a decreasing trend whereas Japan, and Vietnam had an increasing trend. Notably, the export value of some markets that have high requirements like Korea, Japan, Canada, Germany, Netherlands, and Singapore has been increasing over time (Fig. 5). This reflected that vegetable product of Thailand was increasing to reach the minimum requirement of higher requirement markets, and Thai government's efforts to develop vegetable quality has the positive sign.
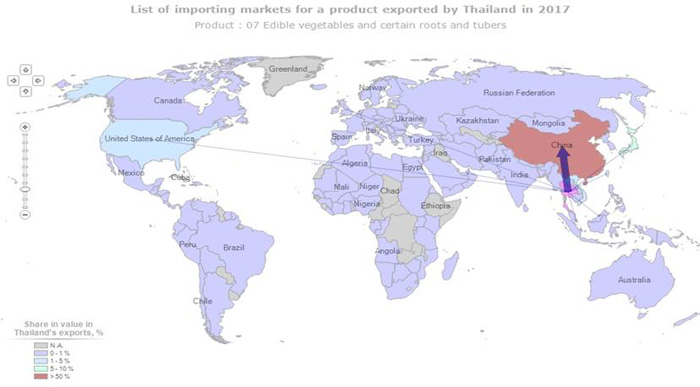
Fig. 5. Imported markets for vegetable by Thailand, 2018
Source: Trademap (2018)
For organic vegetable products
According to report of Green Net and Earth Net Foundation, they estimated the total market for certified organic produces in 2009 was US$ 135.44 million, around half of which was sold to domestic markets and the other half was exported. The export value was around THB 2,331.55 million (Euro 58.22 million) in 2014, of which exports accounting for 77.9% and the domestic market making up 22.06% (Chaiwat Kongsom, Vitoon Panyakul, 2016). This reflected that organic vegetable products in Thailand focused on export. Among these, the majority of fresh vegetables such as sweet corn kernels and lemongrass were sold in Thailand, while organic baby corns were all exported (Thai Organic Trade Associate, 2011).
Major importers of organic vegetables include Germany, Netherlands and United Kingdoms (Wyn Ellis et al., 2006). Demand in Japan and Singapore is also increasing significantly, with the Japanese market for organic farm goods expanding at the highest rate in the world.
CONCLUSION
Vegetable production in Thailand has a great potential in terms of the development of vegetable production and expansion to developed countries. Although the harvested area of vegetables in Thailand decreased slightly, Thai vegetables' yield had increasing trends. Thank to new seeds and high technology adoption, Vegetable production is not only increasing in yield but also quality, which is increasing in order to meet the high requirements of the markets like Germany, Japan, Netherlands, Singapore and Korea because of their focus on organic development. However, a major challenge in the development of Thai vegetables is climate change that has reduced production due to the decrease in land areas. Even when annual production increase rate is at least 2.1 % because of the increase in yield, it is still not high enough to keep pace with the rate of population growth rate which is at 1 % (Prem Nath et al, 1999). Besides, the demand for quality vegetable products is increasing day by day in both domestic and the world markets. Thus, Thailand should make an effort to produce organic vegetable product and develop high-technology applications to preserve post-harvest production in order to increase the quality and value of vegetables. Besides, the Thai government should have plans and instructions on climate change adaptation in vegetable production for farmers to adapt to drought.
REFERENCES
Chaiwat Kongsom, Vitoon Panyakul , (2016). Production and Market of Certified Organic Products in Thailand, Retrieved on February 12 from https://waset.org/publications/10005134/production-and-market-of-certified-organic-products-in-thailand
Charles Benbrook (2008). Simplifying the Pesticide Risk Equation: The Organic Option. Retrieved on March 30 from https://www.organic-center.org/reportfiles/Organic_Option_Final_Ex_Summary.pdf
Nicetic, O.;E. Van De Fliert . (2016). Good Agricultural Practice (GAP) as a vehicle for transformation to sustainable citrus production in the Mekong Delta of Vietnam.
Ministry of Natural Resources and Environment (2015). Second biennial update report of Thailand. Retrieved on August 26 from https://unfccc.int/files/national_reports/nonannex_i_parties/biennial_update_reports/submitted_burs/application/pdf/347251_thailand-bur2-1-sbur_thailand.pdf
FAOSTAT (2018). Harvested area , Yield and Production of Thailand vegetable. Retrieved on February 12 from http://www.fao.org/faostat/en/#data/QC
Prem Nath Prem Nath. Mr Minas Papademetriou, Dr Kasem Piluek and Dr Edward M Herath, (1999). The vegetable sector in Thailand a review. Retrieved on March 20, 2018 from http://www.fao.org/3/a-ac145e.pdf
Praneetvatakul, S., Schreinemachers, P., Pananurak, P., and Tipraqsa, P. (2013). Pesticides, external costs and policy options for Thai agriculture. Environmental Science & Policy 27, 103-113.
Reasearch Institue of Organic Agriculture FiBL, from (2007-2018), The World of Organic Agriculture - Statistics and Emerging Trends from 2007 -2018, from https://www.organic-world.net/yearbook/yearbook-2018.html
Thai Organic Trade Associate (2011). Overview of organic agriculture in Thailland, Retrieved on February 12 from http://www.thaiorganictrade.com/en/article/442
Trademap (2018). Exported value and quantity of vegetable in Thailand, 2018. Retrieved on February 12 from https://www.trademap.org/(X(1)S(vd0cte45ad1uke55hjeoyxn3))/Country_SelProductCountry_TS_Map.aspx?nvpm=1|764||||07|||2|1|1|2|2|1|2|4|1
Trademap (2018). List of importing markets for a product exported by Thailand Product: 07 Edible vegetables and certain roots and tubers from https://www.trademap.org/Country_SelProductCountry_TS_Map.aspx?nvpm=1|764||||07|||2|1|1|2|2|1|2|4|1
Wyn Ellis, Vitoon Panyakul, Daniel Vildozo, Alexander Kasterine (2006). Strengthening the export capacity of Thailand’s organic agriculture. Retrieved on February 12 from http://citeseerx.ist.psu.edu/viewdoc/download?doi=10.1.1.453.8386&rep=rep1&type=pdf
Date submitted: July 16, 2018
Reviewed, edited and uploaded: Sept. 10, 2018

Development of Vegetable Production and Organic Vegetable Production in Thailand
INTRODUCTION
Thailand is an agricultural country with a total area of about 51.31 million hectares. More than 23.88 million hectares are used for agricultural production, which is equivalent to 46.54% of the country’s total agriculture land (Ministry of Natural Resources and Environment, 2015). Among these, 96,099 hectares is vegetable production area which is equilivent to 0.45% of the total agriculture land in 2016 (FAOSTAT, 2018).
Thailand is among the top 10 agricultural exporters in the world, among these, the main exported vegetable is baby corn which accounts for a large part of world trade supplies. Recently, the development of Thai vegetables has focused on improving safety and quality of vegetable products to meet the demand of the buyers in the domestic market and the export of vegetable products to a higher standard market, especially, organic vegetable production. Thus, organic agriculture has become a major policy in the agricultural development of Thailand.
DEVELOPMENT OF VEGETABLE PRODUCTION
Harvested area, production and vegetable yield
The long-term trend in the vegetable producing areas fluctuated with a slight increase from 1999 - 2010 (Table 1), the increase in this stage came from expansion of production into new areas in the cooler regions of the North, Northeast and some arid regions (Prem Nath et al., 1999) but it has decreased significantly since 2011. However, vegetable production presented an increase thanks to the increase of the mean yield. It also improved yield from using higher levels of technology, such as the increased use of fertilizers, agronomic techniques, improved seeds and other planting materials.
Prem Nath et al. (1999) showed that by using hybrid vegetable seeds, it should be possible to double the yields. The reason why the current vegetable output is still approximately same as that of 2010 when the area of vegetables was the highest in Thailand. One the other hand, with improving productivity and yield, current situation is still faced with major challenges which are the overuse and improper use of chemicals in vegetable production by Thai farmers. Vegetables are very important foodstuffs but they account for the majority of pesticide residues and risks in every day diet (Charles Benbrook, 2008). Vegetables often have a short growth cycle so they have highest pesticides risks. As a result, the general public is more concerned about pesticide residues in vegetables than other fresh products (Nicetic et al., 2016). Thus, the demand for safe vegetables was increasing significantly day by day, especially in the context of increases in the income of people.
Table 1. Development of harvested area, production and yield of vegetable
Year
Area
(Ha)
Yield
(Hg/Ha)
Production
(Tonnes)
Year
Area
(Ha)
Yield
(Hg/Ha)
Production
(Tonnes)
1999
121,518
78,178
950,000
2008
126,785
84,233
1,067,949
2000
103,610
86,071
891,782
2009
126,225
85,352
1,077,361
2001
111,764
90,732
1,014,058
2010
128,185
85,615
1,097,452
2002
110,328
85,668
945,163
2011
111,933
98,380
1,101,192
2003
116,662
87,520
1,021,024
2012
103,991
115,072
1,196,646
2004
121,616
89,377
1,086,966
2013
88,940
115,012
1,022,921
2005
118,968
85,987
1,022,968
2014
85,984
114,952
988,402
2006
119,072
83,213
990,833
2015
91,830
113,558
1,042,804
2007
125,381
88,817
1,113,602
2016
96,099
113,268
1,088,490
Source: FAO statistic (2018)
DEVELOPMENT OF ORGANIC VEGETABLE PRODUCTION
In that context, NGOs and some business sectors saw the opportunities in organic trade. Thus, Thai organic agriculture is started by NGOs to support local farmers to adopt sustainable farming practices and the organic standards and certification system was also initiated by the early 1990s. Business started organic farming projects by transforming their farms into organic farms or supporting their farmers to convert from conventional to organic farming. After that, the Thai government has made strong efforts to promote organic agriculture. Its goal is not only to meet the needs of the domestic market but also to expand its exports to the European market where it has strict requirements on imports. The King had a program to encourage vegetable producers to grow vegetables without the use of any chemical inputs. There were several projects which were being initiated by the Ministry of Agriculture and some private organizations to produce and market chemical-free vegetables. The Department of Agriculture was also supporting farmers by providing net-houses to prevent insects without spraying during production. Most of the organic production system is simple and without the use of sophisticated farming technologies or machineries. Based on the report of Research Institue of Organic Agriculture FiBL, we can see clearly that agriculture area under organic production system is increasing over time. Until now, its area was 57,189 hectares in 2016 which is equivalent to 0.27% of total agriculture land, but it just only increased 0.16% after 10 years compared with 0.11% in 2006, therefore, its development is still quite slow. In addition, while total of organic agriculture was going up, organic vegetable area declined strongly trend, in the initial phase, there was a slight increase trend of organic vegetable area from 2004 to 2009 (Figure 1), but it has decreased strongly in 2010 from 2,892 hectares to 1,128 hectares, which was only half of the previous year and continued to decline three years later. In 2013, the area was 709 hectares and has been insignificantly increasing since 2013 then. The total area of organic vegetables in Thailand was 735 heactares in 2016.
Vegetables are the second most important organic crops after rice in Thaialnd. However, percentage of ogranic vegetable areas in total organic agriculture production have decreased significantly over time.
Fig. 1. Development of organic agriculture and vegetables
Source: Based on Reasearch Institue of Organic Agriculture FiBL (2007-2018)
In Fig. 2, we can see that in 2004, organic vegetable land share of the whole organic agriculture was 15.29%, but it was only around 1% in 2016. This trend reflected that there isn’t enough motivation for farmers to transfrom from conventional production to organic vegetable production systerm.
Fig. 2. Development of organic vegetable rate from 2004 to 2016
Source: Based on Reasearch Institue of Organic Agriculture FiBL (2007 -2018)
This trend has also contrasted with the development of vegetable areas in 2010. While the vegetatable areas have grown slightly, the areas of organic vegetables reduced dramatically. In 2009, organic vegetables area was 2.2% of the total area of vegetable production, but it was only 0.88% in 2010 and has only had a slight fluctuation from 2010 until now. In 2016, organic vegetable area accounts for 0.76% of total vegetable areas (Fig. 3).
Fig. 3. Development of the areas of organic vegetable compared with vegetable area (2004-2016)
Source: FAOSTAT (2018) and Reasearch Institue of Organic Agriculture FiBL (2007 -2018)
This situation can be explained by the following reasons : Methods to prevent and control pests and diseases were difficult to be implemented such as IPM application, moreover, cost for pest control using IPM was high, while support for it is currently minimal, farmers still want to practice (Praneetvatakul et al., 2013). Methods such as using the net houses to prevent insects were considered as an effective method but its ability to cover larger ranges has been limited. Besides, most of the vegetable varieties are imported into local markets from different sources. Therefore, they have no resistance to most pests and diseases that are indigenous, which was why farmers wern’t able to grow successfully without chemical inputs. As a result, areas of organic vegetable s are decreasing over time.
Besides the decrease in organic vegetable areas, the number of this production also went down over time. There were 5,336.8 tons in 2007 but it went down to 1,330 in 2013, which led to a decrease in production value from 297.2 million Baht in 2007 to 53.2 million Baht in 2013 (Chaiwat Kongsom, Vitoon Panyakul, 2016).
Exported Thai vegetables to the world market
With the comparative advantage in production, Thailand is well placed to export to the world market. During the past few years, the exported value of Thai vegetable increased. However, it has a decreasing trend since 2016 because of the reduction in production (Figure 4).
The main export markets of Thailand vegetable are China with 77.5%, followed by Japan (7.4%) and Vietnam (1.2%) (Figure 5). Among these, China is the largest global market for Thai vegetable with 77.5% of total export values in 2017. The export value of vegetables to China has grown significantly from 2008 to 2015 and reached 85.4% in 2015 in total values of exported vegetables of Thailand.
Fig. 4. Exported values of Thai Vegetable from 2008 to 2017 (US$)
Source: TRADEMAP (2018)
However, in recent three years, export value to China has a decreasing trend whereas Japan, and Vietnam had an increasing trend. Notably, the export value of some markets that have high requirements like Korea, Japan, Canada, Germany, Netherlands, and Singapore has been increasing over time (Fig. 5). This reflected that vegetable product of Thailand was increasing to reach the minimum requirement of higher requirement markets, and Thai government's efforts to develop vegetable quality has the positive sign.
Fig. 5. Imported markets for vegetable by Thailand, 2018
Source: Trademap (2018)
For organic vegetable products
According to report of Green Net and Earth Net Foundation, they estimated the total market for certified organic produces in 2009 was US$ 135.44 million, around half of which was sold to domestic markets and the other half was exported. The export value was around THB 2,331.55 million (Euro 58.22 million) in 2014, of which exports accounting for 77.9% and the domestic market making up 22.06% (Chaiwat Kongsom, Vitoon Panyakul, 2016). This reflected that organic vegetable products in Thailand focused on export. Among these, the majority of fresh vegetables such as sweet corn kernels and lemongrass were sold in Thailand, while organic baby corns were all exported (Thai Organic Trade Associate, 2011).
Major importers of organic vegetables include Germany, Netherlands and United Kingdoms (Wyn Ellis et al., 2006). Demand in Japan and Singapore is also increasing significantly, with the Japanese market for organic farm goods expanding at the highest rate in the world.
CONCLUSION
Vegetable production in Thailand has a great potential in terms of the development of vegetable production and expansion to developed countries. Although the harvested area of vegetables in Thailand decreased slightly, Thai vegetables' yield had increasing trends. Thank to new seeds and high technology adoption, Vegetable production is not only increasing in yield but also quality, which is increasing in order to meet the high requirements of the markets like Germany, Japan, Netherlands, Singapore and Korea because of their focus on organic development. However, a major challenge in the development of Thai vegetables is climate change that has reduced production due to the decrease in land areas. Even when annual production increase rate is at least 2.1 % because of the increase in yield, it is still not high enough to keep pace with the rate of population growth rate which is at 1 % (Prem Nath et al, 1999). Besides, the demand for quality vegetable products is increasing day by day in both domestic and the world markets. Thus, Thailand should make an effort to produce organic vegetable product and develop high-technology applications to preserve post-harvest production in order to increase the quality and value of vegetables. Besides, the Thai government should have plans and instructions on climate change adaptation in vegetable production for farmers to adapt to drought.
REFERENCES
Chaiwat Kongsom, Vitoon Panyakul , (2016). Production and Market of Certified Organic Products in Thailand, Retrieved on February 12 from https://waset.org/publications/10005134/production-and-market-of-certified-organic-products-in-thailand
Charles Benbrook (2008). Simplifying the Pesticide Risk Equation: The Organic Option. Retrieved on March 30 from https://www.organic-center.org/reportfiles/Organic_Option_Final_Ex_Summary.pdf
Nicetic, O.;E. Van De Fliert . (2016). Good Agricultural Practice (GAP) as a vehicle for transformation to sustainable citrus production in the Mekong Delta of Vietnam.
Ministry of Natural Resources and Environment (2015). Second biennial update report of Thailand. Retrieved on August 26 from https://unfccc.int/files/national_reports/nonannex_i_parties/biennial_update_reports/submitted_burs/application/pdf/347251_thailand-bur2-1-sbur_thailand.pdf
FAOSTAT (2018). Harvested area , Yield and Production of Thailand vegetable. Retrieved on February 12 from http://www.fao.org/faostat/en/#data/QC
Prem Nath Prem Nath. Mr Minas Papademetriou, Dr Kasem Piluek and Dr Edward M Herath, (1999). The vegetable sector in Thailand a review. Retrieved on March 20, 2018 from http://www.fao.org/3/a-ac145e.pdf
Praneetvatakul, S., Schreinemachers, P., Pananurak, P., and Tipraqsa, P. (2013). Pesticides, external costs and policy options for Thai agriculture. Environmental Science & Policy 27, 103-113.
Reasearch Institue of Organic Agriculture FiBL, from (2007-2018), The World of Organic Agriculture - Statistics and Emerging Trends from 2007 -2018, from https://www.organic-world.net/yearbook/yearbook-2018.html
Thai Organic Trade Associate (2011). Overview of organic agriculture in Thailland, Retrieved on February 12 from http://www.thaiorganictrade.com/en/article/442
Trademap (2018). Exported value and quantity of vegetable in Thailand, 2018. Retrieved on February 12 from https://www.trademap.org/(X(1)S(vd0cte45ad1uke55hjeoyxn3))/Country_SelProductCountry_TS_Map.aspx?nvpm=1|764||||07|||2|1|1|2|2|1|2|4|1
Trademap (2018). List of importing markets for a product exported by Thailand Product: 07 Edible vegetables and certain roots and tubers from https://www.trademap.org/Country_SelProductCountry_TS_Map.aspx?nvpm=1|764||||07|||2|1|1|2|2|1|2|4|1
Wyn Ellis, Vitoon Panyakul, Daniel Vildozo, Alexander Kasterine (2006). Strengthening the export capacity of Thailand’s organic agriculture. Retrieved on February 12 from http://citeseerx.ist.psu.edu/viewdoc/download?doi=10.1.1.453.8386&rep=rep1&type=pdf
Date submitted: July 16, 2018
Reviewed, edited and uploaded: Sept. 10, 2018