Introduction
Since 1961, the earth’s population has increased from three billion to seven billion and the global per capita income has risen three-fold. Although there has been a continuous decrease in farmland and farm labor—along with economic development and industrialization over the same period—agricultural production has been ever increasing to keep pace with human consumption. As such, present-day advancements in agricultural productivity and efficiency have become paramount in driving the economic development of agriculture.
In the 1960s, the Green Revolution spread around the world. Through high production hybrid variety research and extension, irrigation system infrastructure, and compound fertilizer and pesticide utilization, agricultural output increased 2.3% annually. Notably, there was a 3.4-3.8% rise in output in developing countries, which was more than the annual population growth rate of 1.7% over the same period (FAO, 2006). The success of the Green Revolution resulted in full food self-sufficiency in most Asian countries, which has been one of fastest global growth regions, affecting 60% of the world’s population.
Government has played an important role in agricultural development in most Asian countries, adopting regulatory policies by depressing food prices, adjusting supply and demand, and implementing compensation policies through market price support and production factor subsidy programs—all of which have a significant influence over agricultural production. In addition, Asian countries that have emphasized food security have introduced high tariffs on imports, or have forbidden those tariffs entirely. Therefore, finding solutions to strengthen domestic production has become a critical issue for Asian governments.
Because agricultural protection in Asia can be distorted by the existence of market mechanisms and trade barriers, international growth in the trading of agricultural products is less compared with other commodities and services. To counter this, multilateral trade negotiations, such as Uruguay Round, began introducing solutions to agricultural trading problems. The negotiations, which began in 1986, resulted in the Agreement on Agriculture in 1994, the main contents of which offered solutions like reducing import tariffs, eliminating domestic support, and enhancing export competition—which has significantly expedited international trade in agricultural products.
We suppose that agricultural productivity and efficiency for most countries are improved by technical diffusion along with international trade and market mechanisms under an open economy. In an open economy, each country is expected to follow the principle of comparative advantage to produce goods efficiently, and to promote more international trade and foreign direct investment (FDI) activities that have the effect of technical diffusion and transfer among involved countries on increases in productivity. In other words, we suppose that those influencing factors that have changed agricultural productivity and efficiency before 1995 are much different than what has happened since. Pre-1995 conditions were influenced by the Green Revolution and domestic protection policy, while conditions thereafter have been driven by market competition, international trade, and FDI.
Endogenous growth theory mainly explores sources of technical progress and examines catch-up effects or convergence effects of growth rate among countries. Based on this logic, it is interesting to test the convergence effect of the total factor productivity (TFP) growth rates in the agricultural sectors of the countries studied.
The purposes of this study are to explore and compare agricultural productivity and efficiency changes and its trends in fifteen Asian countries. We applied a sequential data envelope analysis (DEA), which overcomes the problem of dimensionality in calculating productivity each year, and used the Malmquist index to estimate TFP growth and its composition of technical and efficiency changes over different years. The related input and output data of each country from 1961 to 2012, which covers the era of Green Revolution and trade liberalization, are from the Food and Agriculture Organization of the United Nations (FAO).
Sequential DEA and Malmquist TFP Indices
Traditionally, total factor productivity change can be estimated by growth accounting formula—which is the residual value of output growth minus the sum of input growth times the input share. However, there are four assumptions behind this growth accounting formula: (1) given production function; (2) maximum technical efficiency; (3) neutral technical change; (4) constant returns to scale. Coelli et al. (1998) pointed out that TFP change estimation would be biased while relaxing these above assumptions.
Since there are some limitations to a growth accounting formula, this study uses the populate non-parameter method, which applies the Data Envelope Analysis (DEA) created by Charnes, Cooper and Rhodes (1978), abbreviated here as the CCR model. However, though the CCR model is based on an assumption of constant returns to scale, Banker, Charnes and Cooper (1984) canceled the assumption for calculating scale efficiency. This study applies the DEA to evaluate relative output/input efficiency for each country. The DEA is based on output oriented estimation—which calculates the distance between maximum output and real output—whereby technical efficiency change can either be decomposed into pure technical efficiency change and scale efficiency change, or can combine technical efficiency change and technical change into total factor productivity change.
Many studies have examined productivity differences using the Malmquist (MALM) productivity index. DEA has been used to construct the index with respect to a contemporaneous frontier which computes the number of inputs and outputs relative to the number of observations in the cross-section. However, due to the problem of dimensionality—which may cause the technology frontiers to be unstable, to move back and forth and possibly intersect—the results are harder to interpret, thus introducing unlikely levels of technological regression (Suhariyanto and Thirtle, 2001). Therefore, the sequential frontier was used in this study. The sequential input frontier may only shift towards the origin, indicating technological progress, or remain static if there is no technological progress.
We adopt the output-oriented MALM productivity index specified by Färe et al. (1994). In order to calculate the MALM using the sequential DEA approach, the definition of the output distance function for each time period t has to be modified as follows:
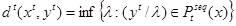
This distance function still represents the smallest factor, λ, by which an output vector yt is deflated so that it can be produced with a given input vector xt under period t's technology. However, this reference technology is sequential instead of contemporaneous.
The MALM formula can be decomposed into two components, technical change (TC) and efficiency change (EC), as follows (Färe et al., 1994):
where
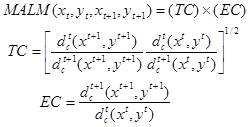
The “technical change” component measures the shift in the frontier over time and can be interpreted as providing evidence of innovation for the province considered. On the other hand, the “efficiency change” component measures the extent to which an observed province is moving toward (or away from) the frontier. It, therefore, captures the performance relative to the best practice in the sample and can be interpreted as the catching-up (or falling-behind) effect. If EC is estimated greater (or less) than 1, it means technical efficiency improves (or worsens) from period s to t. If value of technical efficiency is equal to 1, it means technical efficiency keeps constant.
Basically, according to the result of the estimated MALM index, it can be used to judge total factor productivity change—and its source from technical change or technical efficiency change—during period s and t. For instance, if the MALM index is greater (or less) than 1, it refers to the total factor productivity progress (or regress).
If we relax the CRS assumption and allow for variable returns to scales (VRS) technology, then the “efficiency change” can further be decomposed into pure efficiency change (PE) and scale efficiency change (SE) as follows:
where
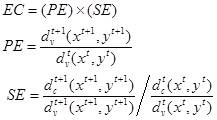
The subscript v denotes the VRS benchmark technology. The LP problems for VRS technology can be solved by adding the following constraint into the LP model:

If SCAL is greater (or less) than 1, it indicates that the production scale is closer to (or further away from) the CRS at period t compared to period s.
Data
Agricultural TFP is measured in this study using one output and five inputs technology. All of data has been downloaded from the Food and Agricultural Organization of the FAO statistics website. Data for the fifteen Asian countries are used in this analysis, which covers the period from 1961 to 2012. The countries are Cambodia, China, India, Indonesia, Japan, Republic of Korea (South Korea), Democratic People's Republic of Korea (North Korea) , Laos, Malaysia, Myanmar, Pakistan, Philippines, Taiwan, Thailand, and Vietnam. The definitions of the variables are as follows:
i) Aggregate agricultural output (Y): Total value of agricultural production, which is Net Production Value measured in thousands of dollars with the base period from 2004-2006.
ii) Agricultural labour (N): Total economically active population in agriculture, measured in thousands of workers.
iii) Agricultural land (L): Total arable land, permanent crops, permanent meadows and pastures.
iv) Fertilizer (F): Aggregate of Nitrogen (N), Potassium (P205) and Phosphate (K20) content of fertilizer, measured in thousands of metric tons, in nutrient units.
v) Machinery (M): Represented by total number of wheeled and crawler tractors—the two machines that have most in agricultural production and technology progress. We have adopted the regression method to estimate some unavailable data during 2009-2012.
vi) Aggregate livestock (S): Cattle, sheep, goats, pigs, mules, horses, asses, buffaloes, camels, ducks, chickens, and turkeys were aggregated using the weights taken from Hayami and Ruttan (1985).
TFP and Decomposition results
The TFP growth rates for the Malmquist TFP indices and their components are reported in Table 1. TFP growth rate is composed of technical change (TC) and efficiency change (EC), which can be divided into efficiency change (PE) and scale efficiency change (SE). The results show that production value share was measured at an average annual TFP growth rate of 0.61% during the entire period of 1961-2012. The average annual TFP growth rate was mainly attributable to a technical change of 1.07%. However, a 0.46% decrease of efficiency change caused the TFP growth rate to be partially offset. The reason for the EC decrease is a scale efficiency decline of 0.48%, which means the production scale was far from optimum. Fortunately, pure technical efficiency increased by an average of 0.02% each year, which means farming technique and management continued improvement.
Table 1. Annual Growth Rates of Malmquist TFP index and its Components in Asian Countries
Unit:%
|
period
|
1961-2012
|
1961-1994 (I)
|
1995-2012 (II)
|
|
Component
|
TFP
|
TC
|
EC
|
PE
|
SE
|
TFP
|
TC
|
EC
|
PE
|
SE
|
TFP
|
TC
|
EC
|
PE
|
SE
|
|
Cambodia
|
1.87
|
1.90
|
-0.03
|
0.05
|
-0.08
|
2.08
|
2.58
|
-0.49
|
-0.49
|
0.00
|
1.45
|
0.57
|
0.88
|
1.12
|
-0.24
|
|
China
|
0.39
|
0.71
|
-0.32
|
0.00
|
-0.32
|
-0.33
|
0.73
|
-1.06
|
0.00
|
-1.06
|
1.85
|
0.68
|
1.16
|
0.00
|
1.16
|
|
India
|
-0.10
|
1.08
|
-1.17
|
0.00
|
-1.17
|
-0.51
|
0.95
|
-1.45
|
0.00
|
-1.45
|
0.71
|
1.34
|
-0.62
|
0.00
|
-0.62
|
|
Indonesia
|
0.12
|
0.36
|
-0.24
|
0.00
|
-0.24
|
-0.36
|
0.48
|
-0.84
|
0.00
|
-0.84
|
1.09
|
0.11
|
0.97
|
0.00
|
0.97
|
|
Japan
|
3.53
|
3.53
|
0.00
|
0.00
|
0.00
|
3.15
|
3.15
|
0.00
|
0.00
|
0.00
|
4.28
|
4.28
|
0.00
|
0.00
|
0.00
|
|
Laos
|
1.92
|
1.92
|
0.00
|
0.00
|
0.00
|
0.66
|
1.83
|
-1.14
|
-1.14
|
0.00
|
4.48
|
2.10
|
2.33
|
2.33
|
0.00
|
|
Malaysia
|
3.07
|
3.07
|
0.00
|
0.00
|
0.00
|
2.59
|
2.59
|
0.00
|
0.00
|
0.00
|
4.03
|
4.03
|
0.00
|
0.00
|
0.00
|
|
Myanmar
|
1.29
|
1.36
|
-0.07
|
0.00
|
-0.07
|
-0.13
|
0.23
|
-0.36
|
-0.36
|
0.00
|
4.20
|
3.66
|
0.52
|
0.73
|
-0.21
|
|
North Korea
|
1.24
|
1.17
|
0.07
|
0.32
|
-0.24
|
1.42
|
0.92
|
0.50
|
0.50
|
0.00
|
0.88
|
1.66
|
-0.77
|
-0.04
|
-0.73
|
|
Pakistan
|
0.00
|
0.75
|
-0.75
|
0.05
|
-0.80
|
-0.17
|
0.42
|
-0.58
|
0.12
|
-0.70
|
0.33
|
1.43
|
-1.09
|
-0.10
|
-0.98
|
|
Philippines
|
1.71
|
1.71
|
0.00
|
0.00
|
0.00
|
1.37
|
1.40
|
-0.03
|
0.00
|
-0.03
|
2.39
|
2.32
|
0.06
|
0.00
|
0.06
|
|
South Korea
|
3.15
|
3.15
|
0.00
|
0.00
|
0.00
|
2.82
|
2.82
|
0.00
|
0.00
|
0.00
|
3.83
|
3.83
|
0.00
|
0.00
|
0.00
|
|
Taiwan
|
3.54
|
3.55
|
-0.01
|
0.00
|
-0.01
|
4.07
|
4.07
|
0.00
|
0.00
|
0.00
|
2.49
|
2.52
|
-0.03
|
0.00
|
-0.03
|
|
Thailand
|
1.44
|
1.44
|
0.00
|
0.00
|
0.00
|
0.43
|
1.13
|
-0.69
|
-0.01
|
-0.69
|
3.49
|
2.06
|
1.40
|
0.01
|
1.39
|
|
Vietnam
|
2.54
|
1.09
|
1.44
|
0.67
|
0.76
|
3.39
|
1.21
|
2.15
|
1.00
|
1.14
|
0.86
|
0.84
|
0.02
|
0.00
|
0.02
|
|
Average
|
0.61
|
1.07
|
-0.46
|
0.02
|
-0.48
|
0.15
|
1.05
|
-0.89
|
0.02
|
-0.91
|
1.67
|
1.15
|
0.52
|
0.01
|
0.50
|
Source: Author’s estimation.
These measures show that one out of fifteen Asian countries, only India had a negative TFP growth between 1961 and 2012. There were three countries (China, Indonesia, and Pakistan) that had less than one per cent positive growth, six (Cambodia, Laos, Myanmar, North Korea, Philippines, and Thailand) had between one and two per cent growth, one (Vietnam) had between two and three per cent growth, and four (Taiwan, Japan, South Korea, and Malaysia) that grew at more than three per cent per annum. The highest productivity growth was found in Taiwan (3.54%), followed by Japan (3.53%), South Korea (3.15%), and Malaysia (3.07%).
To compare TFP growth rates, the whole period is divided into two sub periods since the establishment of the in 1995: the first period 1961-1994, and the second 1995-2012. Obviously, eleven out of fifteen Asian countries, China, India, Indonesia, Japan, South Korea, Laos, Malaysia, Myanmar, Pakistan, Philippines, and Thailand, had significant TFP growth increases in the second period compared with first period. This data implies that, since 1995, the WTO’s implementation of the Agreement on Agriculture, has been changing the TFP, regardless of market access and domestic support reduction. The data also implies that the TFP change might be owing to technical diffusion from international trade expansion and technical change to fight against agricultural imports. Meanwhile, farmers have been forced to improve efficiency under market competition instead of government protection. In addition, we should not ignore the fact that the TFP growth rate increased significantly from 0.15% in the first period to 1.67% in the second period—mainly due to big countries like China, India, and Myanmar moving toward an open economy.
Taiwan is unique among these Asian countries listed in this study, in that it enjoyed the fastest growth in TFP productivity over the period before 1995, yet faced a decline thereafter. The reason for this decline is mainly from a decrease in technological advancement, which might reflect a bottleneck in technical change, a weakening in R&D investment and organization, or a problem in decreasing in marginal returns of R&D. Moreover, Taiwan faced a decrease in efficiency as well—perhaps caused from not having an optimum management system that addressed fallow areas, problems of integration regarding rights on farmland, and having an aging population of farmers.
To identify trends, the data are divided into five periods per decade, shown in Table 2. This table indicates agricultural TFP steadily accelerated for Asian countries from the 1960s to the end of the twentieth century. Although technical change slowed down—which resulted in diminishing benefits and a lack of diversity of improvement, and modern inputs along with lapses in time—efficiency change was found to improve through learning-by-doing and paradigm learning. However, the growth of agricultural TFP has been declining since the twenty-first century. The main reason is a scale efficiency decrease, which might result from industrialization competing with farmland use, as is typically seen in China and India.
Table 2. Annual Growth Rates of Malmquist TFP Index in Different Periods in Asian Countries
Unit: %
|
Period
|
1961-1970 (I)
|
1971-1980 (II)
|
1981-1990 (III)
|
1991-2000 (IV)
|
2001-2012 (V)
|
|
|
TFP
|
TC
|
EC
|
TFP
|
TC
|
EC
|
TFP
|
TC
|
EC
|
TFP
|
TC
|
EC
|
TFP
|
TC
|
EC
|
|
Cambodia
|
2.22
|
2.25
|
-0.03
|
-4.52
|
2.48
|
-6.83
|
8.25
|
4.05
|
4.03
|
0.36
|
0.00
|
0.36
|
3.32
|
0.88
|
2.42
|
|
China
|
-2.32
|
1.42
|
-3.68
|
-2.22
|
0.87
|
-3.06
|
1.77
|
0.20
|
1.56
|
3.97
|
0.00
|
3.97
|
0.83
|
1.05
|
-0.22
|
|
India
|
-3.76
|
1.44
|
-5.13
|
0.43
|
1.16
|
-0.72
|
0.70
|
0.56
|
0.14
|
1.16
|
0.82
|
0.34
|
0.94
|
1.40
|
-0.45
|
|
Indonesia
|
1.51
|
1.51
|
0.00
|
-0.58
|
0.14
|
-0.71
|
-2.77
|
0.00
|
-2.77
|
0.90
|
0.00
|
0.90
|
1.46
|
0.17
|
1.29
|
|
Japan
|
3.02
|
3.02
|
0.00
|
4.41
|
4.41
|
0.00
|
2.03
|
2.03
|
0.00
|
2.84
|
2.84
|
0.00
|
5.20
|
5.20
|
0.00
|
|
Laos
|
2.15
|
2.70
|
-0.53
|
-2.66
|
0.87
|
-3.50
|
3.02
|
2.66
|
0.34
|
2.62
|
0.24
|
2.38
|
4.37
|
3.04
|
1.29
|
|
Malaysia
|
2.57
|
2.57
|
0.00
|
2.77
|
2.77
|
0.00
|
2.52
|
2.52
|
0.00
|
2.78
|
2.78
|
0.00
|
4.56
|
4.56
|
0.00
|
|
Myanmar
|
-5.67
|
0.42
|
-6.07
|
3.47
|
0.05
|
3.42
|
0.90
|
0.31
|
0.58
|
5.17
|
2.75
|
2.35
|
2.80
|
3.13
|
-0.33
|
|
North Korea
|
-2.54
|
1.30
|
-3.79
|
0.08
|
1.20
|
-1.10
|
2.57
|
0.61
|
1.96
|
4.12
|
1.16
|
2.93
|
2.02
|
1.55
|
0.46
|
|
Pakistan
|
-1.74
|
0.62
|
-2.34
|
-1.05
|
0.53
|
-1.57
|
2.18
|
0.12
|
2.06
|
-0.26
|
1.31
|
-1.55
|
0.82
|
1.15
|
-0.33
|
|
Philippines
|
1.02
|
1.02
|
0.00
|
2.57
|
2.57
|
0.00
|
1.17
|
1.17
|
0.00
|
0.31
|
0.31
|
0.00
|
3.35
|
3.35
|
0.00
|
|
South Korea
|
2.55
|
2.64
|
-0.10
|
2.85
|
2.75
|
0.10
|
2.73
|
2.73
|
0.00
|
4.14
|
4.14
|
0.00
|
3.48
|
3.48
|
0.00
|
|
Taiwan
|
5.58
|
5.58
|
0.00
|
3.67
|
3.67
|
0.00
|
3.29
|
3.29
|
0.00
|
3.18
|
3.18
|
0.00
|
2.14
|
2.19
|
-0.05
|
|
Thailand
|
0.69
|
1.03
|
-0.33
|
2.21
|
2.15
|
0.06
|
-1.05
|
0.66
|
-1.69
|
2.39
|
0.38
|
2.00
|
2.85
|
2.85
|
0.00
|
|
Vietnam
|
0.65
|
3.35
|
-2.61
|
1.66
|
0.61
|
1.04
|
1.10
|
0.12
|
0.98
|
7.39
|
0.89
|
6.44
|
2.08
|
0.55
|
1.52
|
|
Average
|
-1.66
|
1.61
|
-3.22
|
-0.12
|
1.33
|
-1.44
|
1.15
|
0.55
|
0.60
|
2.80
|
0.57
|
2.23
|
1.28
|
1.39
|
-0.10
|
Source: Author’s estimation.
As is seen in the above table, Japan, South Korea, Malaysia, and Thailand faced similar changes: agricultural TFP declined in 1980s but bounced back in the 1990s to their highest reported levels.
Agricultural negotiations were first shown in the General Agreement of Tariffs and Trade (GATT) in 1986. Based on reducing impacts from import and expanding export opportunity considerations, the negotiations caused many WTO member countries to consider a structural change in their agricultural policies and management, and to improve efficiency and productivity—especially in those agriculturally protected countries. As has been already reported, Taiwan found itself in an extraordinary situation in that it had been experiencing a decrease in agricultural TFP since the Green revolution began. Over this time, Taiwan had no significant investment projects in agricultural R&D to enhance technical change, and no structural change in agricultural policy to link it to market mechanisms which improved production efficiency. In fact, Taiwan faced efficiency problems and a negative growth rate during the period of 2001 to 2012. As such, Taiwan’s agricultural development had fallen behind Japan and South Korea, which are considered small farming countries similar to Taiwan.
CONCLUSION
Most Asian countries are still considered “developing countries” and have small farming economies. Based on food security, farmers’ income, and the different stages of economic development, governments usually intervene and oversee agriculture by R&D, technical extension, market promotion, and various kinds of protection measures. However, trade barriers like tariffs and quotas to restrict imports—which protect domestic production by price support and input subsidies—have seen a reduction since the Agreement on Agriculture was implemented in 1995.
While there has been an increase of international trade in agricultural goods, it is expected that a significant spillover of technical capabilities and international trade activities will occur. And once there is a tendency in convergence effects on agricultural productivity and efficiency, it would strengthen the proposal for trade liberalization in agriculture.
This paper applies sequential Data Envelop Analysis (DEA) based on agricultural output and inputs of 15 Asian countries during period of 1961 to 2012. It estimates efficiency change, technical change, and total factor productivity (TFP) change by the output oriented Malmquist index. These estimated outcomes can be further tested by the convergence effects and determinants of productivity and efficiency.
The results indicate there is no convergence tendency in agricultural TFP change among Asian countries after 1995. Production efficiency has been increasing from country to country, but technical change needs more breakthrough developments. Our research implies that it is not an easy task to change internal production structures caused by external technical spillover effects owing to trade liberalization. Besides which, the main determinants for TFP in agriculture are R&D expenditures and capital formation. Further, our research reveals the importance of a basic agricultural environment and infrastructure. When compared, there are similar features among Taiwan, Japan, and South Korea, including a significant number of convergence effects on these three countries’ TFP change. Finally, our research implies that convergence is conditionally based on a highly organized infrastructure, but not trade liberalization. The results can be used to understand the reasons why most Asian countries are not interested in agricultural negotiation within the WTO.
REFERENCES
Choi, In (2001). “Unit Root Tests for Panel Data,” Journal of International Money and Finance, Volume 20(2): 249–272.
Chen,Po-Chi, Ming-Miin Yu, Ching-Cheng Chang, Shih-Hsun Hsu (2008). “Total Factor Productivity Growth in China's Agricultural Sector,” China Economic Review 19: 580–593.
FAO (2006). World agriculture: towards 2030/2050. Rome.
Hayami, Y. and Ruttan, V. M. (1985). Agricultural Development : An International Perspective, Johns Hopkins University Press, Baltimore.
Suhariyanto, Kecuk and Colin Thirtle(2001). “Asian Agricultural Productivity and Convergence,” Journal of Agricultural Economics 52(3): 96-110.
|
Date submitted: Nov. 28, 2017
Reviewed, edited and uploaded: Dec. 26, 2017
|

Agricultural Total Factor Productivity Performance in Asian
Introduction
Since 1961, the earth’s population has increased from three billion to seven billion and the global per capita income has risen three-fold. Although there has been a continuous decrease in farmland and farm labor—along with economic development and industrialization over the same period—agricultural production has been ever increasing to keep pace with human consumption. As such, present-day advancements in agricultural productivity and efficiency have become paramount in driving the economic development of agriculture.
In the 1960s, the Green Revolution spread around the world. Through high production hybrid variety research and extension, irrigation system infrastructure, and compound fertilizer and pesticide utilization, agricultural output increased 2.3% annually. Notably, there was a 3.4-3.8% rise in output in developing countries, which was more than the annual population growth rate of 1.7% over the same period (FAO, 2006). The success of the Green Revolution resulted in full food self-sufficiency in most Asian countries, which has been one of fastest global growth regions, affecting 60% of the world’s population.
Government has played an important role in agricultural development in most Asian countries, adopting regulatory policies by depressing food prices, adjusting supply and demand, and implementing compensation policies through market price support and production factor subsidy programs—all of which have a significant influence over agricultural production. In addition, Asian countries that have emphasized food security have introduced high tariffs on imports, or have forbidden those tariffs entirely. Therefore, finding solutions to strengthen domestic production has become a critical issue for Asian governments.
Because agricultural protection in Asia can be distorted by the existence of market mechanisms and trade barriers, international growth in the trading of agricultural products is less compared with other commodities and services. To counter this, multilateral trade negotiations, such as Uruguay Round, began introducing solutions to agricultural trading problems. The negotiations, which began in 1986, resulted in the Agreement on Agriculture in 1994, the main contents of which offered solutions like reducing import tariffs, eliminating domestic support, and enhancing export competition—which has significantly expedited international trade in agricultural products.
We suppose that agricultural productivity and efficiency for most countries are improved by technical diffusion along with international trade and market mechanisms under an open economy. In an open economy, each country is expected to follow the principle of comparative advantage to produce goods efficiently, and to promote more international trade and foreign direct investment (FDI) activities that have the effect of technical diffusion and transfer among involved countries on increases in productivity. In other words, we suppose that those influencing factors that have changed agricultural productivity and efficiency before 1995 are much different than what has happened since. Pre-1995 conditions were influenced by the Green Revolution and domestic protection policy, while conditions thereafter have been driven by market competition, international trade, and FDI.
Endogenous growth theory mainly explores sources of technical progress and examines catch-up effects or convergence effects of growth rate among countries. Based on this logic, it is interesting to test the convergence effect of the total factor productivity (TFP) growth rates in the agricultural sectors of the countries studied.
The purposes of this study are to explore and compare agricultural productivity and efficiency changes and its trends in fifteen Asian countries. We applied a sequential data envelope analysis (DEA), which overcomes the problem of dimensionality in calculating productivity each year, and used the Malmquist index to estimate TFP growth and its composition of technical and efficiency changes over different years. The related input and output data of each country from 1961 to 2012, which covers the era of Green Revolution and trade liberalization, are from the Food and Agriculture Organization of the United Nations (FAO).
Sequential DEA and Malmquist TFP Indices
Traditionally, total factor productivity change can be estimated by growth accounting formula—which is the residual value of output growth minus the sum of input growth times the input share. However, there are four assumptions behind this growth accounting formula: (1) given production function; (2) maximum technical efficiency; (3) neutral technical change; (4) constant returns to scale. Coelli et al. (1998) pointed out that TFP change estimation would be biased while relaxing these above assumptions.
Since there are some limitations to a growth accounting formula, this study uses the populate non-parameter method, which applies the Data Envelope Analysis (DEA) created by Charnes, Cooper and Rhodes (1978), abbreviated here as the CCR model. However, though the CCR model is based on an assumption of constant returns to scale, Banker, Charnes and Cooper (1984) canceled the assumption for calculating scale efficiency. This study applies the DEA to evaluate relative output/input efficiency for each country. The DEA is based on output oriented estimation—which calculates the distance between maximum output and real output—whereby technical efficiency change can either be decomposed into pure technical efficiency change and scale efficiency change, or can combine technical efficiency change and technical change into total factor productivity change.
Many studies have examined productivity differences using the Malmquist (MALM) productivity index. DEA has been used to construct the index with respect to a contemporaneous frontier which computes the number of inputs and outputs relative to the number of observations in the cross-section. However, due to the problem of dimensionality—which may cause the technology frontiers to be unstable, to move back and forth and possibly intersect—the results are harder to interpret, thus introducing unlikely levels of technological regression (Suhariyanto and Thirtle, 2001). Therefore, the sequential frontier was used in this study. The sequential input frontier may only shift towards the origin, indicating technological progress, or remain static if there is no technological progress.
We adopt the output-oriented MALM productivity index specified by Färe et al. (1994). In order to calculate the MALM using the sequential DEA approach, the definition of the output distance function for each time period t has to be modified as follows:
This distance function still represents the smallest factor, λ, by which an output vector yt is deflated so that it can be produced with a given input vector xt under period t's technology. However, this reference technology is sequential instead of contemporaneous.
The MALM formula can be decomposed into two components, technical change (TC) and efficiency change (EC), as follows (Färe et al., 1994):
where
The “technical change” component measures the shift in the frontier over time and can be interpreted as providing evidence of innovation for the province considered. On the other hand, the “efficiency change” component measures the extent to which an observed province is moving toward (or away from) the frontier. It, therefore, captures the performance relative to the best practice in the sample and can be interpreted as the catching-up (or falling-behind) effect. If EC is estimated greater (or less) than 1, it means technical efficiency improves (or worsens) from period s to t. If value of technical efficiency is equal to 1, it means technical efficiency keeps constant.
Basically, according to the result of the estimated MALM index, it can be used to judge total factor productivity change—and its source from technical change or technical efficiency change—during period s and t. For instance, if the MALM index is greater (or less) than 1, it refers to the total factor productivity progress (or regress).
If we relax the CRS assumption and allow for variable returns to scales (VRS) technology, then the “efficiency change” can further be decomposed into pure efficiency change (PE) and scale efficiency change (SE) as follows:
where
The subscript v denotes the VRS benchmark technology. The LP problems for VRS technology can be solved by adding the following constraint into the LP model:
If SCAL is greater (or less) than 1, it indicates that the production scale is closer to (or further away from) the CRS at period t compared to period s.
Data
Agricultural TFP is measured in this study using one output and five inputs technology. All of data has been downloaded from the Food and Agricultural Organization of the FAO statistics website. Data for the fifteen Asian countries are used in this analysis, which covers the period from 1961 to 2012. The countries are Cambodia, China, India, Indonesia, Japan, Republic of Korea (South Korea), Democratic People's Republic of Korea (North Korea) , Laos, Malaysia, Myanmar, Pakistan, Philippines, Taiwan, Thailand, and Vietnam. The definitions of the variables are as follows:
i) Aggregate agricultural output (Y): Total value of agricultural production, which is Net Production Value measured in thousands of dollars with the base period from 2004-2006.
ii) Agricultural labour (N): Total economically active population in agriculture, measured in thousands of workers.
iii) Agricultural land (L): Total arable land, permanent crops, permanent meadows and pastures.
iv) Fertilizer (F): Aggregate of Nitrogen (N), Potassium (P205) and Phosphate (K20) content of fertilizer, measured in thousands of metric tons, in nutrient units.
v) Machinery (M): Represented by total number of wheeled and crawler tractors—the two machines that have most in agricultural production and technology progress. We have adopted the regression method to estimate some unavailable data during 2009-2012.
vi) Aggregate livestock (S): Cattle, sheep, goats, pigs, mules, horses, asses, buffaloes, camels, ducks, chickens, and turkeys were aggregated using the weights taken from Hayami and Ruttan (1985).
TFP and Decomposition results
The TFP growth rates for the Malmquist TFP indices and their components are reported in Table 1. TFP growth rate is composed of technical change (TC) and efficiency change (EC), which can be divided into efficiency change (PE) and scale efficiency change (SE). The results show that production value share was measured at an average annual TFP growth rate of 0.61% during the entire period of 1961-2012. The average annual TFP growth rate was mainly attributable to a technical change of 1.07%. However, a 0.46% decrease of efficiency change caused the TFP growth rate to be partially offset. The reason for the EC decrease is a scale efficiency decline of 0.48%, which means the production scale was far from optimum. Fortunately, pure technical efficiency increased by an average of 0.02% each year, which means farming technique and management continued improvement.
Table 1. Annual Growth Rates of Malmquist TFP index and its Components in Asian Countries
Unit:%
period
1961-2012
1961-1994 (I)
1995-2012 (II)
Component
TFP
TC
EC
PE
SE
TFP
TC
EC
PE
SE
TFP
TC
EC
PE
SE
Cambodia
1.87
1.90
-0.03
0.05
-0.08
2.08
2.58
-0.49
-0.49
0.00
1.45
0.57
0.88
1.12
-0.24
China
0.39
0.71
-0.32
0.00
-0.32
-0.33
0.73
-1.06
0.00
-1.06
1.85
0.68
1.16
0.00
1.16
India
-0.10
1.08
-1.17
0.00
-1.17
-0.51
0.95
-1.45
0.00
-1.45
0.71
1.34
-0.62
0.00
-0.62
Indonesia
0.12
0.36
-0.24
0.00
-0.24
-0.36
0.48
-0.84
0.00
-0.84
1.09
0.11
0.97
0.00
0.97
Japan
3.53
3.53
0.00
0.00
0.00
3.15
3.15
0.00
0.00
0.00
4.28
4.28
0.00
0.00
0.00
Laos
1.92
1.92
0.00
0.00
0.00
0.66
1.83
-1.14
-1.14
0.00
4.48
2.10
2.33
2.33
0.00
Malaysia
3.07
3.07
0.00
0.00
0.00
2.59
2.59
0.00
0.00
0.00
4.03
4.03
0.00
0.00
0.00
Myanmar
1.29
1.36
-0.07
0.00
-0.07
-0.13
0.23
-0.36
-0.36
0.00
4.20
3.66
0.52
0.73
-0.21
North Korea
1.24
1.17
0.07
0.32
-0.24
1.42
0.92
0.50
0.50
0.00
0.88
1.66
-0.77
-0.04
-0.73
Pakistan
0.00
0.75
-0.75
0.05
-0.80
-0.17
0.42
-0.58
0.12
-0.70
0.33
1.43
-1.09
-0.10
-0.98
Philippines
1.71
1.71
0.00
0.00
0.00
1.37
1.40
-0.03
0.00
-0.03
2.39
2.32
0.06
0.00
0.06
South Korea
3.15
3.15
0.00
0.00
0.00
2.82
2.82
0.00
0.00
0.00
3.83
3.83
0.00
0.00
0.00
Taiwan
3.54
3.55
-0.01
0.00
-0.01
4.07
4.07
0.00
0.00
0.00
2.49
2.52
-0.03
0.00
-0.03
Thailand
1.44
1.44
0.00
0.00
0.00
0.43
1.13
-0.69
-0.01
-0.69
3.49
2.06
1.40
0.01
1.39
Vietnam
2.54
1.09
1.44
0.67
0.76
3.39
1.21
2.15
1.00
1.14
0.86
0.84
0.02
0.00
0.02
Average
0.61
1.07
-0.46
0.02
-0.48
0.15
1.05
-0.89
0.02
-0.91
1.67
1.15
0.52
0.01
0.50
These measures show that one out of fifteen Asian countries, only India had a negative TFP growth between 1961 and 2012. There were three countries (China, Indonesia, and Pakistan) that had less than one per cent positive growth, six (Cambodia, Laos, Myanmar, North Korea, Philippines, and Thailand) had between one and two per cent growth, one (Vietnam) had between two and three per cent growth, and four (Taiwan, Japan, South Korea, and Malaysia) that grew at more than three per cent per annum. The highest productivity growth was found in Taiwan (3.54%), followed by Japan (3.53%), South Korea (3.15%), and Malaysia (3.07%).
To compare TFP growth rates, the whole period is divided into two sub periods since the establishment of the in 1995: the first period 1961-1994, and the second 1995-2012. Obviously, eleven out of fifteen Asian countries, China, India, Indonesia, Japan, South Korea, Laos, Malaysia, Myanmar, Pakistan, Philippines, and Thailand, had significant TFP growth increases in the second period compared with first period. This data implies that, since 1995, the WTO’s implementation of the Agreement on Agriculture, has been changing the TFP, regardless of market access and domestic support reduction. The data also implies that the TFP change might be owing to technical diffusion from international trade expansion and technical change to fight against agricultural imports. Meanwhile, farmers have been forced to improve efficiency under market competition instead of government protection. In addition, we should not ignore the fact that the TFP growth rate increased significantly from 0.15% in the first period to 1.67% in the second period—mainly due to big countries like China, India, and Myanmar moving toward an open economy.
Taiwan is unique among these Asian countries listed in this study, in that it enjoyed the fastest growth in TFP productivity over the period before 1995, yet faced a decline thereafter. The reason for this decline is mainly from a decrease in technological advancement, which might reflect a bottleneck in technical change, a weakening in R&D investment and organization, or a problem in decreasing in marginal returns of R&D. Moreover, Taiwan faced a decrease in efficiency as well—perhaps caused from not having an optimum management system that addressed fallow areas, problems of integration regarding rights on farmland, and having an aging population of farmers.
To identify trends, the data are divided into five periods per decade, shown in Table 2. This table indicates agricultural TFP steadily accelerated for Asian countries from the 1960s to the end of the twentieth century. Although technical change slowed down—which resulted in diminishing benefits and a lack of diversity of improvement, and modern inputs along with lapses in time—efficiency change was found to improve through learning-by-doing and paradigm learning. However, the growth of agricultural TFP has been declining since the twenty-first century. The main reason is a scale efficiency decrease, which might result from industrialization competing with farmland use, as is typically seen in China and India.
Table 2. Annual Growth Rates of Malmquist TFP Index in Different Periods in Asian Countries
Unit: %
Period
1961-1970 (I)
1971-1980 (II)
1981-1990 (III)
1991-2000 (IV)
2001-2012 (V)
TFP
TC
EC
TFP
TC
EC
TFP
TC
EC
TFP
TC
EC
TFP
TC
EC
Cambodia
2.22
2.25
-0.03
-4.52
2.48
-6.83
8.25
4.05
4.03
0.36
0.00
0.36
3.32
0.88
2.42
China
-2.32
1.42
-3.68
-2.22
0.87
-3.06
1.77
0.20
1.56
3.97
0.00
3.97
0.83
1.05
-0.22
India
-3.76
1.44
-5.13
0.43
1.16
-0.72
0.70
0.56
0.14
1.16
0.82
0.34
0.94
1.40
-0.45
Indonesia
1.51
1.51
0.00
-0.58
0.14
-0.71
-2.77
0.00
-2.77
0.90
0.00
0.90
1.46
0.17
1.29
Japan
3.02
3.02
0.00
4.41
4.41
0.00
2.03
2.03
0.00
2.84
2.84
0.00
5.20
5.20
0.00
Laos
2.15
2.70
-0.53
-2.66
0.87
-3.50
3.02
2.66
0.34
2.62
0.24
2.38
4.37
3.04
1.29
Malaysia
2.57
2.57
0.00
2.77
2.77
0.00
2.52
2.52
0.00
2.78
2.78
0.00
4.56
4.56
0.00
Myanmar
-5.67
0.42
-6.07
3.47
0.05
3.42
0.90
0.31
0.58
5.17
2.75
2.35
2.80
3.13
-0.33
North Korea
-2.54
1.30
-3.79
0.08
1.20
-1.10
2.57
0.61
1.96
4.12
1.16
2.93
2.02
1.55
0.46
Pakistan
-1.74
0.62
-2.34
-1.05
0.53
-1.57
2.18
0.12
2.06
-0.26
1.31
-1.55
0.82
1.15
-0.33
Philippines
1.02
1.02
0.00
2.57
2.57
0.00
1.17
1.17
0.00
0.31
0.31
0.00
3.35
3.35
0.00
South Korea
2.55
2.64
-0.10
2.85
2.75
0.10
2.73
2.73
0.00
4.14
4.14
0.00
3.48
3.48
0.00
Taiwan
5.58
5.58
0.00
3.67
3.67
0.00
3.29
3.29
0.00
3.18
3.18
0.00
2.14
2.19
-0.05
Thailand
0.69
1.03
-0.33
2.21
2.15
0.06
-1.05
0.66
-1.69
2.39
0.38
2.00
2.85
2.85
0.00
Vietnam
0.65
3.35
-2.61
1.66
0.61
1.04
1.10
0.12
0.98
7.39
0.89
6.44
2.08
0.55
1.52
Average
-1.66
1.61
-3.22
-0.12
1.33
-1.44
1.15
0.55
0.60
2.80
0.57
2.23
1.28
1.39
-0.10
Source: Author’s estimation.
As is seen in the above table, Japan, South Korea, Malaysia, and Thailand faced similar changes: agricultural TFP declined in 1980s but bounced back in the 1990s to their highest reported levels.
Agricultural negotiations were first shown in the General Agreement of Tariffs and Trade (GATT) in 1986. Based on reducing impacts from import and expanding export opportunity considerations, the negotiations caused many WTO member countries to consider a structural change in their agricultural policies and management, and to improve efficiency and productivity—especially in those agriculturally protected countries. As has been already reported, Taiwan found itself in an extraordinary situation in that it had been experiencing a decrease in agricultural TFP since the Green revolution began. Over this time, Taiwan had no significant investment projects in agricultural R&D to enhance technical change, and no structural change in agricultural policy to link it to market mechanisms which improved production efficiency. In fact, Taiwan faced efficiency problems and a negative growth rate during the period of 2001 to 2012. As such, Taiwan’s agricultural development had fallen behind Japan and South Korea, which are considered small farming countries similar to Taiwan.
CONCLUSION
Most Asian countries are still considered “developing countries” and have small farming economies. Based on food security, farmers’ income, and the different stages of economic development, governments usually intervene and oversee agriculture by R&D, technical extension, market promotion, and various kinds of protection measures. However, trade barriers like tariffs and quotas to restrict imports—which protect domestic production by price support and input subsidies—have seen a reduction since the Agreement on Agriculture was implemented in 1995.
While there has been an increase of international trade in agricultural goods, it is expected that a significant spillover of technical capabilities and international trade activities will occur. And once there is a tendency in convergence effects on agricultural productivity and efficiency, it would strengthen the proposal for trade liberalization in agriculture.
This paper applies sequential Data Envelop Analysis (DEA) based on agricultural output and inputs of 15 Asian countries during period of 1961 to 2012. It estimates efficiency change, technical change, and total factor productivity (TFP) change by the output oriented Malmquist index. These estimated outcomes can be further tested by the convergence effects and determinants of productivity and efficiency.
The results indicate there is no convergence tendency in agricultural TFP change among Asian countries after 1995. Production efficiency has been increasing from country to country, but technical change needs more breakthrough developments. Our research implies that it is not an easy task to change internal production structures caused by external technical spillover effects owing to trade liberalization. Besides which, the main determinants for TFP in agriculture are R&D expenditures and capital formation. Further, our research reveals the importance of a basic agricultural environment and infrastructure. When compared, there are similar features among Taiwan, Japan, and South Korea, including a significant number of convergence effects on these three countries’ TFP change. Finally, our research implies that convergence is conditionally based on a highly organized infrastructure, but not trade liberalization. The results can be used to understand the reasons why most Asian countries are not interested in agricultural negotiation within the WTO.
REFERENCES
Choi, In (2001). “Unit Root Tests for Panel Data,” Journal of International Money and Finance, Volume 20(2): 249–272.
Chen,Po-Chi, Ming-Miin Yu, Ching-Cheng Chang, Shih-Hsun Hsu (2008). “Total Factor Productivity Growth in China's Agricultural Sector,” China Economic Review 19: 580–593.
FAO (2006). World agriculture: towards 2030/2050. Rome.
Hayami, Y. and Ruttan, V. M. (1985). Agricultural Development : An International Perspective, Johns Hopkins University Press, Baltimore.
Suhariyanto, Kecuk and Colin Thirtle(2001). “Asian Agricultural Productivity and Convergence,” Journal of Agricultural Economics 52(3): 96-110.
Date submitted: Nov. 28, 2017
Reviewed, edited and uploaded: Dec. 26, 2017