ABSTRACT
Indonesia has experienced significant changes during the last 10 years, primarily driven by increasing population, household’s income, and food supply, which ultimately shifted food consumption patterns. Changes in food consumption patterns that are increasingly diversified affect the government's policy in developing programs to increase food production, especially staple food, leading to fostering food sufficiency. To this end, active roles of farmer’s groups and cooperatives in the production process and marketing of the food products are crucial. The study aims to analyze the roles of cooperatives in responding changes in food consumption patterns in Indonesia. The study was based on reviews of relevant research results. The findings show that during the period of 2002-2014 a significant change in food consumption patterns has occurred, that lead to more diversified food consumption patterns. The roles of cooperatives in supporting such changes remain vital not only in providing production inputs and technology for farmers/producers, but also in marketing and distribution of food products. Strengthening cooperatives is important to ensure adequacy and availability of food products in the future.
Keyword: Cooperative, diversification of staple food, food consumption pattern
INTRODUCTION
One of the challenges of a country nowadays is to provide sufficient food and nutrition for its inhabitant, in terms of quantity, quality and timely supply. A proper understanding of the dynamics of food consumption patterns at household level is important for policy making process. Households’ food consumption relates to the food availability and affordability, both physically and economically.
In the food supply chain system, the roles of rural institution are quite crucial in the production process and marketing of the products. Farmer cooperatives are expected to serve as agent in the delivery of production inputs, food processing, marketing and distribution, which could support adequate and timely supply of foods at household level. An example of well-functioning cooperative is found in dairy cattle in West Java. This model could also be applied in the food crops sub-sector. Indeed, cooperatives have been established in several areas in Indonesia, and play important roles in the delivery of for production inputs, marketing of food production, and serving various needs its members. Based on this background, this study aims to analyze the roles of cooperatives in responding to changes in food consumption pattern.
METHODOLOGY
This study analyzes changes in household food consumption and the role of agricultural cooperatives in responding to these changes. The data source for the analysis of changes in household consumption patterns is derived from the National Socio-Economic Survey (Susenas) by the Indonesian Central Bureau of Statistics (CBS) in 2002 and 2014. Susenas is one of the major surveys conducted by CBS as a monitoring tool of socio-economic programs development. Consumption data is one of data collected in the survey. Consumption data is published every three years and covering 300 000 households.
Analysis of changes in household food consumption patterns is undertaken by aggregate, by region (rural-urban), and by income groups (low income, middle income, and high income). Grouping by income level referring to the classification of income groups used by the World Bank, namely (1) 40 percent of low income groups, (2) 40 percent of middle income groups, and (3) 20 percent of high income groups.
To respond to changes in household food consumption patterns, the role of cooperatives is important in supporting the production process and distribution of food commodities. The role of cooperatives will be analyzed based on the results of previous research.
RESULT AND DISCUSSION
Demography and Agriculture Sector in Indonesia
Indonesia is one of the countries with a large population. In 2015, total population is 255.5 million, and is estimated to increase to 271.1 million in 2020 (CBS, 2017). During 2015-2020, the population grows by 6.1 percent. Based on the population structure, Indonesia will have a demographic bonus, in which the number of productive population is greater than the number of children-age and elderly population. This demographic bonus will open-up opportunities for economic growth and welfare improvement, and at the same time also change the food expenditure and consumption pattern. The proportion of urban population increased from 49.8 percent in 2010 to 53.3 percent in 2015, and is predicted to be 56.7 percent in 2020. This will impact on changes in the food consumption pattern and level of food supply. According to Satterthwaite et al. (2010), the urbanization affects the direction of changes in aggregate food demand through increasing urban population and changes in food consumption patterns.
Over the past decade, change has not only occurred in the demographic aspect, but other aspects such as income levels, urbanization, employment opportunities, and technology changes in various sectors. According to Regmi (2001), increasing income, urbanization, demographic change, transportation, and consumer perception about quality and food safety affect the changing of world food consumption pattern.
The increase in population prompted the government to increase food production, especially rice as the staple food of the Indonesian population. According to CBS (2016), paddy production in Indonesia reached 75.4 million tons in 2015, equivalent to 47.3 million tons of rice. Total rice production is projected to increase by 3.4%/year during the 2001-2015 period. This increase in production can be achieved through the increasing of harvested area by 1.79% and productivity by 1.61%. Indonesia's rice consumption participation rate is close to 100% (Hermanto et al., 2016).
Efforts to increase food production, particularly rice, face considerable challenges, among other by the followings: (1) the status and size of smallholdings, where 9.55 million household own only less than 0.5 ha; (2) insufficient infrastructure such as roads, clean water and irrigation scheme, and energy; (3) limited access of farmers to capital and high banking interest rates; (4) weak capability and institutional capacity of farmers and agricultural extension workers; (5) limited managerial capability of farmers in agribusiness; and (6) extreme global climate change phenomena, natural disasters, and increased environmental damage. Among these problems, the availability of agricultural land is increasing due to the conversion of functions to non-agricultural purpose. During 2007-2010, the area of paddy field ownership per household decreased by 20.85 percent. In 2007, an average of 0.609 hectares became 0.482 hectares in 2010 (Suryani, 2015). The conversion of paddy field in Java reached 429.7 thousand hectares with a conversion rate of 2.34 percent/year (Irawan, 2012). Effort in increasing rice production is also hindered by the damage of irrigation schemes (Ministry of Agriculture, 2017).
Change in Household Expenditure Pattern
In aggregate, the share of household expenditure for food in 2014 was slightly smaller than in 2002. In 2002, the shares of food expenditure was still higher (above 50 percent) than non-food expenditure. Over a 12-year period, the allocation of household expenditures for non-food needs increased (Table 1). According to Soekirman (2000), households with a proportion of food expenditure ≥60 percent can be categorized as food insecurity, but on the contrary, a proportion of food expenditure <60 percent are categorized as food resistant. Based on this concept, households in Indonesia are categorized as food resistant in aggregate. By region, rural households were vulnerable to food in 2002 because the share of food expenditure was more than 60 percent. However, in 2014 there was a decrease in the share of food expenditure to 58.1 percent, in the category of food-resistant.
Table 1. Share of household expenditure by region, 2002 – 2014
|
Expenditure
|
Share of expenditure by region (%)
|
|
Agregat
|
Urban
|
Rural
|
|
2002
|
2014
|
Change
|
2002
|
2014
|
Change
|
2002
|
2014
|
Change
|
|
Food
|
52.6
|
51.0
|
-1.6
|
46.5
|
45.3
|
-1.2
|
62.7
|
58.1
|
-4.6
|
|
Non food
|
47.4
|
49.0
|
1.6
|
53.5
|
54.7
|
1.2
|
37.3
|
41.9
|
4.6
|
|
Total expenditure
|
100
|
100
|
0
|
100
|
100
|
0
|
100
|
100
|
0
|
Source: CBS, Susenas 2002 and 2014 (calculate)
The analysis by region (rural-urban) indicates the share of household expenditure for food in 2002 in urban areas averaged less than 50 percent, whereas in rural areas it reached 62.7 percent. During 12 years (2002-2014), there was a decrease in the share of food expenditure in both urban and rural areas. The increase of non food expenditure share in rural areas is almost four times greater than urban areas, at 4.6 percent. The share of food expenditure in rural areas in 2014 is relatively still high, at 58.1 percent, while the share of food expenditure in urban areas is less than 50 percent.
On the other hand, non-food expenditure has increased both in aggregate and by region (rural-urban). The change in non-food expenditure share in rural areas is relatively higher than urban areas. The development of information technology during the last decade, encouraging changes in people's lifestyles, where the need for non-food household consumption is increasing.
The share of food expenditure at household level by income group shows that the highest share of food expenditure is in low income group, followed by middle income group, and high income group (Table 2). In aggregate, the share of food expenditure at household level tend to decline in every income class, while and at the same time its non-food expenditure share tends to increase. The largest decreased of food expenditure share and increased of non-food expenditure share occurred in middle income class.
Table 2. Structure of household food expenditure by expenditure and income class, 2002 – 2014
|
Expenditure
|
Share of expenditure by income group (%)
|
|
Low income
|
Medium income
|
High income
|
|
2002
|
2014
|
Change
|
2002
|
2014
|
Change
|
2002
|
2014
|
Change
|
|
Food
|
67.3
|
66.3
|
-1.0
|
60.2
|
58.0
|
-2.2
|
40.9
|
40.2
|
-0.7
|
|
Non food
|
32.7
|
33.7
|
1.0
|
39.8
|
42.0
|
2.2
|
59.1
|
59.8
|
0.7
|
|
Total expenditure
|
100
|
100
|
-
|
100
|
100
|
-
|
100
|
100
|
-
|
Source: CBS, Susenas 2002 and 2014 (calculate)
Change in Food Consumption at Household Level
In 1999, both for the city and the village population in Indonesia, the largest share of household expenditure is grains. It was found that the spending for grains in the village population reached 22.1%. This is reasonable because the component of grains are staple foods consumed by most of the households such as rice, corn and wheat. Most people consume rice as the main staple food and rice is generally prepared and consumed in the household. After 14 years later, there was a fundamental change in spending patterns. The share of expenditure in processed food has been increasing significantly. This implies that the expenditure for rice consumed away from home has also been increasing accordingly (Ariani and Hermanto, 2015).
Based on the previous research, Suryani, et al. (2016) found that the shares of food expenditure in aggregate by food group is almost entirely decreased except for other consumption, processed food and beverages, tobacco and betel (Table 3). By region, the change is higher in rural areas. For example, the decline in the share of household expenditures for grains groups in urban areas is only 2.5 percent or less than the aggregate, while in rural areas it is 7.2 percent much larger than the aggregate figure (4.2 %).
The share of food expenditure tends to increase in foods such as fish / shrimp, milk, vegetables, fruits, miscellaneous food, processed food, and tobacco. The highest increase in expenditure was the consumption of processed food, in aggregate by 4.4 percent, while the highest decrease occurred in grain consumption of 4.2 percent. The change of cooking pattern might closely associate with the fact that the number of working women had been increasing from year to year. The CBS (2007) stated that the increase in female labor force participation during February 2006-February 2007 reached 2.12 million persons. They were mainly working in agriculture and trade sectors. At the same time, increasing participation for men only 287 thousand. The increasing number of women workers would consequently reduce the time available to prepare food at home.
Table 3. Structure of household food expenditure by food groups and region, 2002 – 2014
|
Food Groups
|
Share of expenditure by region (%)
|
|
Agregat
|
Urban
|
Rural
|
|
2002
|
2014
|
Change
|
2002
|
2014
|
Change
|
2002
|
2014
|
Change
|
|
Cereals
|
19.4
|
15.2
|
-4.2
|
14.3
|
11.8
|
-2.5
|
25.7
|
18.5
|
-7.2
|
|
Tubers
|
1.1
|
1.8
|
0.7
|
0.8
|
0.7
|
-0.1
|
1.4
|
2.8
|
1.4
|
|
Fish/Shrimp
|
9.0
|
9.9
|
0.9
|
8.3
|
8.9
|
0.6
|
9.9
|
10.9
|
1
|
|
Meat
|
4.8
|
3.6
|
-1.2
|
5.9
|
4.0
|
-1.9
|
3.6
|
3.2
|
-0.4
|
|
Egg
|
3.1
|
2.4
|
-0.7
|
3.2
|
2.4
|
-0.8
|
3.0
|
2.3
|
-0.7
|
|
Milk
|
2.4
|
2.9
|
0.5
|
3.3
|
3.9
|
0.6
|
1.2
|
2.0
|
0.8
|
|
Vegetables
|
8.1
|
8.4
|
0.3
|
7.3
|
7.0
|
-0.3
|
9.0
|
9.8
|
0.8
|
|
Legumes
|
3.1
|
2.2
|
-0.9
|
3.0
|
2.3
|
-0.7
|
3.4
|
2.2
|
-1.2
|
|
Fruits
|
5.0
|
5.1
|
0.1
|
5.5
|
5.6
|
0.1
|
4.4
|
4.6
|
0.2
|
|
Oil + fat
|
3.8
|
3.5
|
-0.3
|
3.3
|
2.9
|
-0.4
|
4.5
|
4.0
|
-0.5
|
|
Beverages
|
4.7
|
3.8
|
-0.9
|
4.1
|
3.2
|
-0.9
|
5.4
|
4.5
|
-0.9
|
|
Spices
|
2.6
|
2.0
|
-0.6
|
2.4
|
1.8
|
-0.6
|
2.9
|
2.2
|
-0.7
|
|
Miscellaneous food
|
5.5
|
6.1
|
0.6
|
6.7
|
7.3
|
0.6
|
3.9
|
4.9
|
1
|
|
Processed food/ beverages
|
16.1
|
20.5
|
4.4
|
21.4
|
26.9
|
5.5
|
9.5
|
14.3
|
4.8
|
|
Tobacco + betel
|
11.4
|
12.6
|
1.2
|
10.5
|
11.4
|
0.9
|
12.4
|
13.9
|
1.5
|
|
Total
|
100
|
100
|
-
|
100
|
100
|
-
|
100
|
100
|
-
|
Source: CBS, Susenas 2002 and 2014 (calculate) in Suryani, et al. (2016)
The share of food expenditure at household level for the grain group was the largest decrease in low income group, followed by middle and high income group (Table 4). Households with low income group tend to change grain purchases from better quality to lower because the price is cheaper. The share of household expenditure for food/beverage categories tends to increase for all income groups. The share of household expenditures for tuber, fish/shrimp and milk food groups increased in all income groups and the largest increase occurred in low income groups.
The largest decrease in expenditure was in grains category for all income groups and the largest decrease in the low-income group, followed by the middle-income group, and the smallest in the high-income group. For all income groups, the share of processed food expenditures showed an increase ranging from 3.5 to 4.7 percent during 12 years (2002-2014). The consumption of processed foods appears to be the choice of households, especially for households where female work outside the home or small households. For small households, consumption of processed food is more efficient than cooking meals at home.
In the low-income group, the share of food expenditure is still dominated for the purchase of staple food, followed by tobacco and betel group, processed food, vegetables and fish. As for the middle-income group, the consumption pattern is almost the same as the low-income group, only the share of the grains expenditure is lower, while the consumption of tobacco and betel food group is higher. The share of expenditure for consumption of processed food in the middle-income group is higher than low income group. In the high-income group, the share of grain food expenditure is relatively small, about 10 percent, while the share of expenditure for consumption of tobacco and betel, and processed food/beverages is relatively high, about twice of the middle income group.
Table 4. Structure of Household Food Expenditure by Food Groups and Income Class, 2002 – 2014
|
Food Groups
|
Share of expenditure by income group (%)
|
|
Low income
|
Medium income
|
High income
|
|
2002
|
2014
|
Change
|
2002
|
2014
|
Change
|
2002
|
2014
|
Change
|
|
Cereals
|
31.8
|
23.3
|
-8.5
|
20.3
|
16.3
|
-4
|
10.1
|
9.2
|
-0.9
|
|
Tubers
|
1.5
|
2.8
|
1.3
|
1.1
|
1.7
|
0.6
|
0.8
|
1.2
|
0.4
|
|
Fish/Shrimp
|
8.9
|
10.3
|
1.4
|
10.0
|
10.6
|
0.6
|
8.0
|
9.0
|
1
|
|
Meat
|
2.1
|
2.2
|
0.1
|
4.7
|
3.5
|
-1.2
|
6.9
|
4.7
|
-2.2
|
|
Egg
|
2.8
|
2.3
|
-0.5
|
3.4
|
2.5
|
-0.9
|
3.0
|
2.2
|
-0.8
|
|
Milk
|
0.8
|
1.4
|
0.6
|
2.0
|
2.6
|
0.6
|
3.9
|
4.3
|
0.4
|
|
Vegetables
|
9.5
|
10.6
|
1.1
|
8.7
|
9.0
|
0.3
|
6.4
|
6.4
|
0
|
|
Legumes
|
3.8
|
2.7
|
-1.1
|
3.4
|
2.4
|
-1
|
2.4
|
1.7
|
-0.7
|
|
Fruits
|
3.4
|
3.7
|
0.3
|
4.7
|
4.8
|
0.1
|
6.4
|
6.2
|
-0.2
|
|
Oil + fat
|
4.8
|
4.7
|
-0.1
|
4.1
|
3.8
|
-0.3
|
2.8
|
2.5
|
-0.3
|
|
Beverages
|
5.8
|
4.7
|
-1.1
|
5.0
|
4.1
|
-0.9
|
3.7
|
3.0
|
-0.7
|
|
Spices
|
2.9
|
2.4
|
-0.5
|
2.8
|
2.2
|
-0.6
|
2.2
|
1.6
|
-0.6
|
|
Miscellaneous food
|
3.4
|
4.5
|
1.1
|
4.7
|
5.6
|
0.9
|
7.7
|
7.6
|
-0.1
|
|
Processed food/ beverages
|
8.0
|
12.7
|
4.7
|
13.0
|
17.4
|
4.4
|
25.0
|
28.5
|
3.5
|
|
Tobacco + betel
|
10.5
|
11.7
|
1.2
|
12.1
|
13.5
|
1.4
|
10.7
|
11.9
|
1.2
|
|
Total
|
100
|
100
|
-
|
100
|
100
|
-
|
100
|
100
|
-
|
Source: CBS, Susenas 2002 and 2014 (calculate)
The variety of food consumed by households does not guarantee that household food consumption meets the minimum requirement of energy and protein. The Energy Sufficiency Standard (ESS) refers to the recommendations of the National Food and Nutrition VIII 2004, namely 2000 calories/capita/day for energy and 52 grams/capita/day for protein (FSA, 2015). Based on the ESS, there is still a shortage of energy consumption of about 20 kcal/capita/day in 2014, while the adequacy of protein has been met (Table 5).
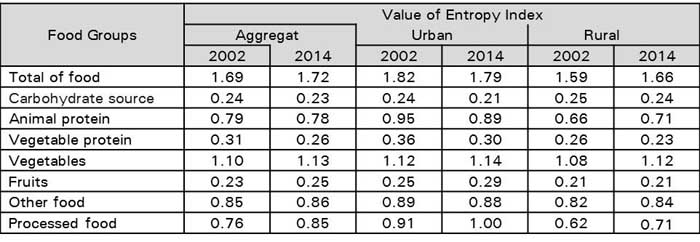
Changes in household food consumption patterns is not only seen from the changes in the quantity of food consumed, but can also be analyzed from the level of its diversification. The level of diversification of food consumption is generally measured from the value of the Entropy index (Erwidodo, 1999). The value of Entropy index of some food groups shown in Table 6.
Table 5. The Change in energy and protein consumption and share of animal protein by region, 2002 dan 2014
|
Expenditure
|
Energy and animal protein Consumption
|
|
Aggregat
|
Urban
|
Rural
|
|
2002
|
2014
|
Change
|
2002
|
2014
|
Change
|
2002
|
2014
|
Change
|
|
Energy
(kcal/cap/day)
|
2.089
|
1.980
|
-109
|
2.052
|
1.966
|
-86
|
2.118
|
1.990
|
-128
|
|
Protein
(gr/cap/day)
|
57,6
|
57,0
|
-0,6
|
59,3
|
60,0
|
0,7
|
56,2
|
54,8
|
-1,4
|
|
Share of animal protein (%)
|
21,3
|
26,0
|
4,7
|
24,0
|
27,1
|
3,1
|
19,1
|
25,2
|
6,1
|
Source: CBS, Susenas 2002 and 2014 (calculate)
Table 6. Diversification of household food consumption (Entropy index) by food groups and region, 2002 – 2014
Source: CBS, Susenas 2002 and 2014 (calculate)
Based on Table 6, the Entropy index for total food increased at the period of 2002-2014, indicated that in general the average household in Indonesia has reallocated expenditures for food consumption toward more diverse consumption among rice food groups -grains, tubers, fish, meat, fruit, vegetables, and so on (there are 17 food groups). For the food group of carbohydrate sources, the rate of diversification decreased in the same period, both in aggregate and by region (urban-rural). This was due to the consumption pattern of staple food in some areas that originally varied rice-tubers or rice-tubers-maize exactly change and lead to a single pattern of rice. Similarly, for food sources of animal protein in the period 2002-2014, the level of diversification of consumption also decreased. The high price of beef and the availability of fish affected by the seasons (the direction of the sea breeze) and the tastes, prompted some consumers to switch to the consumption of protein sources derived from poultry, especially chicken and eggs that are relatively cheaper and available all the time. This is supported by the declining consumption participation rate for beef and the participation of chicken, egg and fish consumption in both urban and rural and urban and aggregate.
It is interesting to note that diversification is increasing for food groups, namely vegetables, fruits, other foods, and processed foods. This is consistent in aggregate and by region (urban-rural). A relatively high increase (relative to other food groups) is diversification for food groups of vegetable protein and processed food sources.
During 2002-2014, the diversification for processed foods increased significantly as compared to other food groups. This is in line with the results of studies conducted by Random House (2010), American Heritage (2009) and Collins (2003) as referred by Ariani and Haryono (2014), which concluded that in the modern era, lifestyle changes the consumption of food and beverages, in which consumers demand more processed food industry/factory that is readily consumed or easily cooked with little or no other preparation. Increasing the diversity of consumption of processed foods needs to be accompanied by efforts to improve food safety. It is important to avoid or at least reduce cases of food poisoning, gastrointestinal infections and/or other diseases caused by the consumption of unhealthy foods.
Increased diversification of processed food consumption is in line with the household food expenditure structure as shown in Table 1. The development of food and culinary industry and limited time for some women who work to prepare food at home encourage households to choose the consumption of processed food.
Analysis by region shows that consumption of vegetables, fruits, other food and processed foods by urban population increased significantly. While in rural areas increased diversification of food occurs in all foods, vegetables, animal food, other food and processed food. For food sources of carbohydrates and vegetables, diversification of their consumption decreased, while for the fruits consumption it did not change during the period 2002-2014.
The pattern of food consumption diversification is different between rural and urban areas, in line with lifestyle differences, consumer knowledge about food and nutrition, availability and access to food and nutrition information, tastes, income levels, and other social/cultural factors. The development of processed food industry and the ease of obtaining processed food and the development of main culinary centers in urban areas would be a driving force for urban consumers to consume processed food. This is evident from the diversified level of food consumption for processed food by urban households that is higher than the average household in rural areas.
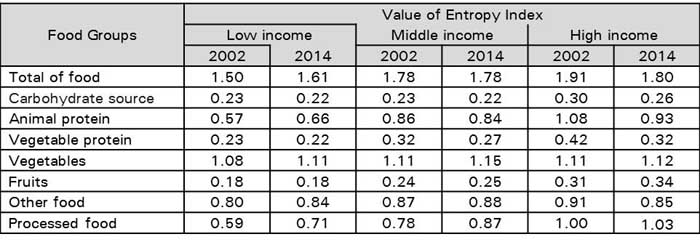
Table 7 presents the level of food consumption diversification during 2002-2014 by income group. It shows that for all food groups, the higher the income level, the higher the level of food consumption diversification. However, the diversification rate for some food groups differs between income groups, except for food as sources of carbohydrates, vegetables, and processed foods. In this case, the level of diversification of food consumption of carbohydrate sources decreased in all three groups of income, while for food and vegetable and food consumption diversification level increased in the three income groups.
At the period of 2002-2014, the diversification of consumption for all foods increased only in low income group households, this is in line with the previous analysis that the diversification of total food consumption only occurs in rural households. At the same time, the diversification of total food consumption in households with middle income group did not change, whereas in the high income group households actually decreased the level of diversification. These findings can serve as an indication of the emergence of multiple nutritional problems (i.e malnutrition and excess nutrients). In this case the decrease of diversification of food consumption for the total food group can be the trigger of excessive nutrition/obesity or imbalance of food consumption.
Table 7. Diversification of household food consumption (Entropy index) by food groups and income class, 2002 – 2014
Source: CBS, Susenas 2002 and 2014 (calculate)
Profile of Cooperatives in Indonesia
Before discussing the role of cooperatives in responding to changes in food consumption patterns, it is necessary to describe in advance the profile of cooperatives in Indonesia. The establishment of cooperatives in Indonesia began in the 20th century. The main purpose of the establishment of cooperatives is to promote the economy on the basis of a collaborative efforts that can ultimately improve the welfare of the people. The legal basis for the implementation of cooperatives refers to the 1945 Constitution article 33 paragraph 1 which states that the economy is organized as a joint effort based on the principle of kinship. Although the cooperatives has a long history in the world, but in Indonesia the milestone of the founding of the cooperative began on July 12, 1947 when it was held the first cooperative congress, held in Tasikmalaya, West Java - the date is now defined as the day of Indonesian Cooperatives. Now the cooperative continues to grow as important pillars of the economy in various fields.
Based on its function, cooperative is divided into four groups, namely (1) Cooperative purchasing/procurement/consumption, is a cooperative that organizes the function of purchasing or procurement of goods and services to meet the needs of members as the final consumer. Here members serve as owners and buyers or consumers for their cooperatives; (2) Sales / marketing cooperative is a cooperative which organizes the distribution function of goods or services produced by its members to reach the consumers' hands. In the form of sales cooperatives, members serve as owners and suppliers of goods or services to their cooperatives; (3) Production cooperative, is a cooperative that produce goods and services, where their members work as employees or employees of the cooperative. In this cooperative, members act as owners and cooperative workers; and (4) Cooperative service is a cooperative that provides services needed by members, for example: savings and loans, insurance, transportation, and so forth. In this cooperative, members act as owners and users of cooperative services. In practice, cooperatives may perform several functions or a combination of 1-4. Therefore, if the cooperative performs a function is called a single cooperative (single-purpose cooperative), while the cooperative that organizes more than one business function is called multi-cooperative business (multi-purpose cooperative).
Based on the level and working area, cooperative can be categorized as: (1) Primary cooperative, is a cooperative which has at least a membership of 20 individuals; (2) Secondary Cooperative is a cooperative consisting of a combination of cooperative bodies and has a wide scope of work area compared with primary cooperatives. Secondary cooperative can be divided into (1) Cooperative center that is cooperative consisting of at least 5 primary cooperatives, (2) Combined cooperative that is member of cooperatives of at least 3 central cooperatives, and (3) Parent cooperative is cooperative with minimum membership of 3 joint of cooperative.
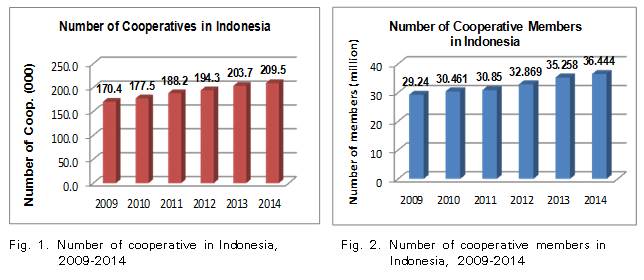
In its development, the number of cooperatives increased over time. During the period 2009-2014 there was an increase in the number of cooperatives as many as 39 thousand units of cooperatives or an increase of 18.7 percent. The number of cooperatives in 2014 reached 209.5 thousand units. Of the total units of Cooperatives, 147.2 thousand units are active cooperatives, while the remaining 62.2 thousand units (30%) are inactive cooperatives (Ministry of Cooperatives, 2015). The development of number of cooperatives during the period 2009-2014 is presented in Fig. 1.
As the number of cooperatives increased during the 2009-2014 period, the number of cooperative members also increased (Fig. 2). The addition of cooperative members during the period of 2009-2014 was 7.2 million people or 19.8 percent. If it is assumed that the percentage of inactive cooperative members is equal to 30%, then the number of active cooperative members in 2014 is 25.5 million people. If the population in Indonesia in 2014 is 250 million people, then the number of active people joined in the cooperative is only 10 percent. That is, the potential for the development of cooperatives in the future is still promising.
According to Susilo (2013), the future development of cooperatives is still constrained by various problems, among others, the trust of cooperatives. This decline is in line with inconsistent government policies and because of the weaknesses of the cooperative management itself. Therefore, the cooperative needs consolidate to improve its business management (Corporate Governance). The results of the Tambunan (2007) study also stated that many Indonesian, especially the "modern" people view cooperatives as less positive. Cooperatives are considered an institution that aims to help the poor. However, it can not be denied that there are still many cooperatives that perform well so it still survive until now, for example of South Bandung Farmers Cooperative (KPBS) that manage dairy cows from farmers of South Bandung region in West Java Province.
The Role of Cooperatives in Agricultural Development
Indonesia is one of the countries that still rely on agriculture sector in national economic development. The contribution of agriculture sector is the second largest in national income. One of the priority programs in the agricultural sector is to produce food commodities to meet the food needs of all Indonesians in accordance with Law No.7 / 1996 on Food and renewed in Food Law No.18 / 2012. Therefore, the government's efforts in increasing food production programs must involve all business actors, including rural cooperatives known as Village Unit Cooperatives (KUD).
The results of the Susilo study (2013) reveals that KUD has been actively involved not only in the procurement of grain / rice to support national rice stock but also involved in the provision of rice production facilities (production), processing and marketing for more than 30 years. The potential of cooperatives (in this case KUD) in the supply of grain and rice in the past few decades is quite large, whether viewed from the availability of facilities, as well as the availability of personnel. KUD has a very strong business attachment with farmers, although the success of KUD at that time was not optimal.
The substantial role of KUDs is involved in the supply of grain / rice, this has a positive impact on the government's efforts to achieve rice self-sufficiency achieved in 1984. Full government support to KUD through various policies to provide production inputs, production management and marketing has embarked KUD as reliable partners for farmers.
In the reform era, there have been many regulatory changes, and the role of cooperative in supporting food stability is decreasing, due to limited government’s support in terms of credit (soft loan) for input production and purchase of rice grains from farmers. This policy change encourages cooperatives to innovate, among others, by building models of services in the field of food such as rice banks, food barns, and rice processing centers. Policy changes that are less supportive of cooperatives, especially KUDs in rural areas have an impact on the decline in the number of active cooperatives. As an illustration, before the 1997 crisis there were more than 8000 cooperatives that participated in supporting the national food procurement program, but in the reform era (after 2003) the number of cooperatives decreased to less than 2000 cooperatives. However, if seen from the development of the number of cooperatives until 2014 shows an increase (Figure 1). The increasing number of cooperatives is the sum of all types of cooperatives, both directly and indirectly involved in the national food procurement program.
Perspective on the Role of Cooperatives in Responding to Changes in Consumption Patterns
It has been explained in the previous discussion that during the period of 2002-2014, there have been various changes in household food consumption patterns in Indonesia. The development of information technology through the ease of internet access, encouraging many changes, among others, the increasing employment opportunities in urban areas accessed by rural communities, both male and female labor, increasing women working outside the home, there are changes in lifestyle including the pattern of food consumption . Limited time for women breadwinners outside the home, encouraging them tend to choose the consumption of finished food because it is considered more cheap and practical. The existence of online technology, enabling the purchase of food including fast food can be ordered without having to leave the house. Changes in lifestyles in food consumption along with technological changes that are all practical and inexpensive, this should be responded by business actors including cooperative institutions.
Cooperatives as an institution that aims to improve the welfare of its members should be able to see emerging market opportunities in the community. Cooperatives should be able to make breakthroughs and create innovation in responding to the development of household food consumption patterns. Cooperative business patterns that rely heavily on financial support and various facilities from the government, it seems difficult to continue to survive. Cooperatives should be able to develop themselves by utilizing modern technology and establish cooperation with other related institutions.
One example of a modern cooperative that can be used as a model of cooperative management in the future is the Arrohmah Cooperative in Sukabumi, West Java. The concept of farmers' corporations in the cooperative is successfully carried out thoroughly, starting the process of production, processing results, until the sale of products into the retail industry. Marketing of products in addition to cooperation with the retail industry, also conducted through online media. Product packaging is also pursued in a modern way to provide a view that attracts consumers and is able to compete with the private sector. In terms of funding, cooperatives are already working with banking institutions. Profit results obtained, then distributed to all members of the cooperative. The success of Arrohmah Cooperative to become a modern cooperative capable of handling products from upstream to downstream has attracted the government replicate Cooperative Arrohmah in other regions.
Based on several studies on the performance of cooperatives, and the development of consumers and markets that are growing, cooperative should change to adjust the market or consumer demand. Cooperative perspectives forward, especially in responding to changes in household food consumption patterns, as follows:
(1) Management and organization
Cooperatives need to be directed to the principles of modern management and adaptive to the development of an increasingly advanced era and increasingly global challenges. Cooperatives in Indonesia need to imitate the implementation of Good Corporate Governance (GCG) that has been applied to companies incorporated company law. For regulators (Ministry of Cooperatives) need to introduce maximally a GCG concept or good cooperative governance. According to Fajri (2007), in the implementation of GCG, cooperatives need to ensure that the goal of establishing a cooperative is really to prosper its members. Ministry of Cooperatives and SMEs need to prepare cooperative blueprint management effectively and planned. In addition, it is also necessary to improve the internal conditions of the cooperative.
(2) Market oriented
To obtain maximum product sales results, the cooperative must be able to read the market signal, not only on the type of product, but also in the form of services needed by consumers. The cooperative must be keen to capture the market potential that can make a profit.
(3) Standards of service
Cooperatives should improve service standards and conduct regular audits, so that the role of cooperatives in improving the economy is more vital.
(4) Funding System
Cooperatives should not only rely on government assistance, but also must be able to move its members to participate actively and if necessary can cooperate with other business institutions, such as banking institutions to strengthen capital.
(5) Diversification of products and business
For cooperatives engaged in the food sector, in the future the cooperative should be able to diversify products and businesses. Cooperative activities that initially focus only on the process of production and sales of grain to Logistic Agency (Bulog), in the future should be able to develop new businesses that support the main business, such as processing business results and packaging with a customized measure of market tastes. Thus the products are marketed not only in the form of primary products, but able to sell processed products. Marketing is not only in the form of grain to Bulog, but is able to market various varieties of rice products to retail stores or through social media.
CONCLUSION
During the period 2002-2014, there has been a shift in the share of food and non-food consumption expenditure at the household level in Indonesia. The pattern of household food consumption leads to a decrease in food consumption of the grain group, whereas the consumption of processed food is likely to increase. This condition occurs in aggregate, by region, and income group. Based on the level of energy and protein adequacy, there is still a shortage of energy consumption in 2014, while protein consumption has met the standard of protein adequacy.
Increasing in consumption of processed food during the period 2002-2014 indicates the availability more diversified food products. However, the facts show that the increase in total food diversification occurs only in rural households and generally in low-income groups. For the high income groups the level of diversification tended to decrease. Changes in food consumption patterns to processed food are expected to increase steadily, triggered by an increase in the rate of urbanization and the number of women working outside the home.
To respond the changes in household food consumption patterns, the role of cooperatives is important in supporting the availability of food. Agricultural cooperatives are expected not only to assist the supply of inputs in the production process, but also to play a role in the distribution of farmers' products. The more diverse food products consumed by households, cooperatives are required to be more creative in selling products produced by farmers. Agricultural cooperatives can provide higher benefits to their members, when cooperatives are able to process primary products into processed products ready for consumption. Thus the cooperative and all its members will get the added value of the products.
REFERENCES
American Heritage. (2009) The American Heritage. Dictionary of the English Language. 4th Edition. Houghton Mifflin Company. Boston, New York.
Ariani and Haryono. 2014. Memperkuat Daya Saing Pangan Nusantara Mendukung Kedaulatan Pangan. Makalah disampaikan pada Seminar Memperkuat Daya Saing Produk Pertanian (Strengthening Nusantara Food Competitiveness in Support Food Sovereignity. Paper presented at Seminar “Strengthening Agricultural Products Competitiveness”), 29-30 September 2014. Cipayung.
Ariani, M. and Hermanto. 2015. Dinamika Konsumsi Pangan (Dynamic of Food Consumption). In Irawan, B., E. Ariningsih, and E. Pasandaran. (Editors). Panel Petani Nasional: Rekonstruksi Agenda Peningkatan Kesejahteraan Petani (National Panel of Farmers: Agenda of Recontruction for The Improvement of Farmer’s Welfare). IAARD Press.
Ariningsih, E. 2013. Economic Performance of Sugarcane Cooperatives and Their Impacts on Farmer-Members in East Java Province, Indonesia, 2012. Dissertation. The University of the Philippines Los Baños, Los Baños.
[CBS] Central Bureau of Statistics. 2016. Statistic of Indonesia. Jakarta.
Dardak, R.A. 2015. Cooperative Movement in the Supply Chain of Agricultural Products: Way Forwards. Submitted as a resource paper for the FFTC-NACF International Seminar on Improving Food Marketing Efficiency—the Role of Agricultural Cooperatives, Sept. 14-18, NACF, Seoul, Korea
[FSA] Food Security Agency. 2015. Direktori perkembangan konsumsi pangan (Directory of food consumption development) . Ministry of Agriculture, Jakarta.
Hermanto, H.P. Saliem, E. Suryani, M.Ariani, R.N.Suhaeti. 2016. Trends in food eaten away from home And the dynamic of Indonesian rice consumption. Research cooperation between Indonesian Center for Agricultural Socio Economics and Policy Studies (ICASEPS) and FAO.
[IAARD] Indonesian Agency for Agricultural Research and Development. 2007. Prospect and Direction of Sugarcane Agribusiness Development. 2nd Edition. IAARD, Ministry of Agriculture, Jakarta. (In Indonesian).
Inounu, I., Tj. D. Soedjana, and A. Priyanti. 2010. Market Opportunity for Milk in Indonesia. http://www.fao.org/ag/AGAinfo/programmes/en/pplpi/docarc/LLAX13.pdf (retrieved on May 8, 2010).
Irawan. (2012). Adaptasi perubahan iklim untuk mempertahankan produksi beras di Pulau Jawa (Climate change adaptation to maintain rice production in Java Island). Center for Agricultural Socio Economics, Ministry of Agriculture. Page 164-177. http//pse.litbang.pertanian.go.id/ind/pdffiles/Pros_2012_09A_MP_Irawan2.pdf. [download 2017 Agustus 3].
Malian, H., R. Sayuti, M. Ariani, and S. Mardianto. 2003. Impacts of Paddy/Rice Price Change on Production, Consumption and Inflation. Research Report. Indonesian Agriculture Social Economic and Policy Studies, Bogor.
Ministry of Agriculture. 2017. Peta Jalan (Roadmap) Pengembangan Komoditas Pertanian Strategis menuju Indonesia Sebagai Lumbung Pangan Dunia 2045/Ringkasan Eksekutif (Roadmap of strategic agricultural commodities development to Indonesia as a world food barrow 2045/Executive Summary). Ministry of Agriculture. Jakarta.
Ministry of Cooperatives. 2015. Annual Report 2015. Jakarta.
Parwez S. 2014. Supply chain dynamics of Indian agriculture: reference to information technology and knowledge management. Stewart Postharvest Review 2014,1:3. Available at www.stewartharvest.com
Prakash, D. 1997. My Association with the Indonesian Co-operative Movement — An Exercise in Self-Development. Co-op Dialogue, Vol. 7, No. 3, Sept–Dec. 1997, pp. 26–31.
Pratiwi, S.I.Y. 2015. The Role of Farmer Cooperatives in the Development of Coffee Value Chain in East Nusa Tenggara Indonesia. M.Sc. Thesis. Ghent University, Belgium.
Random House (2010) Random House Kernerman Webster's College Dictionary. K. Dictionaries. Ltd.
Regmi, A. 2001. Changing structure of global food consumption and trade. Market and Trade Economic Division. Economic Research Service. U.S. Department of Agriculture. Agricultural Trade Report. WRS-01-1.
Satterthwaite, D., G. Mc. Granahan, and C. Tacoli. 2010. Urbanization and its implications for food and farming. Phil.Trans.R.Soc.B (2010) 365,2809-2820. rstb.royalsocietypublishing.org. (download on 27 February 2015).
Soekirman. 2000. Ilmu gizi dan aplikasinya untuk keluarga dan masyarakat (Nutrition science and its application for family and society). Directorate General of Higher Education, Department of National Education. Jakarta.
Sulastri, E. and K.L. Maharjan. 2002. Role of Dairy Cooperative Services on Dairy Development in Indonesia: A Case study of Daerah Istimewa Yogyakarta Province. Journal of International Development and Cooperation. 9(1):17–39.
Suradisastra, K. 2006. Agricultural Cooperative in Indonesia. Paper presented at 2006 FFTC-NACF International Seminar on Agricultural Cooperatives in Asia: Innovations and Opportunities in the 21st Century, Seoul, Korea, 11-15 September 2006.
Suryani, E. (2015). Dampak Infrastruktur terhadap Penawaran Output dan Permintaan Input pada Tanaman Pangan: Pendekatan Multi Input-Multi Output (Impacts of rural infrastructure on supply and demand of Inputs for food crops in indonesia: A multi input-multi output approach). Disertasion. Bogor Agricultural University.
Susilo, E. 2013. Peran koperasi agribisnis dalam ketahanan pangan di Indonesia (Role of Agribussiness Cooperative in Food Security in Indonesia). Jurnal Dinamika Ekonomi & Bisnis, Vol 10(1): 95-103.
Tambunan, T. 2007. Prospek koperasi pengusaha dan petani di Indonesia dalam tekanan globalisasi ekonomi dan liberalisasi perdagangan dunia. http://www.kadin-indonesia.or.id/enm/images/dokumen/KADIN-98-2231-08102007.pdf
| Submitted as a country paper for the FFTC-NTIFO International Seminar on Enhancing Agricultural Cooperatives’ Roles in Response to Changes in Food Consumption Trends, Sept. 18-22, Taipei, Taiwan |

Perspective on the Role of Agricultural Cooperatives in Response to the Changing Food Consumption Pattern in Indonesia
ABSTRACT
Indonesia has experienced significant changes during the last 10 years, primarily driven by increasing population, household’s income, and food supply, which ultimately shifted food consumption patterns. Changes in food consumption patterns that are increasingly diversified affect the government's policy in developing programs to increase food production, especially staple food, leading to fostering food sufficiency. To this end, active roles of farmer’s groups and cooperatives in the production process and marketing of the food products are crucial. The study aims to analyze the roles of cooperatives in responding changes in food consumption patterns in Indonesia. The study was based on reviews of relevant research results. The findings show that during the period of 2002-2014 a significant change in food consumption patterns has occurred, that lead to more diversified food consumption patterns. The roles of cooperatives in supporting such changes remain vital not only in providing production inputs and technology for farmers/producers, but also in marketing and distribution of food products. Strengthening cooperatives is important to ensure adequacy and availability of food products in the future.
Keyword: Cooperative, diversification of staple food, food consumption pattern
INTRODUCTION
One of the challenges of a country nowadays is to provide sufficient food and nutrition for its inhabitant, in terms of quantity, quality and timely supply. A proper understanding of the dynamics of food consumption patterns at household level is important for policy making process. Households’ food consumption relates to the food availability and affordability, both physically and economically.
In the food supply chain system, the roles of rural institution are quite crucial in the production process and marketing of the products. Farmer cooperatives are expected to serve as agent in the delivery of production inputs, food processing, marketing and distribution, which could support adequate and timely supply of foods at household level. An example of well-functioning cooperative is found in dairy cattle in West Java. This model could also be applied in the food crops sub-sector. Indeed, cooperatives have been established in several areas in Indonesia, and play important roles in the delivery of for production inputs, marketing of food production, and serving various needs its members. Based on this background, this study aims to analyze the roles of cooperatives in responding to changes in food consumption pattern.
METHODOLOGY
This study analyzes changes in household food consumption and the role of agricultural cooperatives in responding to these changes. The data source for the analysis of changes in household consumption patterns is derived from the National Socio-Economic Survey (Susenas) by the Indonesian Central Bureau of Statistics (CBS) in 2002 and 2014. Susenas is one of the major surveys conducted by CBS as a monitoring tool of socio-economic programs development. Consumption data is one of data collected in the survey. Consumption data is published every three years and covering 300 000 households.
Analysis of changes in household food consumption patterns is undertaken by aggregate, by region (rural-urban), and by income groups (low income, middle income, and high income). Grouping by income level referring to the classification of income groups used by the World Bank, namely (1) 40 percent of low income groups, (2) 40 percent of middle income groups, and (3) 20 percent of high income groups.
RESULT AND DISCUSSION
Over the past decade, change has not only occurred in the demographic aspect, but other aspects such as income levels, urbanization, employment opportunities, and technology changes in various sectors. According to Regmi (2001), increasing income, urbanization, demographic change, transportation, and consumer perception about quality and food safety affect the changing of world food consumption pattern.
The increase in population prompted the government to increase food production, especially rice as the staple food of the Indonesian population. According to CBS (2016), paddy production in Indonesia reached 75.4 million tons in 2015, equivalent to 47.3 million tons of rice. Total rice production is projected to increase by 3.4%/year during the 2001-2015 period. This increase in production can be achieved through the increasing of harvested area by 1.79% and productivity by 1.61%. Indonesia's rice consumption participation rate is close to 100% (Hermanto et al., 2016).
Efforts to increase food production, particularly rice, face considerable challenges, among other by the followings: (1) the status and size of smallholdings, where 9.55 million household own only less than 0.5 ha; (2) insufficient infrastructure such as roads, clean water and irrigation scheme, and energy; (3) limited access of farmers to capital and high banking interest rates; (4) weak capability and institutional capacity of farmers and agricultural extension workers; (5) limited managerial capability of farmers in agribusiness; and (6) extreme global climate change phenomena, natural disasters, and increased environmental damage. Among these problems, the availability of agricultural land is increasing due to the conversion of functions to non-agricultural purpose. During 2007-2010, the area of paddy field ownership per household decreased by 20.85 percent. In 2007, an average of 0.609 hectares became 0.482 hectares in 2010 (Suryani, 2015). The conversion of paddy field in Java reached 429.7 thousand hectares with a conversion rate of 2.34 percent/year (Irawan, 2012). Effort in increasing rice production is also hindered by the damage of irrigation schemes (Ministry of Agriculture, 2017).
Change in Household Expenditure Pattern
In aggregate, the share of household expenditure for food in 2014 was slightly smaller than in 2002. In 2002, the shares of food expenditure was still higher (above 50 percent) than non-food expenditure. Over a 12-year period, the allocation of household expenditures for non-food needs increased (Table 1). According to Soekirman (2000), households with a proportion of food expenditure ≥60 percent can be categorized as food insecurity, but on the contrary, a proportion of food expenditure <60 percent are categorized as food resistant. Based on this concept, households in Indonesia are categorized as food resistant in aggregate. By region, rural households were vulnerable to food in 2002 because the share of food expenditure was more than 60 percent. However, in 2014 there was a decrease in the share of food expenditure to 58.1 percent, in the category of food-resistant.
Table 1. Share of household expenditure by region, 2002 – 2014
Expenditure
Share of expenditure by region (%)
Agregat
Urban
Rural
2002
2014
Change
2002
2014
Change
2002
2014
Change
Food
52.6
51.0
-1.6
46.5
45.3
-1.2
62.7
58.1
-4.6
Non food
47.4
49.0
1.6
53.5
54.7
1.2
37.3
41.9
4.6
Total expenditure
100
100
0
100
100
0
100
100
0
Source: CBS, Susenas 2002 and 2014 (calculate)
The analysis by region (rural-urban) indicates the share of household expenditure for food in 2002 in urban areas averaged less than 50 percent, whereas in rural areas it reached 62.7 percent. During 12 years (2002-2014), there was a decrease in the share of food expenditure in both urban and rural areas. The increase of non food expenditure share in rural areas is almost four times greater than urban areas, at 4.6 percent. The share of food expenditure in rural areas in 2014 is relatively still high, at 58.1 percent, while the share of food expenditure in urban areas is less than 50 percent.
On the other hand, non-food expenditure has increased both in aggregate and by region (rural-urban). The change in non-food expenditure share in rural areas is relatively higher than urban areas. The development of information technology during the last decade, encouraging changes in people's lifestyles, where the need for non-food household consumption is increasing.
The share of food expenditure at household level by income group shows that the highest share of food expenditure is in low income group, followed by middle income group, and high income group (Table 2). In aggregate, the share of food expenditure at household level tend to decline in every income class, while and at the same time its non-food expenditure share tends to increase. The largest decreased of food expenditure share and increased of non-food expenditure share occurred in middle income class.
Table 2. Structure of household food expenditure by expenditure and income class, 2002 – 2014
Expenditure
Share of expenditure by income group (%)
Low income
Medium income
High income
2002
2014
Change
2002
2014
Change
2002
2014
Change
Food
67.3
66.3
-1.0
60.2
58.0
-2.2
40.9
40.2
-0.7
Non food
32.7
33.7
1.0
39.8
42.0
2.2
59.1
59.8
0.7
Total expenditure
100
100
-
100
100
-
100
100
-
Source: CBS, Susenas 2002 and 2014 (calculate)
Change in Food Consumption at Household Level
In 1999, both for the city and the village population in Indonesia, the largest share of household expenditure is grains. It was found that the spending for grains in the village population reached 22.1%. This is reasonable because the component of grains are staple foods consumed by most of the households such as rice, corn and wheat. Most people consume rice as the main staple food and rice is generally prepared and consumed in the household. After 14 years later, there was a fundamental change in spending patterns. The share of expenditure in processed food has been increasing significantly. This implies that the expenditure for rice consumed away from home has also been increasing accordingly (Ariani and Hermanto, 2015).
Based on the previous research, Suryani, et al. (2016) found that the shares of food expenditure in aggregate by food group is almost entirely decreased except for other consumption, processed food and beverages, tobacco and betel (Table 3). By region, the change is higher in rural areas. For example, the decline in the share of household expenditures for grains groups in urban areas is only 2.5 percent or less than the aggregate, while in rural areas it is 7.2 percent much larger than the aggregate figure (4.2 %).
Table 3. Structure of household food expenditure by food groups and region, 2002 – 2014
Food Groups
Share of expenditure by region (%)
Agregat
Urban
Rural
2002
2014
Change
2002
2014
Change
2002
2014
Change
Cereals
19.4
15.2
-4.2
14.3
11.8
-2.5
25.7
18.5
-7.2
Tubers
1.1
1.8
0.7
0.8
0.7
-0.1
1.4
2.8
1.4
Fish/Shrimp
9.0
9.9
0.9
8.3
8.9
0.6
9.9
10.9
1
Meat
4.8
3.6
-1.2
5.9
4.0
-1.9
3.6
3.2
-0.4
Egg
3.1
2.4
-0.7
3.2
2.4
-0.8
3.0
2.3
-0.7
Milk
2.4
2.9
0.5
3.3
3.9
0.6
1.2
2.0
0.8
Vegetables
8.1
8.4
0.3
7.3
7.0
-0.3
9.0
9.8
0.8
Legumes
3.1
2.2
-0.9
3.0
2.3
-0.7
3.4
2.2
-1.2
Fruits
5.0
5.1
0.1
5.5
5.6
0.1
4.4
4.6
0.2
Oil + fat
3.8
3.5
-0.3
3.3
2.9
-0.4
4.5
4.0
-0.5
Beverages
4.7
3.8
-0.9
4.1
3.2
-0.9
5.4
4.5
-0.9
Spices
2.6
2.0
-0.6
2.4
1.8
-0.6
2.9
2.2
-0.7
Miscellaneous food
5.5
6.1
0.6
6.7
7.3
0.6
3.9
4.9
1
Processed food/ beverages
16.1
20.5
4.4
21.4
26.9
5.5
9.5
14.3
4.8
Tobacco + betel
11.4
12.6
1.2
10.5
11.4
0.9
12.4
13.9
1.5
Total
100
100
-
100
100
-
100
100
-
Source: CBS, Susenas 2002 and 2014 (calculate) in Suryani, et al. (2016)
The share of food expenditure at household level for the grain group was the largest decrease in low income group, followed by middle and high income group (Table 4). Households with low income group tend to change grain purchases from better quality to lower because the price is cheaper. The share of household expenditure for food/beverage categories tends to increase for all income groups. The share of household expenditures for tuber, fish/shrimp and milk food groups increased in all income groups and the largest increase occurred in low income groups.
The largest decrease in expenditure was in grains category for all income groups and the largest decrease in the low-income group, followed by the middle-income group, and the smallest in the high-income group. For all income groups, the share of processed food expenditures showed an increase ranging from 3.5 to 4.7 percent during 12 years (2002-2014). The consumption of processed foods appears to be the choice of households, especially for households where female work outside the home or small households. For small households, consumption of processed food is more efficient than cooking meals at home.
Table 4. Structure of Household Food Expenditure by Food Groups and Income Class, 2002 – 2014
Food Groups
Share of expenditure by income group (%)
Low income
Medium income
High income
2002
2014
Change
2002
2014
Change
2002
2014
Change
Cereals
31.8
23.3
-8.5
20.3
16.3
-4
10.1
9.2
-0.9
Tubers
1.5
2.8
1.3
1.1
1.7
0.6
0.8
1.2
0.4
Fish/Shrimp
8.9
10.3
1.4
10.0
10.6
0.6
8.0
9.0
1
Meat
2.1
2.2
0.1
4.7
3.5
-1.2
6.9
4.7
-2.2
Egg
2.8
2.3
-0.5
3.4
2.5
-0.9
3.0
2.2
-0.8
Milk
0.8
1.4
0.6
2.0
2.6
0.6
3.9
4.3
0.4
Vegetables
9.5
10.6
1.1
8.7
9.0
0.3
6.4
6.4
0
Legumes
3.8
2.7
-1.1
3.4
2.4
-1
2.4
1.7
-0.7
Fruits
3.4
3.7
0.3
4.7
4.8
0.1
6.4
6.2
-0.2
Oil + fat
4.8
4.7
-0.1
4.1
3.8
-0.3
2.8
2.5
-0.3
Beverages
5.8
4.7
-1.1
5.0
4.1
-0.9
3.7
3.0
-0.7
Spices
2.9
2.4
-0.5
2.8
2.2
-0.6
2.2
1.6
-0.6
Miscellaneous food
3.4
4.5
1.1
4.7
5.6
0.9
7.7
7.6
-0.1
Processed food/ beverages
8.0
12.7
4.7
13.0
17.4
4.4
25.0
28.5
3.5
Tobacco + betel
10.5
11.7
1.2
12.1
13.5
1.4
10.7
11.9
1.2
Total
100
100
-
100
100
-
100
100
-
Source: CBS, Susenas 2002 and 2014 (calculate)
The variety of food consumed by households does not guarantee that household food consumption meets the minimum requirement of energy and protein. The Energy Sufficiency Standard (ESS) refers to the recommendations of the National Food and Nutrition VIII 2004, namely 2000 calories/capita/day for energy and 52 grams/capita/day for protein (FSA, 2015). Based on the ESS, there is still a shortage of energy consumption of about 20 kcal/capita/day in 2014, while the adequacy of protein has been met (Table 5).
Changes in household food consumption patterns is not only seen from the changes in the quantity of food consumed, but can also be analyzed from the level of its diversification. The level of diversification of food consumption is generally measured from the value of the Entropy index (Erwidodo, 1999). The value of Entropy index of some food groups shown in Table 6.
Table 5. The Change in energy and protein consumption and share of animal protein by region, 2002 dan 2014
Expenditure
Energy and animal protein Consumption
Aggregat
Urban
Rural
2002
2014
Change
2002
2014
Change
2002
2014
Change
Energy
(kcal/cap/day)
2.089
1.980
-109
2.052
1.966
-86
2.118
1.990
-128
Protein
(gr/cap/day)
57,6
57,0
-0,6
59,3
60,0
0,7
56,2
54,8
-1,4
Share of animal protein (%)
21,3
26,0
4,7
24,0
27,1
3,1
19,1
25,2
6,1
Source: CBS, Susenas 2002 and 2014 (calculate)
Table 6. Diversification of household food consumption (Entropy index) by food groups and region, 2002 – 2014
Source: CBS, Susenas 2002 and 2014 (calculate)
Based on Table 6, the Entropy index for total food increased at the period of 2002-2014, indicated that in general the average household in Indonesia has reallocated expenditures for food consumption toward more diverse consumption among rice food groups -grains, tubers, fish, meat, fruit, vegetables, and so on (there are 17 food groups). For the food group of carbohydrate sources, the rate of diversification decreased in the same period, both in aggregate and by region (urban-rural). This was due to the consumption pattern of staple food in some areas that originally varied rice-tubers or rice-tubers-maize exactly change and lead to a single pattern of rice. Similarly, for food sources of animal protein in the period 2002-2014, the level of diversification of consumption also decreased. The high price of beef and the availability of fish affected by the seasons (the direction of the sea breeze) and the tastes, prompted some consumers to switch to the consumption of protein sources derived from poultry, especially chicken and eggs that are relatively cheaper and available all the time. This is supported by the declining consumption participation rate for beef and the participation of chicken, egg and fish consumption in both urban and rural and urban and aggregate.
It is interesting to note that diversification is increasing for food groups, namely vegetables, fruits, other foods, and processed foods. This is consistent in aggregate and by region (urban-rural). A relatively high increase (relative to other food groups) is diversification for food groups of vegetable protein and processed food sources.
During 2002-2014, the diversification for processed foods increased significantly as compared to other food groups. This is in line with the results of studies conducted by Random House (2010), American Heritage (2009) and Collins (2003) as referred by Ariani and Haryono (2014), which concluded that in the modern era, lifestyle changes the consumption of food and beverages, in which consumers demand more processed food industry/factory that is readily consumed or easily cooked with little or no other preparation. Increasing the diversity of consumption of processed foods needs to be accompanied by efforts to improve food safety. It is important to avoid or at least reduce cases of food poisoning, gastrointestinal infections and/or other diseases caused by the consumption of unhealthy foods.
Increased diversification of processed food consumption is in line with the household food expenditure structure as shown in Table 1. The development of food and culinary industry and limited time for some women who work to prepare food at home encourage households to choose the consumption of processed food.
Analysis by region shows that consumption of vegetables, fruits, other food and processed foods by urban population increased significantly. While in rural areas increased diversification of food occurs in all foods, vegetables, animal food, other food and processed food. For food sources of carbohydrates and vegetables, diversification of their consumption decreased, while for the fruits consumption it did not change during the period 2002-2014.
The pattern of food consumption diversification is different between rural and urban areas, in line with lifestyle differences, consumer knowledge about food and nutrition, availability and access to food and nutrition information, tastes, income levels, and other social/cultural factors. The development of processed food industry and the ease of obtaining processed food and the development of main culinary centers in urban areas would be a driving force for urban consumers to consume processed food. This is evident from the diversified level of food consumption for processed food by urban households that is higher than the average household in rural areas.
Table 7 presents the level of food consumption diversification during 2002-2014 by income group. It shows that for all food groups, the higher the income level, the higher the level of food consumption diversification. However, the diversification rate for some food groups differs between income groups, except for food as sources of carbohydrates, vegetables, and processed foods. In this case, the level of diversification of food consumption of carbohydrate sources decreased in all three groups of income, while for food and vegetable and food consumption diversification level increased in the three income groups.
At the period of 2002-2014, the diversification of consumption for all foods increased only in low income group households, this is in line with the previous analysis that the diversification of total food consumption only occurs in rural households. At the same time, the diversification of total food consumption in households with middle income group did not change, whereas in the high income group households actually decreased the level of diversification. These findings can serve as an indication of the emergence of multiple nutritional problems (i.e malnutrition and excess nutrients). In this case the decrease of diversification of food consumption for the total food group can be the trigger of excessive nutrition/obesity or imbalance of food consumption.
Table 7. Diversification of household food consumption (Entropy index) by food groups and income class, 2002 – 2014
Source: CBS, Susenas 2002 and 2014 (calculate)
Profile of Cooperatives in Indonesia
Before discussing the role of cooperatives in responding to changes in food consumption patterns, it is necessary to describe in advance the profile of cooperatives in Indonesia. The establishment of cooperatives in Indonesia began in the 20th century. The main purpose of the establishment of cooperatives is to promote the economy on the basis of a collaborative efforts that can ultimately improve the welfare of the people. The legal basis for the implementation of cooperatives refers to the 1945 Constitution article 33 paragraph 1 which states that the economy is organized as a joint effort based on the principle of kinship. Although the cooperatives has a long history in the world, but in Indonesia the milestone of the founding of the cooperative began on July 12, 1947 when it was held the first cooperative congress, held in Tasikmalaya, West Java - the date is now defined as the day of Indonesian Cooperatives. Now the cooperative continues to grow as important pillars of the economy in various fields.
Based on its function, cooperative is divided into four groups, namely (1) Cooperative purchasing/procurement/consumption, is a cooperative that organizes the function of purchasing or procurement of goods and services to meet the needs of members as the final consumer. Here members serve as owners and buyers or consumers for their cooperatives; (2) Sales / marketing cooperative is a cooperative which organizes the distribution function of goods or services produced by its members to reach the consumers' hands. In the form of sales cooperatives, members serve as owners and suppliers of goods or services to their cooperatives; (3) Production cooperative, is a cooperative that produce goods and services, where their members work as employees or employees of the cooperative. In this cooperative, members act as owners and cooperative workers; and (4) Cooperative service is a cooperative that provides services needed by members, for example: savings and loans, insurance, transportation, and so forth. In this cooperative, members act as owners and users of cooperative services. In practice, cooperatives may perform several functions or a combination of 1-4. Therefore, if the cooperative performs a function is called a single cooperative (single-purpose cooperative), while the cooperative that organizes more than one business function is called multi-cooperative business (multi-purpose cooperative).
Based on the level and working area, cooperative can be categorized as: (1) Primary cooperative, is a cooperative which has at least a membership of 20 individuals; (2) Secondary Cooperative is a cooperative consisting of a combination of cooperative bodies and has a wide scope of work area compared with primary cooperatives. Secondary cooperative can be divided into (1) Cooperative center that is cooperative consisting of at least 5 primary cooperatives, (2) Combined cooperative that is member of cooperatives of at least 3 central cooperatives, and (3) Parent cooperative is cooperative with minimum membership of 3 joint of cooperative.
In its development, the number of cooperatives increased over time. During the period 2009-2014 there was an increase in the number of cooperatives as many as 39 thousand units of cooperatives or an increase of 18.7 percent. The number of cooperatives in 2014 reached 209.5 thousand units. Of the total units of Cooperatives, 147.2 thousand units are active cooperatives, while the remaining 62.2 thousand units (30%) are inactive cooperatives (Ministry of Cooperatives, 2015). The development of number of cooperatives during the period 2009-2014 is presented in Fig. 1.
As the number of cooperatives increased during the 2009-2014 period, the number of cooperative members also increased (Fig. 2). The addition of cooperative members during the period of 2009-2014 was 7.2 million people or 19.8 percent. If it is assumed that the percentage of inactive cooperative members is equal to 30%, then the number of active cooperative members in 2014 is 25.5 million people. If the population in Indonesia in 2014 is 250 million people, then the number of active people joined in the cooperative is only 10 percent. That is, the potential for the development of cooperatives in the future is still promising.
According to Susilo (2013), the future development of cooperatives is still constrained by various problems, among others, the trust of cooperatives. This decline is in line with inconsistent government policies and because of the weaknesses of the cooperative management itself. Therefore, the cooperative needs consolidate to improve its business management (Corporate Governance). The results of the Tambunan (2007) study also stated that many Indonesian, especially the "modern" people view cooperatives as less positive. Cooperatives are considered an institution that aims to help the poor. However, it can not be denied that there are still many cooperatives that perform well so it still survive until now, for example of South Bandung Farmers Cooperative (KPBS) that manage dairy cows from farmers of South Bandung region in West Java Province.
The Role of Cooperatives in Agricultural Development
Indonesia is one of the countries that still rely on agriculture sector in national economic development. The contribution of agriculture sector is the second largest in national income. One of the priority programs in the agricultural sector is to produce food commodities to meet the food needs of all Indonesians in accordance with Law No.7 / 1996 on Food and renewed in Food Law No.18 / 2012. Therefore, the government's efforts in increasing food production programs must involve all business actors, including rural cooperatives known as Village Unit Cooperatives (KUD).
The results of the Susilo study (2013) reveals that KUD has been actively involved not only in the procurement of grain / rice to support national rice stock but also involved in the provision of rice production facilities (production), processing and marketing for more than 30 years. The potential of cooperatives (in this case KUD) in the supply of grain and rice in the past few decades is quite large, whether viewed from the availability of facilities, as well as the availability of personnel. KUD has a very strong business attachment with farmers, although the success of KUD at that time was not optimal.
The substantial role of KUDs is involved in the supply of grain / rice, this has a positive impact on the government's efforts to achieve rice self-sufficiency achieved in 1984. Full government support to KUD through various policies to provide production inputs, production management and marketing has embarked KUD as reliable partners for farmers.
In the reform era, there have been many regulatory changes, and the role of cooperative in supporting food stability is decreasing, due to limited government’s support in terms of credit (soft loan) for input production and purchase of rice grains from farmers. This policy change encourages cooperatives to innovate, among others, by building models of services in the field of food such as rice banks, food barns, and rice processing centers. Policy changes that are less supportive of cooperatives, especially KUDs in rural areas have an impact on the decline in the number of active cooperatives. As an illustration, before the 1997 crisis there were more than 8000 cooperatives that participated in supporting the national food procurement program, but in the reform era (after 2003) the number of cooperatives decreased to less than 2000 cooperatives. However, if seen from the development of the number of cooperatives until 2014 shows an increase (Figure 1). The increasing number of cooperatives is the sum of all types of cooperatives, both directly and indirectly involved in the national food procurement program.
Perspective on the Role of Cooperatives in Responding to Changes in Consumption Patterns
It has been explained in the previous discussion that during the period of 2002-2014, there have been various changes in household food consumption patterns in Indonesia. The development of information technology through the ease of internet access, encouraging many changes, among others, the increasing employment opportunities in urban areas accessed by rural communities, both male and female labor, increasing women working outside the home, there are changes in lifestyle including the pattern of food consumption . Limited time for women breadwinners outside the home, encouraging them tend to choose the consumption of finished food because it is considered more cheap and practical. The existence of online technology, enabling the purchase of food including fast food can be ordered without having to leave the house. Changes in lifestyles in food consumption along with technological changes that are all practical and inexpensive, this should be responded by business actors including cooperative institutions.
Cooperatives as an institution that aims to improve the welfare of its members should be able to see emerging market opportunities in the community. Cooperatives should be able to make breakthroughs and create innovation in responding to the development of household food consumption patterns. Cooperative business patterns that rely heavily on financial support and various facilities from the government, it seems difficult to continue to survive. Cooperatives should be able to develop themselves by utilizing modern technology and establish cooperation with other related institutions.
One example of a modern cooperative that can be used as a model of cooperative management in the future is the Arrohmah Cooperative in Sukabumi, West Java. The concept of farmers' corporations in the cooperative is successfully carried out thoroughly, starting the process of production, processing results, until the sale of products into the retail industry. Marketing of products in addition to cooperation with the retail industry, also conducted through online media. Product packaging is also pursued in a modern way to provide a view that attracts consumers and is able to compete with the private sector. In terms of funding, cooperatives are already working with banking institutions. Profit results obtained, then distributed to all members of the cooperative. The success of Arrohmah Cooperative to become a modern cooperative capable of handling products from upstream to downstream has attracted the government replicate Cooperative Arrohmah in other regions.
Based on several studies on the performance of cooperatives, and the development of consumers and markets that are growing, cooperative should change to adjust the market or consumer demand. Cooperative perspectives forward, especially in responding to changes in household food consumption patterns, as follows:
(1) Management and organization
Cooperatives need to be directed to the principles of modern management and adaptive to the development of an increasingly advanced era and increasingly global challenges. Cooperatives in Indonesia need to imitate the implementation of Good Corporate Governance (GCG) that has been applied to companies incorporated company law. For regulators (Ministry of Cooperatives) need to introduce maximally a GCG concept or good cooperative governance. According to Fajri (2007), in the implementation of GCG, cooperatives need to ensure that the goal of establishing a cooperative is really to prosper its members. Ministry of Cooperatives and SMEs need to prepare cooperative blueprint management effectively and planned. In addition, it is also necessary to improve the internal conditions of the cooperative.
(2) Market oriented
To obtain maximum product sales results, the cooperative must be able to read the market signal, not only on the type of product, but also in the form of services needed by consumers. The cooperative must be keen to capture the market potential that can make a profit.
(3) Standards of service
Cooperatives should improve service standards and conduct regular audits, so that the role of cooperatives in improving the economy is more vital.
(4) Funding System
Cooperatives should not only rely on government assistance, but also must be able to move its members to participate actively and if necessary can cooperate with other business institutions, such as banking institutions to strengthen capital.
(5) Diversification of products and business
For cooperatives engaged in the food sector, in the future the cooperative should be able to diversify products and businesses. Cooperative activities that initially focus only on the process of production and sales of grain to Logistic Agency (Bulog), in the future should be able to develop new businesses that support the main business, such as processing business results and packaging with a customized measure of market tastes. Thus the products are marketed not only in the form of primary products, but able to sell processed products. Marketing is not only in the form of grain to Bulog, but is able to market various varieties of rice products to retail stores or through social media.
CONCLUSION
During the period 2002-2014, there has been a shift in the share of food and non-food consumption expenditure at the household level in Indonesia. The pattern of household food consumption leads to a decrease in food consumption of the grain group, whereas the consumption of processed food is likely to increase. This condition occurs in aggregate, by region, and income group. Based on the level of energy and protein adequacy, there is still a shortage of energy consumption in 2014, while protein consumption has met the standard of protein adequacy.
REFERENCES
American Heritage. (2009) The American Heritage. Dictionary of the English Language. 4th Edition. Houghton Mifflin Company. Boston, New York.
Ariani, M. and Hermanto. 2015. Dinamika Konsumsi Pangan (Dynamic of Food Consumption). In Irawan, B., E. Ariningsih, and E. Pasandaran. (Editors). Panel Petani Nasional: Rekonstruksi Agenda Peningkatan Kesejahteraan Petani (National Panel of Farmers: Agenda of Recontruction for The Improvement of Farmer’s Welfare). IAARD Press.
Ariningsih, E. 2013. Economic Performance of Sugarcane Cooperatives and Their Impacts on Farmer-Members in East Java Province, Indonesia, 2012. Dissertation. The University of the Philippines Los Baños, Los Baños.
Dardak, R.A. 2015. Cooperative Movement in the Supply Chain of Agricultural Products: Way Forwards. Submitted as a resource paper for the FFTC-NACF International Seminar on Improving Food Marketing Efficiency—the Role of Agricultural Cooperatives, Sept. 14-18, NACF, Seoul, Korea
[FSA] Food Security Agency. 2015. Direktori perkembangan konsumsi pangan (Directory of food consumption development) . Ministry of Agriculture, Jakarta.
Hermanto, H.P. Saliem, E. Suryani, M.Ariani, R.N.Suhaeti. 2016. Trends in food eaten away from home And the dynamic of Indonesian rice consumption. Research cooperation between Indonesian Center for Agricultural Socio Economics and Policy Studies (ICASEPS) and FAO.
[IAARD] Indonesian Agency for Agricultural Research and Development. 2007. Prospect and Direction of Sugarcane Agribusiness Development. 2nd Edition. IAARD, Ministry of Agriculture, Jakarta. (In Indonesian).
Inounu, I., Tj. D. Soedjana, and A. Priyanti. 2010. Market Opportunity for Milk in Indonesia. http://www.fao.org/ag/AGAinfo/programmes/en/pplpi/docarc/LLAX13.pdf (retrieved on May 8, 2010).
Parwez S. 2014. Supply chain dynamics of Indian agriculture: reference to information technology and knowledge management. Stewart Postharvest Review 2014,1:3. Available at www.stewartharvest.com
Prakash, D. 1997. My Association with the Indonesian Co-operative Movement — An Exercise in Self-Development. Co-op Dialogue, Vol. 7, No. 3, Sept–Dec. 1997, pp. 26–31.
Pratiwi, S.I.Y. 2015. The Role of Farmer Cooperatives in the Development of Coffee Value Chain in East Nusa Tenggara Indonesia. M.Sc. Thesis. Ghent University, Belgium.
Random House (2010) Random House Kernerman Webster's College Dictionary. K. Dictionaries. Ltd.
Regmi, A. 2001. Changing structure of global food consumption and trade. Market and Trade Economic Division. Economic Research Service. U.S. Department of Agriculture. Agricultural Trade Report. WRS-01-1.
Satterthwaite, D., G. Mc. Granahan, and C. Tacoli. 2010. Urbanization and its implications for food and farming. Phil.Trans.R.Soc.B (2010) 365,2809-2820. rstb.royalsocietypublishing.org. (download on 27 February 2015).
Sulastri, E. and K.L. Maharjan. 2002. Role of Dairy Cooperative Services on Dairy Development in Indonesia: A Case study of Daerah Istimewa Yogyakarta Province. Journal of International Development and Cooperation. 9(1):17–39.
Suradisastra, K. 2006. Agricultural Cooperative in Indonesia. Paper presented at 2006 FFTC-NACF International Seminar on Agricultural Cooperatives in Asia: Innovations and Opportunities in the 21st Century, Seoul, Korea, 11-15 September 2006.
Suryani, E. (2015). Dampak Infrastruktur terhadap Penawaran Output dan Permintaan Input pada Tanaman Pangan: Pendekatan Multi Input-Multi Output (Impacts of rural infrastructure on supply and demand of Inputs for food crops in indonesia: A multi input-multi output approach). Disertasion. Bogor Agricultural University.
Susilo, E. 2013. Peran koperasi agribisnis dalam ketahanan pangan di Indonesia (Role of Agribussiness Cooperative in Food Security in Indonesia). Jurnal Dinamika Ekonomi & Bisnis, Vol 10(1): 95-103.
Tambunan, T. 2007. Prospek koperasi pengusaha dan petani di Indonesia dalam tekanan globalisasi ekonomi dan liberalisasi perdagangan dunia. http://www.kadin-indonesia.or.id/enm/images/dokumen/KADIN-98-2231-08102007.pdf