ABSTRACT
The survey of 611 farmers was conducted to provide insights on Korea’s crop insurance. The types of major disasters that the respondents experienced consist of typhoons, heavy rainfall, pests and diseases, etc. They were informed of crop insurance through various sources, such as education, television and radio, newspaper/magazines, neighbors, promotional brochures, banners, and the internet. The reasons for not purchasing insurance include high farmers payed insurance premium(14%), insufficient damage assessment systems (13%), limited coverage plans (13%), small insurance money (12%), lack of publicity, dissatisfaction with company services, and insignificant government subsidies. Farmers who had previously purchased crop insurance had a high repurchase rate (86%) while 74% of the groups who had never been insured expressed interests in buying coverage. One example of crop insurance is as follows: In Cheongsong-gun Gyeongsangbuk-do, an insured apple farmer was protected against hail damage (2.8ha of apple orchards) and could continue farming without difficulty.
Keywords: Crop, Insurance, Awareness, Field case
Introduction
Agriculture is an industry that relies on nature. Most of the produce depends on natural elements such as sunlight, water, air, and nutrients within soil to grow its roots, stems, and fruits for people. However, the effects of global warming are drastically changing the environments for arable lands. Low temperatures, droughts, typhoons, heavy snows, hails, and other negative conditions during the cultivation of crops often result in poor production or even a complete failure. In areas affected by natural disasters farmers report little to no income, while others in areas safe from harm benefit from sudden increase in price. As such, farms have difficulty in predicting and adjusting to changing environments and earn a stable income.
From 2001, South Korea, in efforts to stabilize farmers’ income, implemented crop natural disaster insurance. The first produces to come under the effect were apples and pears with 8,000 farms registered and insurance fund totaling at 79 million dollars. The policy was initially met with doubt and skepticism, but many farmers soon experienced two massive typhoons: typhoon Lu-sae in August of 2002 and typhoon Mae-mi in September of 2003. These two disasters proved to the farmers that the crop natural disaster insurance were vital to farmers life. Interests in the insurance service rose greatly and the government established funds to expand its policy.
In the years that followed, number of covered items increased as well as the overall coverage of the insurance. As of 2015, the insurance now covers 46 items, 122,000 registered farms, and total fund of 4.448 billion dollars. In that same year, application rate of some items were: apples 80.2%, pears 90.1%, sweet persimmons 32.7%, astringent persimmons 23.8%, and citrus 0.3%. The average application rate of these five fruits is 48.1% with 36,000 farms registered. The rates of other crops: rice 26.7%, house-facilities 10.8%, facilitated crops 4.9%, and etc. with average of 19.5% registered from 86,000 farms. Overall, 21.8% of applicable farms in South Korea are under the crop natural disaster insurance.
Many farms joined the crop natural disaster insurance in the past 15 years after it was enacted, but there are still sizable numbers that did not join. Since then, many problems were identified through trial and errors and efforts to reform plans and systems followed.
This report highlights the awareness of farmers about the insurance policy surveyed through questionnaires in 2013. Samples were collected from randomly selected participants of 590 farms under the coverage and 811 non-covered farms. In addition, we researched and analyzed various factors: frequent natural disasters occurring in residential areas and disaster prevention facilities; farmers’ need for crop natural disaster insurance and necessary education and presentations; reasons for joining; ways to efficiently distribute information; and current plans for improvement. Lastly, the examples of farms which suffered damage under coverage and continued farming with benefits are included.
Using these data, we present the plans for reform, taking account of farmers’ perception of the crop natural disaster insurance.
The realities of farmer consciousness on crop natural disaster insurance
1) General characteristics of the sample
The relationship between demographics of the participants and years of farming experience are analyzed. Out of 1,401 participants, 22.2% had the highest number with 31~40 years of experience, 21.0% with less than 10 years, followed by 11~20 years and 41~50 years. Comparing demographics with farming area, 28.7% had 1.1~2.0ha, less than 1ha (22.9%), above 5.1ha (16.4%), 3.1~4.0ha (13.4%). On disaster prevention facilities: rain protection (32.0%); no protection (24.6%); support structures (22.1%); heating and warming (12.4%); and windbreak nets (11.2%). Other facilities included were windbreak tree belt, micro-sprayers, anti-bird nets, artificial lighting, and protection frost fan. 40% of ages 30s to 40s owned rain protection facilities, and those that had no protection facilities were highest in age groups 20s and below and older than 50 with more than 20%. 37.5% of 20s and below responded to have rain protection and support structures. (Table 1)
%20Dr%20Chil-Koo%20Choi%20(Korea)-with%20Summary%20-%20E-T1(1).jpg)
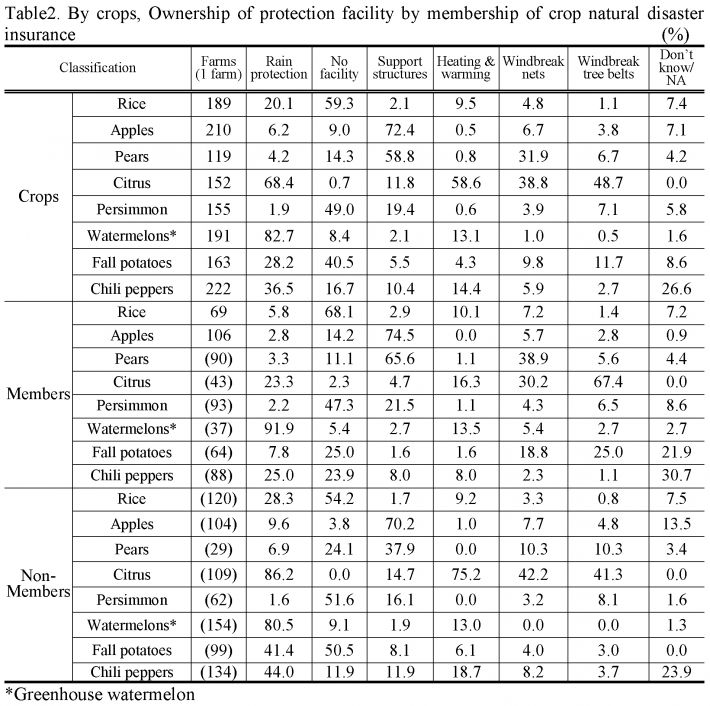
By crops, rice had the highest number of farmers having no protection facility (59.3%). Apples and pears had high numbers of support structures on site, with pears also having more windbreak nets. Citrus possessed most types of protection with rain protection (68.4%), heating and warming (58.6%), windbreak tree belt (48.7%), windbreak nets, and misc. Next, greenhouse watermelon recorded the absolute max of 82.7% farms reporting to own rain protection facility. Following the lack of facilities for rice, persimmons and potatoes grown in fall each reported higher than 40% with no protection. Chili peppers had high number of rain protection facility at 36.5%.
Then the ownership of protection facility was compared between members and non-members of crop natural disaster insurance. The ones insured had higher lack of facility at 68.1% than those that didn’t at 54.2%. This behavior can be attributed to farmers applying for insurance because they did not have protection of their crops. However, apples and pears both had high ownership of support structures regardless of membership. In the case of pears, it was more likely for them to have both the membership and protection. Citrus groves with membership had windbreak nets of 30.2% and windbreak tree belts of 67.4%, while non-members had concentrated their facilities on heating and warming facility (75.2%) and windbreak nets (42.2%). Persimmon commonly had response of “no protection facility” but it was higher for non-members. Over 80% of greenhouse watermelons possessed rain protection, with members having higher ownership at 91.9%. Non-member fall potatoes with no protection were 50.5% and member potatoes had as high as 8 times the facilities of windbreak tree belts than non-members. As for chili peppers, all farms favored rain protection. Non-members had more rain protection facility at 44.0% than members at 25.0%. (Table 2)
Farms that experienced natural disasters during harvest were investigated. From highest to lowest were: Typhoons (82.8%), localized heavy rains (41.3%), springtime frosts and freezes (33.3%), pest insects (30.4%), drought (27.4%), birds and mammals (24.1%). There were also disasters such as frosts and freezes in fall, hails, and fires. By age, 20s and below suffered most on typhoons (50.0%) while none suffered damages from birds and mammals and fires. For ages 50s and above, typhoons (83.0%) and localized heavy rain (39.7%) were the leading disasters. With the exception of hails and fires, damages from natural disasters tend to be higher as the age group gets older (Table 3).
The most frequent disasters are listed: pest insects and droughts have broad impact on all crops. As for typhoons, 90.8% of pears and 97.4% of citrus are affected, localized heavy rains, rice (54.5%) and chili peppers (61.3%), springtime frosts and freezes, apples (68.1%) and pears (57.1%), birds and mammals, apples (42.4%) and persimmons (64.5%), and finally hails, apples (48.6%) and pears (35.3%).
%20Dr%20Chil-Koo%20Choi%20(Korea)-with%20Summary%20-%20E-T3(1).jpg)
2) The Farmers awareness on crop natural disaster insurance
The necessity of crop natural disaster insurance when managing a farm was investigated. By age, most farmers that consider “Most important” for the insurance were 50s and up at 33.7%, and 40s at 32.7% next. From those that marked “Important”, 30s had the highest at 44.0%, followed by 40s and above 50. Sample size of 8 is minimal for age group 20s and below, but the group had highest response of “Somewhat important” at 37.5%, and “Not important” of 25%, which almost double of other age groups. Therefore a greater need for insurance can be seen in older age groups than younger ones. This becomes more apparent as age groups that consider the insurance “important” from highest to lowest are: 50s and above (72.2%); 40s (69.8%); 30s (64.0%); and 20s and below (37.5%). (Table 4)
By cultivated crops that needed the insurance most were greenhouse watermelons at 80.1% and pears at 77.3%. The least favorable response was at 66.4% for citrus growers. Conversely, crops that responded “Not important” for the insurance, watermelons had the lowest at 6.3%; and fall potatoes (14.1%) and citrus (14.5%) reporting higher negligence than others.
Comparing member and non-member response on necessity of the insurance, response of “Important” were 74.4% to 68.7% in favor of the members. For “Not important” it was 15.2% non-member to 10.4% member. In the end, the reason for low enrollment rate is the result of farmers’ low regard for the insurance.
%20Dr%20Chil-Koo%20Choi%20(Korea)-with%20Summary%20-%20E-T4(1).jpg)
Looking at the farmers interest in the insurance by years of experience, farmers with 21~30 years thought the insurance was important by 76.2% (not important 9.9%). For those with 41~50 years of experience, only 62.3% of the group thought the insurance was needed, lowest of all groups. However with over 51 years of experience, 9.1% thought the insurance did not help financial stability, and at the lowest, 18.2% said insurance was not important. The less reliance on the insurance with more years of experience can be attributed to insufficient promotion of the insurance and farmers’ ability to avoid natural disasters through farming experience.
By farming area, most that thought the insurance was important are farms with area of 4.1ha to 5.0ha at 76.9%. Those below 1ha recorded lowest at 67.0%. The highest reluctance to insurance came from areas above 5.1ha at 13.9% and 2.1~3.0ha farms reported lowest at 10.1%. For large-scale agriculture of 5.1+ha, many of them already had protection facilities or farmed crops that are less likely to be affected by natural disasters.
There also was a difference in response by farms’ income. Income of $51,458 ~ $85,749 group responded “Most important” at 40%, which was highest of the groups. For “Most important” and “Important”, income of $68,607 ~ $85,749 recorded 80.6%. However, group that earned $17,158 ~ $34,299 reported 13.9% of “not important”. And income above $85,749 had the highest percentage of 6.4% saying that the insurance did not help at all to financial stability.
3) The presentation of crop natural disaster insurance and need for education
The opinions of insurance related presentations and number of educational sessions were surveyed due to the recent introduction of the insurance to the public. 33.2% of the total said two sessions per year were enough, while once every year held 30.5% at the second. By age for 30s and up, response for semi-annual sessions was 30.7% (40s) at the least to max of 40.0% (30s). For age group 20s and below, one, three, and five sessions per year all had 25% each. 20s and 30s are minority compared to other age groups, but when age groups are divided into before and after 40 of younger and older generations, younger farmers tend to prefer three sessions and five sessions per year (Table 5).
%20Dr%20Chil-Koo%20Choi%20(Korea)-with%20Summary%20-%20E-T5(1).jpg)
By the crops, persimmon preferred yearly sessions at 35.5%, pears responded as needed at 22.7%, and rice recorded five sessions per year at 22.8%. The difference can be attributed to a crop’s characteristics and cultivation process that are more prone to natural disasters. There’s also different wants of education based on farming experience.
The need for numbers of education and presentations between members and non-members are compared. For members the order goes, yearly (34.4%) > semi-annually (30.1%), as needed (19.8%), and three per year. Order for non-members, semi-annually (34.9%), yearly (27.6%), five per year (19.4%) > as needed (10.9%), three per year (4.7%). It is apparent that non-members preferred more education.
As for farming experience, a group that preferred five sessions per year the most was farmers with experience of below 10 years at 20.7%. Experience of 31~40 years and 41~50 years marked “as needed” highly at 18.6% and 15.8% respectively. 15.2% of 51 years and longer experience said that there was no need for education, highest of any group. It is difficult to say that awareness of the insurance differs by years of experience due to relative recent introduction of the insurance on 2001. However, those with years of experience greater than 51 generally do not feel the need for education as they typically are not members of the insurance.
4) The major factors for expanding membership of crop natural disaster insurance
We asked what the major factors are for increasing the number of members of the insurance. The results were: burden of cost on self (23.8%); federal and local support (18.1%); expansion of insurance coverage (17.8%), level of insurance payout (17.4%). The insurance premium is still a big concern for farmers.
By age group, 20s and below rated similarly on cost of insurance, insurance payouts, and on site investigations. 30s thought burden of cost on self was most important at 40% and insurance payout next at 26.0%. 40s and 50s and above had smaller variations amongst choices, but both groups still stressed the burden of cost on self. On next factors, 40s listed insurance payouts (21.1%) and federal and local government support and insurance coverage both at 19.1%. 50s and above wanted federal and local government support at 18.4%, then insurance coverage and insurance payouts next (Table 6).
%20Dr%20Chil-Koo%20Choi%20(Korea)-with%20Summary%20-%20E-6(2).jpg)
* 1 burden of cost on self, 2 federal and local government support 3 extent of insurance coverage, 4 level of insurance payouts, 5 on site investigation, 6 education and publicity of the insurance, 7 don’t know/NA, 8 service of insurance company, 9 covered dates of insurance, 10 publication of outstanding examples, 11 Misc. and no opinion
By crops, apples rated equally at 20.5% for burden of cost on self, federal and local government support, and extent of insurance coverage. Pears rated burden of cost on self as top concern at 22.7% while fall potatoes rated extent of insurance coverage at 23.3%.
Next, the differences between members’ and non-members’ opinion of the major factors of the insurance were studied. Members reported federal and local government (23.2%), extent of insurance coverage (18.0%), and burden of cost on self. For non-members it was, burden of cost on self (26.3%0, insurance payout (20.8%), extent of insurance coverage (19.1%), and federal and local government (16.1%). There were distinct differences in priorities. So, members had great interest in federal and local government support while non-members thought burden of cost and insurance payout were most important for them. When explaining the insurance policy to non-members and newly joined, there needs to be appropriate tips. The fact that overall cost for an individual can be lowered with federal and local government support and proper explanation of the extent of insurance coverage will prevent misunderstandings about insurance payouts between involved parties. As for fall potato regardless of membership rated that extent of insurance coverage was a main concern.
5) Efficient ways to deliver information on crop natural disaster insurance
On the survey, the preferred methods for efficient ways to communicate about the insurance were: educational center for agricultural technology (32.9%); education from Nonghyup (31.5%); TV/radio ads (18.6%), brochures (5.4%), education from provincial/city/district government (3.6%); social media and internet (1.9%); newspaper/magazine ads (1.6%); banners (1.3%); and misc. There were no great differences amongst demographics of participants categorized into nine areas: gender; age group; crops; members; non-members; farming experience; farming areas; and income. 30s and 40s responded more favorably to 20s and below at 8.0%, 5.5%, and 1.9% respectively (Table 7).
%20Dr%20Chil-Koo%20Choi%20(Korea)-with%20Summary%20-%20E-7(1).jpg)
By crops, those that favored education from Nonghyup rather than educations from agricultural science centers were citrus (32.9%), persimmon (34.2%), and pears (47.9%) at the highest. Also for citrus and persimmon had high response in comparison to other crops at 3.9% and 3.2% respectively. As for members and non-members, there were distinct differences in opinions. For all crops on member farms, preferred educations from Nonghyp (46.1%) rather than educational centers for agricultural science (19.4%), and even TV and radio advertisement rated higher than the centers at 21.0%. Especially, members cultivating citrus and persimmons each said tv/radio advertisements were more efficient methods of communication at 37.2% and 22.6% respectively. On the contrary, non-member farms preferred educational center for agricultural science at 43.7% and education from Nonghyp at less than half of 20.5%. Next, TV/radio advertisements rated 16.4%. Non-member farms in general, thought that center for agricultural science were the most efficient ways to communicate about the insurance, and member farms that preferred Nonghyup and its education were due their membership on Nonghyp insurance policy.
6) Request for reforms on crop natural disaster insurance
As a whole, the participants responded on reforms: burden of cost on self (24.8%); insurance payouts (20.8%); federal and local government support (18.7%); and extent of insurance coverage (15.5%). On a closer look, there were different requirements for reform by age group. 20s and below unlike other age groups, wanted reforms on insurance coverage, service of insurance company both at 25.0%. Others rated burden of cost on self as number one priority and as a second, 30s wanted insurance coverage and 40s and above wanted reforms on insurance payouts (Table 8).
%20Dr%20Chil-Koo%20Choi%20(Korea)-with%20Summary%20-%20E-8(1).jpg)
pepper regardless of membership recorded that federal and local government should be reformed foremost. Therefore, chili peppers show similar response amongst themselves but not when compared to other crops. The farms that say there’s low support from the federal and local government should be further investigated to obtain precise response and feedbacks.
The examples of crop natural disaster insurance benefits on member farms
In this section, member farms that received benefits after suffering from natural disaster are shown. Mr. Kim, owner of 4.9ha of rice farm located in Sinan-gun, Jeollanam-do, entered the insurance in 2012. The aggregate amount insured was $24,534 and insurance premium totaled at $1,728. Out of this sum, federal paid $864, local $518, and the farm paid 20% of $346. On August 28th, 2012, Typhoon Bolaven struck the area and the farm suffered damages of $18,274. Out of this, Mr. Kim paid $4,907 and rest of $13,367 was paid by the insurance company. This farm was able to partially make up for the loss in costs of pesticide, fertilizer, and equipment through the insurance payout. The farm continued farming with sufficient funds.
Another instance of functional insurance policy came from 2.8ha apple orchard in Cheongsong-gun Gyeongsangbuk-do run by Mr. Kim. He joined the insurance in 2012 with aggregate amount insured at $20,845. Federal paid $6,036, local government $3,018, and the farm paid $3,018. On May 8th, severe hails in the region damaged the immature and small apples. The farm removed the damaged fruits and continued farming but number of apples per tree decreased. Inspection done before the harvest also showed that trees suffered significant damages. After calculations, the farm reported net loss of $175,387. As result, insurance payout of $133,698 was received after deducting other fees. Likewise, the farm continued farming as it could pay for lost wages, pesticides, and repair fees; and still secured enough funds from the insurance payout to hire workers, fertilizers and pesticides.
Lastly, Mr. Son who grows perilla on ten greenhouse facilities in Miryang-si, Gyeong Sangnam-do joined the insurance in 2011. Aggregate amount insured was $45,190, of which federal government paid $693, local government $346, and the farm paid 25% of the fee at $347. On July 9th, localized heavy rain swept the region from 9 AM to 11Am. As result, banks along the greenhouses collapsed. Rains, dirt and other debris entered the facilities. Covering materials in the ten greenhouses were bent and changed shapes; resulting in overall damage. Loss was calculated at $42,899, and with exception of $4,287 of self-burden fee, $38,612 of insurance payout was given, and farming continued.
Conclusion
In the report, 24.6% of all farms investigated did not have any kind of protection facilities. 20s and below and 50s and above possessed the least amount of protection facilities amongst the age groups. For ages 20s and below, it can be said that lack of farming experience prevented them from having adequate protection facilities, while 50s and above tend to grow rice. They have great experiences on farming and know-hows and knowledge of rice allows them to not rely on protection facilities.
On crop by cop comparison, rice, persimmon, and fall potatoes have higher percentage of not possessing protection facilities. Apples and pears have high ownership of support structures, while citrus tend to have rain protection, heating and warming, windbreak nets, and windbreak tree belts. Citrus growers tend not to opt for the insurance due to sufficient protection against natural disasters. As for the kinds of protection facility farmers own depended on individual crop characteristics. Less percentage of member farms owned protection facilities than non-members. This result can be seen as farmers’ effort to make up for the lack of protection facility with insurance coverage.
The natural disasters encountered during farming are typhoons, localized heavy rains, springtime freezes and frosts, insect pests, droughts, and birds and mammals, from highest frequency to lowest. Crops commonly damaged by disasters were: Typhoons on pears and citrus; localized heavy rains on rice and chili pepper; springtime freezes and frosts on apples and pears; birds and mammals on apples and persimmons; and hails on apples and pears. Therefore it is advised that protection facilities be built based on crops’ vulnerability to certain natural disasters. The farms with favorable views to the necessity of the insurance were 71.4% and unfavorable views were 11.7%. Majority of farms are aware of the benefits in joining. As such, as farmers age, have little years of experience farming, and/or own farm area of 4.1ha to 5.0ha, more farmers felt the need to be insured.
Appropriate numbers for presentation and educational sessions were around once to twice a year at 63.7%. Major factors for improving membership rate were burden of cost on self, federal and local government support, expansion of insurance coverage, and insurance payouts. Efficient ways to publicize about information were educational center for agriculture science, Nonghyup, and TV/radio ads. Member farms reported education from Nonghyup was more efficient and non-member preferred education from centers. As for reforms, fees responsible by the farmers on insurance, insurance payouts, and federal and local government support were requested by the farmers. There are numerous examples of farmers who are able to continue farming even after the events of natural disaster thanks to the coverage of crop natural disaster insurance. The farmers typically paid 20 to 25% of overall cost. These farms were able to minimize damage through insurance payouts, but there are still confusion and dissatisfaction over complex methods of calculations from some farmers.
REFERENCES
Choi, C.K., Kim, Y.H., Bae, H.H. and Lee, N.R.. 2014. Research on improvement subscription of crop casualty insurance. 16-107.
Choi, K.H.. 2012. The performance and mission of crop disaster insurance propel. KREI.
Choi, K.H, Chung, W.H. and Kim, W.T.. 2013. Analyzing Korean crop insurance loss adjustment system and its similar cases in other countries. 39-83.
Korea Association of Agricultural & Fishery Insurance Natural Disaster. 2016. Agricultural disaster insurance. Spring(9). 43-49
Lee, J.I, Kim, H.G, Wu, S.L, Shin, D.M. and Roh, S.H.. 2013. A case study on crop insurance in U.S. 128-134.
Ministry of Agriculture, Food and Rural Affairs. 2013. The case of agricultural disaster insurance pay in 2012 year. 10-25.
Submitted as a country paper for the FFTC-RDA International Seminar on
Implementing and Improving Crop Natural Disaster Insurance Program,
June 14-16, 2016, Jeonju, Korea |

Farmers Awareness on Crop Natural Disaster Insurance and Field Cases in Korea
ABSTRACT
The survey of 611 farmers was conducted to provide insights on Korea’s crop insurance. The types of major disasters that the respondents experienced consist of typhoons, heavy rainfall, pests and diseases, etc. They were informed of crop insurance through various sources, such as education, television and radio, newspaper/magazines, neighbors, promotional brochures, banners, and the internet. The reasons for not purchasing insurance include high farmers payed insurance premium(14%), insufficient damage assessment systems (13%), limited coverage plans (13%), small insurance money (12%), lack of publicity, dissatisfaction with company services, and insignificant government subsidies. Farmers who had previously purchased crop insurance had a high repurchase rate (86%) while 74% of the groups who had never been insured expressed interests in buying coverage. One example of crop insurance is as follows: In Cheongsong-gun Gyeongsangbuk-do, an insured apple farmer was protected against hail damage (2.8ha of apple orchards) and could continue farming without difficulty.
Keywords: Crop, Insurance, Awareness, Field case
Introduction
Agriculture is an industry that relies on nature. Most of the produce depends on natural elements such as sunlight, water, air, and nutrients within soil to grow its roots, stems, and fruits for people. However, the effects of global warming are drastically changing the environments for arable lands. Low temperatures, droughts, typhoons, heavy snows, hails, and other negative conditions during the cultivation of crops often result in poor production or even a complete failure. In areas affected by natural disasters farmers report little to no income, while others in areas safe from harm benefit from sudden increase in price. As such, farms have difficulty in predicting and adjusting to changing environments and earn a stable income.
From 2001, South Korea, in efforts to stabilize farmers’ income, implemented crop natural disaster insurance. The first produces to come under the effect were apples and pears with 8,000 farms registered and insurance fund totaling at 79 million dollars. The policy was initially met with doubt and skepticism, but many farmers soon experienced two massive typhoons: typhoon Lu-sae in August of 2002 and typhoon Mae-mi in September of 2003. These two disasters proved to the farmers that the crop natural disaster insurance were vital to farmers life. Interests in the insurance service rose greatly and the government established funds to expand its policy.
In the years that followed, number of covered items increased as well as the overall coverage of the insurance. As of 2015, the insurance now covers 46 items, 122,000 registered farms, and total fund of 4.448 billion dollars. In that same year, application rate of some items were: apples 80.2%, pears 90.1%, sweet persimmons 32.7%, astringent persimmons 23.8%, and citrus 0.3%. The average application rate of these five fruits is 48.1% with 36,000 farms registered. The rates of other crops: rice 26.7%, house-facilities 10.8%, facilitated crops 4.9%, and etc. with average of 19.5% registered from 86,000 farms. Overall, 21.8% of applicable farms in South Korea are under the crop natural disaster insurance.
Many farms joined the crop natural disaster insurance in the past 15 years after it was enacted, but there are still sizable numbers that did not join. Since then, many problems were identified through trial and errors and efforts to reform plans and systems followed.
This report highlights the awareness of farmers about the insurance policy surveyed through questionnaires in 2013. Samples were collected from randomly selected participants of 590 farms under the coverage and 811 non-covered farms. In addition, we researched and analyzed various factors: frequent natural disasters occurring in residential areas and disaster prevention facilities; farmers’ need for crop natural disaster insurance and necessary education and presentations; reasons for joining; ways to efficiently distribute information; and current plans for improvement. Lastly, the examples of farms which suffered damage under coverage and continued farming with benefits are included.
Using these data, we present the plans for reform, taking account of farmers’ perception of the crop natural disaster insurance.
The realities of farmer consciousness on crop natural disaster insurance
1) General characteristics of the sample
The relationship between demographics of the participants and years of farming experience are analyzed. Out of 1,401 participants, 22.2% had the highest number with 31~40 years of experience, 21.0% with less than 10 years, followed by 11~20 years and 41~50 years. Comparing demographics with farming area, 28.7% had 1.1~2.0ha, less than 1ha (22.9%), above 5.1ha (16.4%), 3.1~4.0ha (13.4%). On disaster prevention facilities: rain protection (32.0%); no protection (24.6%); support structures (22.1%); heating and warming (12.4%); and windbreak nets (11.2%). Other facilities included were windbreak tree belt, micro-sprayers, anti-bird nets, artificial lighting, and protection frost fan. 40% of ages 30s to 40s owned rain protection facilities, and those that had no protection facilities were highest in age groups 20s and below and older than 50 with more than 20%. 37.5% of 20s and below responded to have rain protection and support structures. (Table 1)
By crops, rice had the highest number of farmers having no protection facility (59.3%). Apples and pears had high numbers of support structures on site, with pears also having more windbreak nets. Citrus possessed most types of protection with rain protection (68.4%), heating and warming (58.6%), windbreak tree belt (48.7%), windbreak nets, and misc. Next, greenhouse watermelon recorded the absolute max of 82.7% farms reporting to own rain protection facility. Following the lack of facilities for rice, persimmons and potatoes grown in fall each reported higher than 40% with no protection. Chili peppers had high number of rain protection facility at 36.5%.
Then the ownership of protection facility was compared between members and non-members of crop natural disaster insurance. The ones insured had higher lack of facility at 68.1% than those that didn’t at 54.2%. This behavior can be attributed to farmers applying for insurance because they did not have protection of their crops. However, apples and pears both had high ownership of support structures regardless of membership. In the case of pears, it was more likely for them to have both the membership and protection. Citrus groves with membership had windbreak nets of 30.2% and windbreak tree belts of 67.4%, while non-members had concentrated their facilities on heating and warming facility (75.2%) and windbreak nets (42.2%). Persimmon commonly had response of “no protection facility” but it was higher for non-members. Over 80% of greenhouse watermelons possessed rain protection, with members having higher ownership at 91.9%. Non-member fall potatoes with no protection were 50.5% and member potatoes had as high as 8 times the facilities of windbreak tree belts than non-members. As for chili peppers, all farms favored rain protection. Non-members had more rain protection facility at 44.0% than members at 25.0%. (Table 2)
Farms that experienced natural disasters during harvest were investigated. From highest to lowest were: Typhoons (82.8%), localized heavy rains (41.3%), springtime frosts and freezes (33.3%), pest insects (30.4%), drought (27.4%), birds and mammals (24.1%). There were also disasters such as frosts and freezes in fall, hails, and fires. By age, 20s and below suffered most on typhoons (50.0%) while none suffered damages from birds and mammals and fires. For ages 50s and above, typhoons (83.0%) and localized heavy rain (39.7%) were the leading disasters. With the exception of hails and fires, damages from natural disasters tend to be higher as the age group gets older (Table 3).
The most frequent disasters are listed: pest insects and droughts have broad impact on all crops. As for typhoons, 90.8% of pears and 97.4% of citrus are affected, localized heavy rains, rice (54.5%) and chili peppers (61.3%), springtime frosts and freezes, apples (68.1%) and pears (57.1%), birds and mammals, apples (42.4%) and persimmons (64.5%), and finally hails, apples (48.6%) and pears (35.3%).
2) The Farmers awareness on crop natural disaster insurance
The necessity of crop natural disaster insurance when managing a farm was investigated. By age, most farmers that consider “Most important” for the insurance were 50s and up at 33.7%, and 40s at 32.7% next. From those that marked “Important”, 30s had the highest at 44.0%, followed by 40s and above 50. Sample size of 8 is minimal for age group 20s and below, but the group had highest response of “Somewhat important” at 37.5%, and “Not important” of 25%, which almost double of other age groups. Therefore a greater need for insurance can be seen in older age groups than younger ones. This becomes more apparent as age groups that consider the insurance “important” from highest to lowest are: 50s and above (72.2%); 40s (69.8%); 30s (64.0%); and 20s and below (37.5%). (Table 4)
By cultivated crops that needed the insurance most were greenhouse watermelons at 80.1% and pears at 77.3%. The least favorable response was at 66.4% for citrus growers. Conversely, crops that responded “Not important” for the insurance, watermelons had the lowest at 6.3%; and fall potatoes (14.1%) and citrus (14.5%) reporting higher negligence than others.
Comparing member and non-member response on necessity of the insurance, response of “Important” were 74.4% to 68.7% in favor of the members. For “Not important” it was 15.2% non-member to 10.4% member. In the end, the reason for low enrollment rate is the result of farmers’ low regard for the insurance.
Looking at the farmers interest in the insurance by years of experience, farmers with 21~30 years thought the insurance was important by 76.2% (not important 9.9%). For those with 41~50 years of experience, only 62.3% of the group thought the insurance was needed, lowest of all groups. However with over 51 years of experience, 9.1% thought the insurance did not help financial stability, and at the lowest, 18.2% said insurance was not important. The less reliance on the insurance with more years of experience can be attributed to insufficient promotion of the insurance and farmers’ ability to avoid natural disasters through farming experience.
By farming area, most that thought the insurance was important are farms with area of 4.1ha to 5.0ha at 76.9%. Those below 1ha recorded lowest at 67.0%. The highest reluctance to insurance came from areas above 5.1ha at 13.9% and 2.1~3.0ha farms reported lowest at 10.1%. For large-scale agriculture of 5.1+ha, many of them already had protection facilities or farmed crops that are less likely to be affected by natural disasters.
There also was a difference in response by farms’ income. Income of $51,458 ~ $85,749 group responded “Most important” at 40%, which was highest of the groups. For “Most important” and “Important”, income of $68,607 ~ $85,749 recorded 80.6%. However, group that earned $17,158 ~ $34,299 reported 13.9% of “not important”. And income above $85,749 had the highest percentage of 6.4% saying that the insurance did not help at all to financial stability.
3) The presentation of crop natural disaster insurance and need for education
The opinions of insurance related presentations and number of educational sessions were surveyed due to the recent introduction of the insurance to the public. 33.2% of the total said two sessions per year were enough, while once every year held 30.5% at the second. By age for 30s and up, response for semi-annual sessions was 30.7% (40s) at the least to max of 40.0% (30s). For age group 20s and below, one, three, and five sessions per year all had 25% each. 20s and 30s are minority compared to other age groups, but when age groups are divided into before and after 40 of younger and older generations, younger farmers tend to prefer three sessions and five sessions per year (Table 5).
By the crops, persimmon preferred yearly sessions at 35.5%, pears responded as needed at 22.7%, and rice recorded five sessions per year at 22.8%. The difference can be attributed to a crop’s characteristics and cultivation process that are more prone to natural disasters. There’s also different wants of education based on farming experience.
The need for numbers of education and presentations between members and non-members are compared. For members the order goes, yearly (34.4%) > semi-annually (30.1%), as needed (19.8%), and three per year. Order for non-members, semi-annually (34.9%), yearly (27.6%), five per year (19.4%) > as needed (10.9%), three per year (4.7%). It is apparent that non-members preferred more education.
As for farming experience, a group that preferred five sessions per year the most was farmers with experience of below 10 years at 20.7%. Experience of 31~40 years and 41~50 years marked “as needed” highly at 18.6% and 15.8% respectively. 15.2% of 51 years and longer experience said that there was no need for education, highest of any group. It is difficult to say that awareness of the insurance differs by years of experience due to relative recent introduction of the insurance on 2001. However, those with years of experience greater than 51 generally do not feel the need for education as they typically are not members of the insurance.
4) The major factors for expanding membership of crop natural disaster insurance
We asked what the major factors are for increasing the number of members of the insurance. The results were: burden of cost on self (23.8%); federal and local support (18.1%); expansion of insurance coverage (17.8%), level of insurance payout (17.4%). The insurance premium is still a big concern for farmers.
By age group, 20s and below rated similarly on cost of insurance, insurance payouts, and on site investigations. 30s thought burden of cost on self was most important at 40% and insurance payout next at 26.0%. 40s and 50s and above had smaller variations amongst choices, but both groups still stressed the burden of cost on self. On next factors, 40s listed insurance payouts (21.1%) and federal and local government support and insurance coverage both at 19.1%. 50s and above wanted federal and local government support at 18.4%, then insurance coverage and insurance payouts next (Table 6).
* 1 burden of cost on self, 2 federal and local government support 3 extent of insurance coverage, 4 level of insurance payouts, 5 on site investigation, 6 education and publicity of the insurance, 7 don’t know/NA, 8 service of insurance company, 9 covered dates of insurance, 10 publication of outstanding examples, 11 Misc. and no opinion
By crops, apples rated equally at 20.5% for burden of cost on self, federal and local government support, and extent of insurance coverage. Pears rated burden of cost on self as top concern at 22.7% while fall potatoes rated extent of insurance coverage at 23.3%.
Next, the differences between members’ and non-members’ opinion of the major factors of the insurance were studied. Members reported federal and local government (23.2%), extent of insurance coverage (18.0%), and burden of cost on self. For non-members it was, burden of cost on self (26.3%0, insurance payout (20.8%), extent of insurance coverage (19.1%), and federal and local government (16.1%). There were distinct differences in priorities. So, members had great interest in federal and local government support while non-members thought burden of cost and insurance payout were most important for them. When explaining the insurance policy to non-members and newly joined, there needs to be appropriate tips. The fact that overall cost for an individual can be lowered with federal and local government support and proper explanation of the extent of insurance coverage will prevent misunderstandings about insurance payouts between involved parties. As for fall potato regardless of membership rated that extent of insurance coverage was a main concern.
5) Efficient ways to deliver information on crop natural disaster insurance
On the survey, the preferred methods for efficient ways to communicate about the insurance were: educational center for agricultural technology (32.9%); education from Nonghyup (31.5%); TV/radio ads (18.6%), brochures (5.4%), education from provincial/city/district government (3.6%); social media and internet (1.9%); newspaper/magazine ads (1.6%); banners (1.3%); and misc. There were no great differences amongst demographics of participants categorized into nine areas: gender; age group; crops; members; non-members; farming experience; farming areas; and income. 30s and 40s responded more favorably to 20s and below at 8.0%, 5.5%, and 1.9% respectively (Table 7).
By crops, those that favored education from Nonghyup rather than educations from agricultural science centers were citrus (32.9%), persimmon (34.2%), and pears (47.9%) at the highest. Also for citrus and persimmon had high response in comparison to other crops at 3.9% and 3.2% respectively. As for members and non-members, there were distinct differences in opinions. For all crops on member farms, preferred educations from Nonghyp (46.1%) rather than educational centers for agricultural science (19.4%), and even TV and radio advertisement rated higher than the centers at 21.0%. Especially, members cultivating citrus and persimmons each said tv/radio advertisements were more efficient methods of communication at 37.2% and 22.6% respectively. On the contrary, non-member farms preferred educational center for agricultural science at 43.7% and education from Nonghyp at less than half of 20.5%. Next, TV/radio advertisements rated 16.4%. Non-member farms in general, thought that center for agricultural science were the most efficient ways to communicate about the insurance, and member farms that preferred Nonghyup and its education were due their membership on Nonghyp insurance policy.
6) Request for reforms on crop natural disaster insurance
As a whole, the participants responded on reforms: burden of cost on self (24.8%); insurance payouts (20.8%); federal and local government support (18.7%); and extent of insurance coverage (15.5%). On a closer look, there were different requirements for reform by age group. 20s and below unlike other age groups, wanted reforms on insurance coverage, service of insurance company both at 25.0%. Others rated burden of cost on self as number one priority and as a second, 30s wanted insurance coverage and 40s and above wanted reforms on insurance payouts (Table 8).
pepper regardless of membership recorded that federal and local government should be reformed foremost. Therefore, chili peppers show similar response amongst themselves but not when compared to other crops. The farms that say there’s low support from the federal and local government should be further investigated to obtain precise response and feedbacks.
The examples of crop natural disaster insurance benefits on member farms
In this section, member farms that received benefits after suffering from natural disaster are shown. Mr. Kim, owner of 4.9ha of rice farm located in Sinan-gun, Jeollanam-do, entered the insurance in 2012. The aggregate amount insured was $24,534 and insurance premium totaled at $1,728. Out of this sum, federal paid $864, local $518, and the farm paid 20% of $346. On August 28th, 2012, Typhoon Bolaven struck the area and the farm suffered damages of $18,274. Out of this, Mr. Kim paid $4,907 and rest of $13,367 was paid by the insurance company. This farm was able to partially make up for the loss in costs of pesticide, fertilizer, and equipment through the insurance payout. The farm continued farming with sufficient funds.
Another instance of functional insurance policy came from 2.8ha apple orchard in Cheongsong-gun Gyeongsangbuk-do run by Mr. Kim. He joined the insurance in 2012 with aggregate amount insured at $20,845. Federal paid $6,036, local government $3,018, and the farm paid $3,018. On May 8th, severe hails in the region damaged the immature and small apples. The farm removed the damaged fruits and continued farming but number of apples per tree decreased. Inspection done before the harvest also showed that trees suffered significant damages. After calculations, the farm reported net loss of $175,387. As result, insurance payout of $133,698 was received after deducting other fees. Likewise, the farm continued farming as it could pay for lost wages, pesticides, and repair fees; and still secured enough funds from the insurance payout to hire workers, fertilizers and pesticides.
Lastly, Mr. Son who grows perilla on ten greenhouse facilities in Miryang-si, Gyeong Sangnam-do joined the insurance in 2011. Aggregate amount insured was $45,190, of which federal government paid $693, local government $346, and the farm paid 25% of the fee at $347. On July 9th, localized heavy rain swept the region from 9 AM to 11Am. As result, banks along the greenhouses collapsed. Rains, dirt and other debris entered the facilities. Covering materials in the ten greenhouses were bent and changed shapes; resulting in overall damage. Loss was calculated at $42,899, and with exception of $4,287 of self-burden fee, $38,612 of insurance payout was given, and farming continued.
Conclusion
In the report, 24.6% of all farms investigated did not have any kind of protection facilities. 20s and below and 50s and above possessed the least amount of protection facilities amongst the age groups. For ages 20s and below, it can be said that lack of farming experience prevented them from having adequate protection facilities, while 50s and above tend to grow rice. They have great experiences on farming and know-hows and knowledge of rice allows them to not rely on protection facilities.
On crop by cop comparison, rice, persimmon, and fall potatoes have higher percentage of not possessing protection facilities. Apples and pears have high ownership of support structures, while citrus tend to have rain protection, heating and warming, windbreak nets, and windbreak tree belts. Citrus growers tend not to opt for the insurance due to sufficient protection against natural disasters. As for the kinds of protection facility farmers own depended on individual crop characteristics. Less percentage of member farms owned protection facilities than non-members. This result can be seen as farmers’ effort to make up for the lack of protection facility with insurance coverage.
The natural disasters encountered during farming are typhoons, localized heavy rains, springtime freezes and frosts, insect pests, droughts, and birds and mammals, from highest frequency to lowest. Crops commonly damaged by disasters were: Typhoons on pears and citrus; localized heavy rains on rice and chili pepper; springtime freezes and frosts on apples and pears; birds and mammals on apples and persimmons; and hails on apples and pears. Therefore it is advised that protection facilities be built based on crops’ vulnerability to certain natural disasters. The farms with favorable views to the necessity of the insurance were 71.4% and unfavorable views were 11.7%. Majority of farms are aware of the benefits in joining. As such, as farmers age, have little years of experience farming, and/or own farm area of 4.1ha to 5.0ha, more farmers felt the need to be insured.
Appropriate numbers for presentation and educational sessions were around once to twice a year at 63.7%. Major factors for improving membership rate were burden of cost on self, federal and local government support, expansion of insurance coverage, and insurance payouts. Efficient ways to publicize about information were educational center for agriculture science, Nonghyup, and TV/radio ads. Member farms reported education from Nonghyup was more efficient and non-member preferred education from centers. As for reforms, fees responsible by the farmers on insurance, insurance payouts, and federal and local government support were requested by the farmers. There are numerous examples of farmers who are able to continue farming even after the events of natural disaster thanks to the coverage of crop natural disaster insurance. The farmers typically paid 20 to 25% of overall cost. These farms were able to minimize damage through insurance payouts, but there are still confusion and dissatisfaction over complex methods of calculations from some farmers.
REFERENCES
Choi, C.K., Kim, Y.H., Bae, H.H. and Lee, N.R.. 2014. Research on improvement subscription of crop casualty insurance. 16-107.
Choi, K.H.. 2012. The performance and mission of crop disaster insurance propel. KREI.
Choi, K.H, Chung, W.H. and Kim, W.T.. 2013. Analyzing Korean crop insurance loss adjustment system and its similar cases in other countries. 39-83.
Korea Association of Agricultural & Fishery Insurance Natural Disaster. 2016. Agricultural disaster insurance. Spring(9). 43-49
Lee, J.I, Kim, H.G, Wu, S.L, Shin, D.M. and Roh, S.H.. 2013. A case study on crop insurance in U.S. 128-134.
Ministry of Agriculture, Food and Rural Affairs. 2013. The case of agricultural disaster insurance pay in 2012 year. 10-25.
Implementing and Improving Crop Natural Disaster Insurance Program,
June 14-16, 2016, Jeonju, Korea