ABSTRACT
This report provides a comprehensive analysis of the development and operational performance of South Korea’s agricultural insurance system, focusing on the Crop Disaster Insurance (CDI) program since its inception in 2001 and the more recent Agricultural Revenue Insurance pilot scheme. Over the past 25 years, Korea has established a robust national safety net, achieving a 135-fold increase in insured area and expanding coverage to 76 crops as of 2025. The success of the program is rooted in a unique public-private partnership model, in which the government provides substantial premium subsidies—reducing the farmer's actual burden to approximately 15.1%—and acts as the final guarantor through a national reinsurance scheme. While the program has matured significantly, it faces ongoing challenges, including high volatility in loss ratios in certain regions and the need for more sophisticated risk management tools. Looking ahead, the report outlines short-term goals, such as expanding revenue insurance—highlighted by a dramatic budget surge to USD 141.4 million in 2025—and medium- to long-term strategies involving the integration of ICT technologies (drones, satellites, and yield-monitoring sensors) and structural reforms to strengthen product planning. These experiences offer valuable institutional and fiscal blueprints for other Asian countries seeking to enhance farm management stability amid rising climate and market volatility.
Keywords: Agricultural Disaster Insurance (ADI), Revenue Insurance, Loss Ratio & Volatility, Farmer Premium Subsidy, Republic of Korea
INTRODUCTION
The primary objective of this report is to provide a comprehensive overview of the Crop Disaster Insurance (CDI) program in South Korea, which has served as a cornerstone of the national agricultural safety net for over two decades. While the analysis focuses extensively on the development and operational performance of the CDI program, it also briefly introduces the Agricultural Revenue Insurance scheme, a relatively recent policy instrument designed to mitigate price volatility.
The necessity of this review stems from the increasing frequency of extreme weather events and market instability, which pose significant threats to farm management and food security. Since its inception in 2001, the Korean agricultural insurance model has evolved through a unique public-private partnership, overcoming structural limitations to achieve substantial quantitative and qualitative growth.
By examining the South Korean experience—including its institutional design, budget allocation, and challenges such as loss-ratio volatility—this report aims to provide valuable insights and a practical reference for Asian countries seeking to establish or refine their agricultural policy frameworks. We believe that these lessons in risk management and policy linkage will contribute to the sustainable development of agriculture across the region.
OVERVIEW OF CROP DISASTER INSURANCE PROGRAM
Development and expansion of the crop disaster insurance program
Natural disasters in agriculture often cause damage simultaneously across multiple regions, making risk diversification exceptionally difficult for insurers. As a result, private insurance companies face inherent structural limitations in independently underwriting crop disaster insurance, making it challenging to operate such schemes as standard commercial products without intervention.
Accordingly, from the late 1970s to the early 1990s, the Korean government repeatedly examined the feasibility of introducing a public-private partnership model for crop disaster insurance. However, these early reviews consistently concluded that the expected policy effectiveness would be limited relative to the substantial fiscal expenditures required. Consequently, the program's official introduction was not pursued during that period.
The turning point came in 1999 following Typhoon Olga, which caused catastrophic damage to the agricultural sector and exposed the clear limitations of the existing disaster relief system. In response, the government reconsidered the insurance model, and after approximately two years of intensive institutional design, a policy-based insurance scheme was officially launched in 2001. The program’s primary objective was to stabilize farm income and management, initially covering only two crops: apples and pears.
The core mission of agricultural disaster insurance—encompassing both crop disaster and revenue insurance—is to promote farm management stability by providing compensation for crop losses caused by unpredictable natural disasters. In the medium to long term, the program aims to establish a joint risk management framework between farmers and the government. This encourages farmers to move beyond passive reliance on aid, fostering a culture of active, autonomous risk management within the agricultural sector.
In the early stages of implementation, several operational challenges emerged. Limited institutional experience, unstable loss ratios across the newly insured crops, and a sharp increase in payouts due to massive disasters such as Typhoons Rusa and Maemi placed a significant operational burden on the primary insurer, NongHyup Property & Casualty Insurance Co.,Ltd. Consequently, in 2005, the government introduced a national reinsurance scheme based on a stop-loss design. Under this framework, the government compensates for losses exceeding a certain threshold, a measure that significantly reduced the burden on private insurers and served as a crucial turning point in the program's expansion and stabilization.
Since this stabilization, the program has seen a rapid expansion in the number of covered crops and eligible regions. Following the initial focus on major fruits such as peaches, grapes, and citrus in the early 2000s, the program expanded to field crops (chili peppers, soybeans, onions) in 2008 and to staples such as rice in 2009. Throughout the 2010s, a wide variety of greenhouse crops (strawberries, cucumbers, tomatoes), specialty crops (ginseng, tea), and forest products (walnuts, jujubes) were integrated into the pilot and nationwide programs.
Recent years have seen the inclusion of diverse vegetables and grains to create a more inclusive safety net:
- 2019-2020: Inclusion of carrots, apricots, adzuki beans, barley, and spinach.
- 2023-2024: Expansion to include squash, adlay (Job's tears), blueberries, and watermelons.
- 2025: The program reached a significant milestone, now covering 76 crops with the latest additions of mung beans, ginger, and sesame.
This continuous growth ensures that the vast majority of Korea's agricultural produce is protected, contributing significantly to the stability of farm management nationwide.
Table 1. Development of the crop disaster insurance program
|
Year
|
Major Developments
|
|
2001
|
Enactment of the Crop Disaster Insurance Act and its Enforcement Decree; pilot programs for apples and pears
|
|
2002
|
Pilot programs for peaches, grapes, sweet persimmons, and citrus
|
|
2003
|
Nationwide implementation for apples and pears
|
|
2004
|
Nationwide implementation for peaches, grapes, sweet persimmons, and citrus
|
|
2005
|
Revision of the Crop Disaster Insurance Act (introduction of national reinsurance and fund establishment); establishment of the Crop Disaster Insurance Fund
|
|
2008
|
Full implementation for sweet persimmons; pilot programs for chili peppers, soybeans, potatoes, onions, and watermelons
|
|
2009
|
Revision of the Agricultural Disaster Insurance Act; pilot programs for rice, barley, corn, sweet potatoes, garlic, and plums
|
|
2010
|
Enforcement of the Agricultural Disaster Insurance Act (integration of crops, livestock, and aquaculture); pilot programs for jujubes, greenhouse strawberries, greenhouse cucumbers, greenhouse tomatoes, greenhouse paprika, and agricultural facilities
|
|
2011
|
Pilot programs for Bokbunja (Korean black raspberry), red chili peppers, pumpkins, greenhouse chrysanthemums, and greenhouse roses
|
|
2012
|
Pilot programs for ginseng, greenhouse melons, greenhouse paprika, ducks, and green tea
|
|
2013
|
Pilot programs for greenhouse crops (lettuce, spinach, Chinese cabbage, oyster mushrooms, shiitake mushrooms); pilot program for comprehensive coverage for pears
|
|
2014
|
Pilot programs for greenhouse crops (Chinese cabbage, eggplant, green onions); pilot program for comprehensive coverage for sweet persimmons
|
|
2015
|
Pilot programs for greenhouse crops (radish, lilies, carnations); pilot program for comprehensive coverage for apples
|
|
2016
|
Pilot programs for greenhouse water dropwort, wheat, napa cabbage, and schizandra; pilot program for comprehensive coverage for sweet persimmons
|
|
2017
|
Pilot programs for greenhouse peppers, figs, and yuja (citron); full implementation of comprehensive coverage for pears and sweet persimmons
|
|
2018
|
Pilot programs for buckwheat, broccoli, king oyster mushrooms, and enoki mushrooms
|
|
2019
|
Pilot programs for Chinese cabbage, radish, pumpkin, carrots, and green onions
|
|
2020
|
Pilot programs for walnuts, adzuki beans, spinach, barley, and apricots
|
|
2023
|
Pilot programs for squash, carrots, and green onions (including large green onions)
|
|
2024
|
Pilot programs for adlay (Job’s tears), blueberries, and watermelons
|
|
2025
|
Pilot programs for mung beans, ginger, and sesame
|
Source: Ministry of Agriculture, Food and Rural Affairs. 2025.
Eligibility and support structure
The accessibility and financial feasibility of the crop disaster insurance program are underpinned by a structured eligibility framework and a multi-layered premium support system designed to minimize the financial burden on individual farm households.
Eligibility for the program is strictly defined to ensure that the insurance functions as a professional management tool. Participation is limited to individual farmers and agricultural corporations that own or cultivate farmland. A critical prerequisite for enrollment is meeting the minimum insured area requirements, which vary by crop to reflect different cultivation standards and risk profiles. This ensures that the insured plots are at a viable commercial scale, enabling more accurate disaster loss assessment and actuarial management.
To cater to farmers' varying risk appetites and financial capacities, the program offers a wide range of coverage levels. While specific coverage terms may vary by crop, most insurance products offer multiple coverage levels, typically including 60%, 70%, 80%, 85%, and 90%. This flexibility allows farmers to choose between lower-premium options with basic protection or higher-coverage levels that offer more robust income security against catastrophic events.
The most significant driver of high participation rates is the comprehensive subsidy structure provided by both central and local authorities.
- Central government support: The national government provides a foundational subsidy, covering 50% of the net insurance premium paid by farmers.
- Local government support: To further encourage enrollment, local governments provide supplementary subsidies that can reach up to approximately 30% of the premium.
- Additional cooperative support: In many regions, local agricultural and livestock cooperatives provide further financial assistance to their members, effectively acting as a third layer of support.
As a result of this robust support framework, farmers' actual out-of-pocket expenses are remarkably low. On average, after accounting for central and local government subsidies, farmers are officially responsible for only about 15.1% of the pure premiums. When the additional contributions from local cooperatives are factored in, the real premium burden borne by farmers is often even lower, making the insurance a highly cost-effective risk management strategy for most agricultural households.
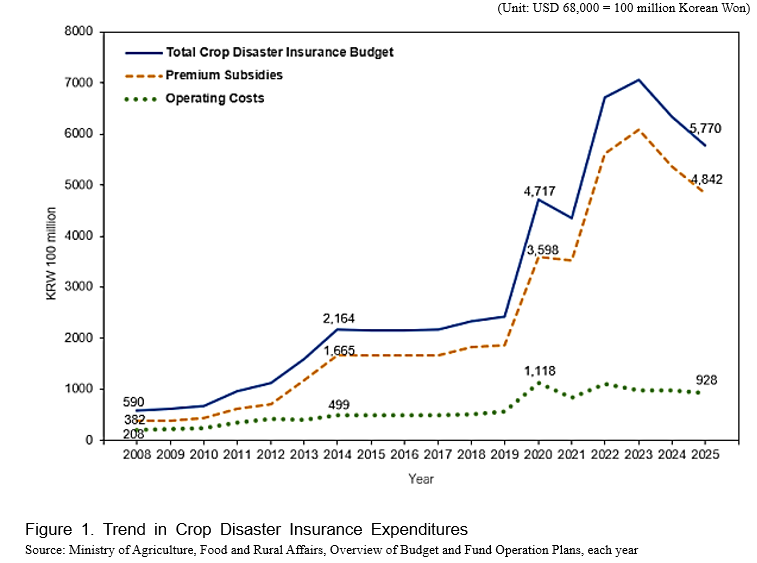
Budget and insured crops
The financial scale of the crop disaster insurance program has undergone a remarkable transformation, reflecting the government's growing commitment to agricultural stability. According to budgetary data, total expenditure for crop disaster insurance exceeded USD 68 million for the first time in 2012 and has continued to rise since. This growth became particularly explosive after 2019, with the total budget reaching a record high of USD 296.3 million in 2021, encompassing both premium subsidies and essential operational cost support.
A detailed analysis of the expenditure components reveals several critical trends:
- Premium subsidy growth: As the primary driver of the budget, premium subsidies saw a dramatic surge in a single year, increasing from USD 126.5 million in 2019 to USD 244.8 million in 2020. This increase of approximately USD 136.1 million highlights the rapid expansion of insurance enrollment and the government’s intensified support for farmers.
- Operational cost support: Reflecting the increasing complexity of managing the program, operational cost support also hit a milestone by exceeding USD 68 million for the first time in 2020.
- Budgetary resilience: Even after the sharp peaks in 2020, the total budget in 2021 remained significantly elevated compared to pre-2019 levels, demonstrating that the program has shifted to a new, higher baseline of fiscal support.
Since its inception in 2001, with a narrow focus on apples and pears, the crop disaster insurance program has undergone a steady, strategic expansion to encompass nearly every sector of Korean agriculture. A significant milestone in this growth occurred in 2020, when five additional crops—apricots (fruit), adzuki beans and barley (food crops), spinach (vegetables), and walnuts (forest products)—were introduced on a pilot basis. This brought the total number of protected crops to 67 by the end of 2020, marking a transition toward a more comprehensive national safety net.
As of 2025, the program has reached a high level of maturity, covering a total of 76 crops categorized into diverse agricultural groups:
- Fruit and food crops: The program provides robust coverage for 13 fruit crops, including citrus, grapes, peaches, and plums, as well as 11 food crops such as rice, soybeans, wheat, and mung beans.
- Vegetables and specialty crops: Coverage for vegetables has expanded to 14 items, protecting staples like onions, garlic, Chinese cabbage, radish, and ginger. Additionally, 4 specialty crops—tea, mulberry, ginseng, and sesame—are now eligible for insurance.
- Forestry and horticulture: The program covers 8 forest products, including chestnuts, jujubes, and walnuts. For the horticulture sector, 23 greenhouse crops (e.g., strawberries, tomatoes, paprika) and 3 types of mushrooms (oyster, king oyster, and enoki) are protected.
- Agricultural facilities: Beyond the crops themselves, the program ensures the stability of production environments by ensuring agricultural facilities, including single-span greenhouses, multi-span greenhouses, and sophisticated glasshouses.
This evolution from a fruit-centric pilot to a multi-sectoral framework demonstrates the program's adaptability to the diverse risks faced by modern farming households, ensuring that specialty and greenhouse cultivation are as protected as traditional open-field staples.
Table 2. Crops covered by the crop disaster insurance program (as of 2025)
|
Category
|
Covered Crops
|
|
Fruit Crops (13)
|
Apples, Pears, Sweet Persimmons, Astringent Persimmons, Citrus, Grapes, Peaches, Plums, Japanese Apricots, Kiwifruit, Figs, Yuja (Citron), Apricots
|
|
Food Crops (11)
|
Rice, Potatoes, Sweet Potatoes, Corn, Soybeans, Wheat, Buckwheat, Red Beans, Barley, Oats, Mung Beans
|
|
Specialty Crops (4)
|
Tea, Mulberry, Ginseng, Sesame
|
|
Vegetables (14)
|
Onions, Garlic, Cabbage, Chinese Cabbage, Radish, Green Onions, Squash, Spinach, Carrots, Chili Peppers, Broccoli, Lettuce, Watermelon, Ginger
|
|
Forest Products (8)
|
Astringent Persimmons, Chestnuts, Jujubes, Bokbunja (Korean Black Raspberry), Schisandra, Walnuts, Shiitake Mushrooms, Deodeok(Codonopsis lanceolata)
|
|
Greenhouse Crops (23)
|
Watermelon, Strawberries, Cucumbers, Tomatoes, Chamoe (Oriental Melon), Chili Peppers, Squash, Chrysanthemums, Roses, Melons, Paprika, Chives, Spinach, Lettuce, Eggplant, Chinese Cabbage, Green Onions, Radish, Lilies, Carnations, Water Dropwort, Mugwort, Potatoes
|
|
Mushrooms (3)
|
Oyster Mushrooms, King Oyster Mushrooms, Enoki Mushrooms
|
|
Agricultural Facilities
|
Single-span Greenhouses, Multi-span Greenhouses, Glass Greenhouses
|
Source: Agricultural Policy Insurance and Finance Service
Operational Framework
The operational structure of Korea’s crop disaster insurance program is built upon a sophisticated multi-layered partnership involving government bodies, public agencies, private insurers, and specialized evaluation entities. This integrated system ensures transparent management, professional risk assessment, and stable financial support.
Governance and oversight
The Ministry of Agriculture, Food and Rural Affairs (MAFRA) holds primary responsibility for the program, delegating management and oversight to the Agricultural Policy Insurance and Finance Service (APIFS).
- APIFS: Acts as the administrative hub, responsible for selecting disaster insurance operators through contractual agreements. It formulates comprehensive management plans, monitors business operations, improves insurance products and systems, and manages loss adjuster training.
- Financial oversight: MAFRA and APIFS also oversee the disbursement of premium subsidies and operating costs directly to the insurance operators.
Execution and sales operations
NONGHYUP PROPERTY & CASUALITY INSURANCE (NH Insurance) is designated as the primary disaster insurance operator.
- Implementation plans: NH Insurance develops detailed strategies for promoting enrollment, utilizing operational budgets, and developing new products, all of which are submitted to APIFS for approval.
- Sales channel: The actual sale of insurance products to farmers is conducted through Agricultural and livestock cooperatives, which provide localized access and direct education to the farming community.
- Policyholders (Farmers): Farmers pay their portion of the insurance premium to the operator and, in the event of a disaster, receive indemnity payments based on verified losses.
Disaster loss assessment and actuarial support
To ensure fairness and accuracy in payouts, the system utilizes specialized assessment personnel.
- Loss assessment: Upon the occurrence of a disaster, loss assessment personnel — including loss adjustment firms, individual loss adjusters, and certified loss appraisers — are commissioned to evaluate damage rates and submit assessment reports.
- Rate calculation: The Insurance Development Institute provides critical actuarial support by calculating objective insurance premium rates annually, while the Financial Supervisory Service verifies foundational documents to maintain regulatory compliance.
Risk Distribution and Reinsurance
Given the catastrophic nature of agricultural risks, the framework includes a robust risk-sharing mechanism.
- National reinsurance: Because private insurers have limited capacity to absorb massive losses, the government acts as the ultimate guarantor. Under a profit-and-loss sharing mechanism like Standard Reinsurance Agreements in USDA-RMA, the government and NH Insurance share profits or losses.
- Private reinsurance: To further diversify risk, NH Insurance enters into proportional reinsurance agreements with both domestic and international private reinsurance companies.
OPERATIONAL PERFORMANCE OF CROP DISASTER INSURANCE PROGRAM
Program outcomes and operational performance
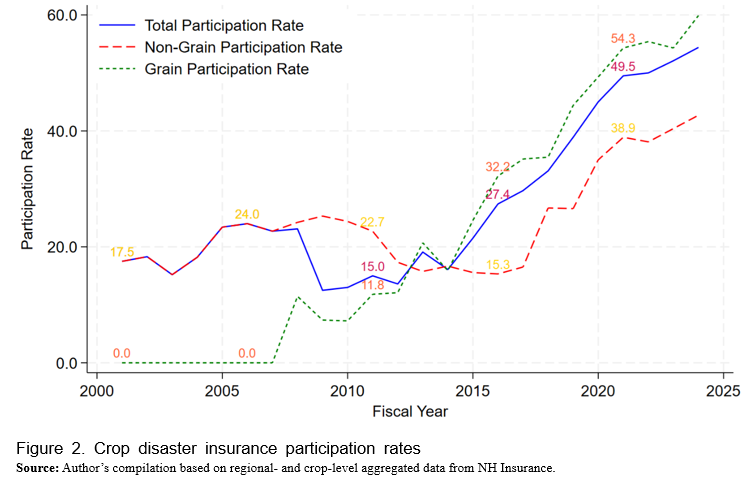
Since its official introduction in 2001, the Crop Disaster Insurance (CDI) program has achieved extraordinary quantitative and qualitative growth. The total insured area under the program surged from a modest 4,096 hectares in its inaugural year to 551,735 hectares by 2020, representing a staggering 135-fold increase. Correspondingly, the overall insurance participation rate has risen steadily, from 13.5% in 2011 to 45.0% in 2020, and to an average of 54.4% by 2024.
Trends in Participation Rates
As illustrated in the historical data, participation rates are highly sensitive to disaster occurrences in the preceding year. For instance, the lack of major disasters in 2013 led to a slight decline in the 2014 participation rate. However, several key trends have defined the program's expansion:
- The "rice effect": The introduction of rice insurance in 2009 was a watershed moment. The Grain Participation Rate, which stood at 0.0% through most of the 2000s, began a rapid ascent after 2009, climbing from 11.8% in 2011 to a peak of 54.3% in 2021.
- Fruit and specialty crops: The Non-Grain Participation Rate (primarily fruit crops) showed early volatility, peaking at 24.0% in 2006 before dipping and then rising again to 49.5% by 2021. Severe spring frost damage in 2019 notably triggered a sharp increase in fruit crop production in 2020.
- Current standing (2024): By 2024, participation remained relatively high for core groups such as Food Crops (59.9%) and Fruit Crops (49.6%), while Revenue Insurance remained at a lower pilot stage with 3.9% participation.
Risk Pooling and Farmer Burden
As participation rates increase, the program’s ability to pool risk improves, enhancing overall operational efficiency. Despite subsidy rates often exceeding 80% — with the central and local governments covering the vast majority of costs — the area-based participation rate remained modest at 45.0% in 2020.
However, the financial incentive for farmers remains strong:
- Low individual burden: Officially, farmers pay approximately 15.1% of pure premiums after accounting for central and local government subsidies. This burden is often even lower when additional support from local agricultural and livestock cooperatives is included.
- Diverging premium rates: There is a clear distinction in insurance rates. While Forest Products (15.93%) and Fruit Crops (14.78%) carry higher premium rates, Agricultural Facilities (0.68%) and Food Crops (3.90%) — characterized by very large insured amounts — benefit from much lower rates, which helps pull down the overall program average to 3.32%.
While participation is high for staple crops like rice and the four major fruit categories, it remains relatively low for other food crops and vegetables. Bridging this gap remains a key policy objective to ensure a comprehensive national agricultural safety net.
Table 3. Enrollment and indemnity payments under the crop disaster insurance program (2024)
(Unit: USD million, number of cases, %)
|
Category
|
Insured
Amount
|
Participation
Rate (%)
|
Risk
Premium (A)
|
Farmer
Premium
|
No. of Insured farmlands
|
No. of Paid farmlands
|
Indemnity
Payments (B)
|
Loss
Ratio
(B/A)
|
Claim
Rate (%)
|
Insurance
Rate (%)
|
|
Fruit Crops
|
1,873.8
|
49.6
|
277.0
|
40.3
|
132,950
|
54,494
|
164.9
|
59.52
|
40.99
|
14.78
|
|
Food Crops
|
4,011.1
|
59.9
|
156.4
|
27.3
|
1,931,505
|
599,099
|
258.9
|
165.54
|
31.02
|
3.90
|
|
Vegetables
|
1,130.3
|
40.7
|
92.8
|
10.8
|
174,614
|
95,903
|
120.0
|
129.26
|
54.92
|
8.21
|
|
Specialty Crops
|
493.2
|
42.5
|
20.3
|
1.9
|
20,878
|
3,036
|
20.4
|
100.66
|
14.54
|
4.12
|
|
Forest Products
|
240.2
|
38.9
|
38.3
|
3.8
|
15,609
|
9,319
|
44.1
|
115.33
|
59.70
|
15.93
|
|
Agricultural
Facilities
|
12,560.4
|
-
|
85.0
|
10.0
|
372,472
|
29,236
|
38.3
|
45.03
|
7.85
|
0.68
|
|
Greenhouse
Crops
|
1,170.6
|
-
|
39.6
|
4.0
|
266,690
|
38,365
|
47.8
|
120.92
|
14.39
|
3.38
|
|
Revenue
Insurance
|
63.1
|
3.9
|
5.6
|
0.6
|
8,090
|
4,000
|
4.3
|
76.64
|
49.44
|
8.91
|
|
Total
|
21,542.7
|
54.4
|
715.0
|
98.8
|
2,922,808
|
833,452
|
698.7
|
97.73
|
28.52
|
3.32
|
Note: Crop categories are based on 73 items as of 2024.
Source: Agricultural Policy Insurance and Finance Service.
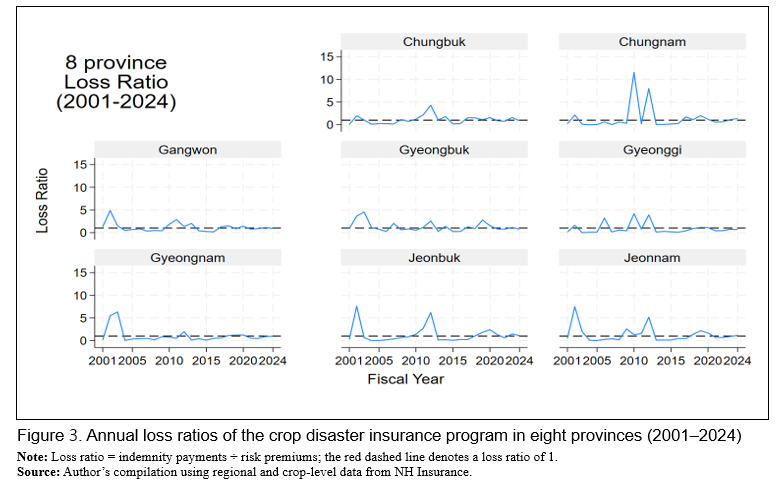
Loss ratios of crop disaster insurance
The financial stability of the crop disaster insurance program is primarily measured by its loss ratio, which reflects the relationship between indemnity payments and risk premiums. Over the past 24 years, the program has demonstrated significant regional volatility, with cumulative loss ratios generally ranging from 0.6 to 1.14 across most provinces and metropolitan regions.
Regional Variations and Cumulative Performance
A detailed examination of the cumulative data reveals that five of the eight major provinces recorded loss ratios exceeding the "break-even" threshold of 1.0, indicating that total payouts in these regions have exceeded the premiums collected.
- High-loss regions: Chungbuk (1.14), Jeonbuk (1.13), and Chungnam (1.10) recorded the highest cumulative loss ratios, followed by Incheon (1.07), Gyeongbuk (1.03), and Jeonnam (1.02). These figures underscore the high exposure of these provinces to frequent natural disasters.
- Low-loss regions: In contrast, metropolitan cities like Seoul (0.31) and Busan (0.59), along with provinces such as Gyeonggi (0.71), Jeju (0.77), and Gyeongnam (0.79), maintained loss ratios well below 1.0, suggesting relatively stable management in these areas.
- Volatility and risk: Beyond the cumulative ratios, the Standard Deviation of Loss Ratio provides insight into the predictability of risks. Chungnam (2.74), Incheon (2.37), and Jeonbuk (1.91) exhibited the highest volatility, indicating a high frequency of extreme, unpredictable disaster events. Notably, Seoul's exceptionally high standard deviation (10.56) is likely due to its very small insured base, where even a single minor claim can cause massive statistical swings.
Table 4. Cumulative loss ratios by province under the crop disaster insurance program (2024)
|
Province / Metropolitan city
|
Cumulative loss ratio
|
Standard deviation of loss ratio
|
|
Gangwon
|
0.99
|
1.38
|
|
Gyeonggi
|
0.71
|
1.33
|
|
Gyeongnam
|
0.79
|
1.55
|
|
Gyeongbuk
|
1.03
|
1.05
|
|
Gwangju
|
0.76
|
1.60
|
|
Daegu
|
0.95
|
1.24
|
|
Daejeon
|
0.84
|
1.31
|
|
Busan
|
0.59
|
1.40
|
|
Seoul
|
0.31
|
10.56
|
|
Sejong
|
0.88
|
1.31
|
|
Ulsan
|
0.82
|
2.01
|
|
Incheon
|
1.07
|
2.37
|
|
Jeonnam
|
1.02
|
1.73
|
|
Jeonbuk
|
1.13
|
1.91
|
|
Jeju
|
0.77
|
0.98
|
|
Chungnam
|
1.10
|
2.74
|
|
Chungbuk
|
1.14
|
1.11
|
Source: Agricultural Policy Insurance and Finance Service.
Historical volatility and catastrophic events
The annual loss ratio trends depicted in Figure 3 highlight the agricultural sector's inherent vulnerability to catastrophic black-swan events. While many years show loss ratios remaining below 1.0, the program's history is punctuated by sharp peaks that threaten fiscal sustainability.
- Catastrophic spikes: Most regions have experienced at least one catastrophic year where the loss ratio exceeded 3.0. The most extreme examples are found in Chungnam, which recorded staggering loss ratios exceeding 10.0 in specific years, often due to localized but severe typhoons or frost.
- Historical patterns:
- Early 2000s: Massive peaks are visible in 2002 and 2003 (Typhoons Rusa and Maemi), particularly in Jeonnam, Kyungnam, and Gangwon, where loss ratios soared between 5.0 and 8.0.
- Mid-2010s: A significant spike occurred around 2012, particularly affecting Chungnam and Jeonnam.
- 2019-2020: Severe spring frost and typhoons led to another round of elevated loss ratios across almost all provinces.
- Convergence toward stability: A notable trend observed since 2020 is the convergence of loss ratios toward 1.0. This stabilization suggests that the program's actuarial precision in premium rate calculation—performed annually by the Insurance Development Institute—is improving, and risk-pooling mechanisms are becoming more effective as participation grows.
Despite these improvements, the frequent recurrence of "peak years" confirms that the national reinsurance scheme remains essential for protecting the primary insurer from insolvency during catastrophic periods.
DEVELOPMENT OF AGRICULTURAL REVENUE INSURANCE PROGRAM
Overview and strategic background
While crop disaster insurance focuses on production volume risks, the early 2010s saw a growing need for a more comprehensive safety net that could also address market-driven risks. As agricultural price volatility increased, the vulnerability of farm households to income instability became a critical policy concern.
Against this background, formal discussions on introducing a Revenue Insurance program—which covers both yield loss and price declines—commenced in 2012. Following extensive research and multiple simulation exercises, a pilot program was officially launched in 2015. Since its inception, the program has evolved from a limited trial into a critical instrument for mitigating management risks, now covering 15 crops in selected regions as of 2025.
Evolution and chronological milestones
The development of the revenue insurance program has been characterized by a cautious, data-driven approach, involving rigorous testing before regional expansion.
- Conceptualization phase (2012–2014):
- The process began in June 2012 with a Policy Coordination Committee meeting held by the Ministry of Agriculture, Food and Rural Affairs (MAFRA), followed by the operation of a dedicated task force in July.
- Between 2012 and 2013, specialized research was commissioned to design viable insurance products.
- Simulation Exercises: To verify the actuarial feasibility, two rounds of simulations were conducted. The first (March 2013) covered six items including grapes, onions, and Hanwoo cattle, while the second (March 2014) included rice, garlic, and citrus.
- Pilot implementation and expansion (2015–2023):
- The pilot project was officially launched in 2015 in 14 cities and counties, initially covering soybeans, onions, and grapes.
- The program steadily grew in geographic scope and product variety: Garlic was added in 2016 (22 regions), followed by sweet potatoes and fall potatoes in 2017 (30 regions).
- By 2023, the pilot had reached 35 cities and counties, with cabbage integrated into the portfolio.
- Major acceleration (2024–2025):
- In 2024, the program began to cover grains more extensively with the addition of corn and barley.
- The year 2025 marks a significant scaling up of the program. A wide array of essential crops has been added, including rice, spring/highland potatoes, fall cabbage/radish, late-maturing citrus, sweet persimmons, and peaches.
Current scope and policy implications
The transition from a 3-item pilot to a 15-item program reflects the government's strategy to move beyond simple natural disaster compensation toward comprehensive income protection. By integrating price risk into the insurance framework, the program provides a more realistic safety net for modern commercial farming, where market fluctuations are often as damaging as weather events.
The systematic expansion seen in the 2025 timeline suggests that revenue insurance is moving toward becoming a mainstream pillar of the national agricultural policy, providing a vital reference point for other Asian economies facing similar market volatility challenges.
Table 5. Development timeline of the agricultural revenue insurance program
|
Year
|
Key developments
|
|
Jun 2012
|
Policy Coordination Committee meeting held by the Ministry of Agriculture, Food and Rural Affairs
|
|
Jul 2012
|
Operation of a task force to review institutional improvements and introduction plans for revenue insurance
|
|
2012–2013
|
Research commissioned on the design of agricultural revenue insurance products
|
|
Mar 2013
|
First simulation exercises conducted for six items (grapes, onions, greenhouse cucumbers, soybeans, Chinese cabbage, Hanwoo cattle)
|
|
Mar 2014
|
Second simulation exercises conducted for five items (rice, garlic, sweet potatoes, greenhouse tomatoes, citrus)
|
|
2015
|
Pilot project implemented in 14 cities and counties for three items (soybeans, onions, grapes)
|
|
2016
|
Pilot project expanded to 22 cities and counties, additionally including garlic
|
|
2017
|
Pilot project expanded to 30 cities and counties, additionally including sweet potatoes and fall potatoes
|
|
2018–2023
|
Pilot project expanded to 35 cities and counties, additionally including cabbage
|
|
2024
|
Corn and barley added
|
|
2025
|
Rice, spring potatoes, highland potatoes, fall cabbage, fall radish, citrus (late-maturing), sweet persimmons, peaches, highland cabbage, and highland radish added
|
Source: Ministry of Agriculture, Food and Rural Affairs.
Budget
In contrast to the steady upward trend in crop disaster insurance, the budget for revenue insurance remained relatively modest and even declined temporarily between 2021 and 2023. However, the fiscal landscape changed dramatically in 2025.
This unprecedented surge to USD 141.4 million in 2025 reflects a major policy shift. The government is now moving beyond small-scale pilot projects to establish revenue insurance as a primary management tool in response to the growing instability of farm income conditions.
Table 6. Budget trends of the agricultural revenue insurance program over the past five years
Unit: USD million
|
Category
|
2021
|
2022
|
2023
|
2024
|
2025
|
|
Budget
|
1.3
|
1.4
|
1.4
|
3.6
|
141.4
|
Source: Ministry of Agriculture, Food and Rural Affairs, "Guidelines for the Agricultural Revenue Insurance Program," each year.
Covered crops
As the program matures, it distinguishes between established "Main Program" items and emerging "Pilot Program" items to manage risk effectively.
- Main program (10 Items): Includes stabilized crops like sweet potatoes, corn, soybeans, garlic, onions, grapes, barley, and various fall/winter cabbage and potatoes.
- Pilot program (10 Items): Includes high-stakes or newly added items such as rice, spring/highland potatoes, peaches, sweet persimmons, late-maturing citrus, and highland cabbage/radish.
The transition of rice into the pilot program for revenue insurance is particularly significant, as it indicates the government's intention to provide price-floor protection for Korea's most vital staple crop, mirroring the comprehensive protection already enjoyed under the disaster insurance scheme.
Table 7. Crops covered by the agricultural revenue insurance program (as of 2025)
|
Category
|
Covered Crops
|
|
Main program
|
Sweet potatoes, Corn, Soybeans, Fall Chinese cabbage, Winter Chinese cabbage, Fall potatoes, Garlic, Onions, Grapes, Barley
|
|
Pilot program
|
Rice, Spring potatoes, Highland potatoes, Fall cabbage, Fall radish, Citrus (late-maturing), Sweet persimmons, Peaches, Highland cabbage, Highland radish
|
Source: Agricultural Policy Insurance and Finance Service.
KEY POLICY CHALLENGES RELATED TO AGRICULTURAL INSURANCE[1]
Basic policy direction
As the Korean crop disaster insurance program marks its 25th year, it has achieved remarkable quantitative growth, evidenced by a 135-fold increase in insured area since 2001 and an expansion to 76 insured crops as of 2025. The program is now entering a stage of qualitative maturity, where expansion must be balanced with operational precision.
To ensure long-term viability, the policy must satisfy three conditions:
- Farm management stability: It must contribute meaningfully to income security.
- Actuarial soundness: The policy must continue to function as insurance in a technical sense.
- Policy sustainability: It must remain fiscally and institutionally sustainable, especially as the total budget reached USD 296.3 million in 2021.
Short-term tasks
Expansion and Improvement of Revenue Insurance
Abnormal climate conditions increase production and price volatility, heightening farm instability. The 2025 budget for revenue insurance has seen a monumental surge to USD 141.4 million.
- Challenge: Participation in revenue insurance remained at a lower pilot stage of 3.9% in 2024 compared to the 54.4% total rate for disaster insurance.
- Action: There is a need to broaden the regional availability of the 15 pilot crops (including rice and peaches) and resolve operational issues identified during earlier implementation.
Compensation for pests and diseases
While disaster insurance covers most production risks, compensation for pests and diseases is currently limited to specific crops.
- Action: Given the higher frequency of outbreaks, the range of eligible crops must expand. To manage moral hazard, objective information systems must be developed with the Rural Development Administration to distinguish unavoidable damage from insufficient control efforts.
Linkage with other agricultural policies
Agricultural insurance should serve as a catalyst for broader policy goals.
- Synergy: Synergistic effects can be generated by offering preferential premium subsidies to beginning farmers (beyond the current 15.1% farmer burden) or making enrollment a condition for other government support programs.
Medium- to Long-term tasks
Utilization of ICT technologies
Korea's fragmented farmland structure requires advanced technology to ensure accuracy in underwriting and loss assessment.
- Underwriting: Drones and satellites should build a visualized, parcel-level database to enable data-driven systems.
- Assessment: For staples like rice, yield-monitoring systems on combine harvesters can automate loss evaluation, using actual yield data for payouts.
Strengthening insurance product planning capacity
The program must move beyond incremental improvements toward sophisticated risk response.
- R&D focus: New products should address diverse risks like quality deterioration.
- Structural reform: Reorganizing the APIFS into an Agricultural Finance and Insurance Corporation is necessary to provide the specialized staff required for advanced planning.
Development of objective risk awareness programs
A barrier to enrollment is farmers' subjective risk perception.
- Action: The government must develop programs that help farmers objectively recognize their disaster risk levels rather than relying on short-term memory of past disasters.
Strategic policy suggestions
Based on the historical loss ratio data and budgetary trends, this paper suggests the following additional focuses:
- Tailored regional risk management: Provinces like Chungbuk (1.14) and Jeonbuk (1.13) consistently show loss ratios above 1.0. Policies should shift from uniform national rates to more localized, risk-adjusted premium structures to ensure the long-term solvency of the reinsurance fund.
- Diversifying the reinsurance pool: As the budget for subsidies grows, the government's exposure to "massive loss" also increases. Expanding proportional reinsurance agreements with international private reinsurers will be critical to protecting the national budget from catastrophic years, when loss ratios have historically exceeded 10.0 in some regions.
Implications for Asian countries
The South Korean experience offers a vital blueprint for Asian nations characterized by small-scale farming and high climate vulnerability:
- The necessity of Public-Private Partnerships (PPP): Korea's history shows that private insurers cannot independently sustain agricultural insurance. A robust National Reinsurance Scheme is the essential "safety valve" that allows private operators to participate without fear of insolvency.
- Incremental expansion strategy: Rather than a nationwide launch for all crops, Korea’s "pilot-to-nationwide" approach (starting with 2 crops in 2001 and reaching 76 in 2025) allows for the collection of actuarial data and the adjustment of premium rates before full-scale fiscal commitment.
- The Power of subsidies: High participation (reaching 54.4% in 2024) was only possible through a multi-layered subsidy system that reduced the farmer's share to approximately 15%. For developing Asian economies, providing high initial subsidies is a proven way to build a "culture of insurance" and achieve the necessary risk-pooling scale.
REFERENCES
Kim Taehoo, Yeon Kwanghun (2024), Strategies to Strengthen the Role of Agricultural Disaster Insurance, Agro-Policy Focus, Korea Rural Economic Institute (KREI).
Ministry of Agriculture, Food and Rural Affairs (2025). Guidelines for the Agricultural Disaster Insurance Program.
Ministry of Agriculture, Food and Rural Affairs. Guidelines for the Agricultural Revenue Insurance Program, each year.
Ministry of Agriculture, Food and Rural Affairs, Overview of Budget and Fund Operation plans, each year. Agricultural Policy Insurance and Finance Service:https://www.apfs.kr/front/contents/chart1ListPage.do?menuId=5366
[1] This chapter is heavily adopted from Kim and Yeon (2024)

Overview and Policy Challenges of Disaster Insurance and Agricultural Revenue Insurance in Korea
ABSTRACT
This report provides a comprehensive analysis of the development and operational performance of South Korea’s agricultural insurance system, focusing on the Crop Disaster Insurance (CDI) program since its inception in 2001 and the more recent Agricultural Revenue Insurance pilot scheme. Over the past 25 years, Korea has established a robust national safety net, achieving a 135-fold increase in insured area and expanding coverage to 76 crops as of 2025. The success of the program is rooted in a unique public-private partnership model, in which the government provides substantial premium subsidies—reducing the farmer's actual burden to approximately 15.1%—and acts as the final guarantor through a national reinsurance scheme. While the program has matured significantly, it faces ongoing challenges, including high volatility in loss ratios in certain regions and the need for more sophisticated risk management tools. Looking ahead, the report outlines short-term goals, such as expanding revenue insurance—highlighted by a dramatic budget surge to USD 141.4 million in 2025—and medium- to long-term strategies involving the integration of ICT technologies (drones, satellites, and yield-monitoring sensors) and structural reforms to strengthen product planning. These experiences offer valuable institutional and fiscal blueprints for other Asian countries seeking to enhance farm management stability amid rising climate and market volatility.
Keywords: Agricultural Disaster Insurance (ADI), Revenue Insurance, Loss Ratio & Volatility, Farmer Premium Subsidy, Republic of Korea
INTRODUCTION
The primary objective of this report is to provide a comprehensive overview of the Crop Disaster Insurance (CDI) program in South Korea, which has served as a cornerstone of the national agricultural safety net for over two decades. While the analysis focuses extensively on the development and operational performance of the CDI program, it also briefly introduces the Agricultural Revenue Insurance scheme, a relatively recent policy instrument designed to mitigate price volatility.
The necessity of this review stems from the increasing frequency of extreme weather events and market instability, which pose significant threats to farm management and food security. Since its inception in 2001, the Korean agricultural insurance model has evolved through a unique public-private partnership, overcoming structural limitations to achieve substantial quantitative and qualitative growth.
By examining the South Korean experience—including its institutional design, budget allocation, and challenges such as loss-ratio volatility—this report aims to provide valuable insights and a practical reference for Asian countries seeking to establish or refine their agricultural policy frameworks. We believe that these lessons in risk management and policy linkage will contribute to the sustainable development of agriculture across the region.
OVERVIEW OF CROP DISASTER INSURANCE PROGRAM
Development and expansion of the crop disaster insurance program
Natural disasters in agriculture often cause damage simultaneously across multiple regions, making risk diversification exceptionally difficult for insurers. As a result, private insurance companies face inherent structural limitations in independently underwriting crop disaster insurance, making it challenging to operate such schemes as standard commercial products without intervention.
Accordingly, from the late 1970s to the early 1990s, the Korean government repeatedly examined the feasibility of introducing a public-private partnership model for crop disaster insurance. However, these early reviews consistently concluded that the expected policy effectiveness would be limited relative to the substantial fiscal expenditures required. Consequently, the program's official introduction was not pursued during that period.
The turning point came in 1999 following Typhoon Olga, which caused catastrophic damage to the agricultural sector and exposed the clear limitations of the existing disaster relief system. In response, the government reconsidered the insurance model, and after approximately two years of intensive institutional design, a policy-based insurance scheme was officially launched in 2001. The program’s primary objective was to stabilize farm income and management, initially covering only two crops: apples and pears.
The core mission of agricultural disaster insurance—encompassing both crop disaster and revenue insurance—is to promote farm management stability by providing compensation for crop losses caused by unpredictable natural disasters. In the medium to long term, the program aims to establish a joint risk management framework between farmers and the government. This encourages farmers to move beyond passive reliance on aid, fostering a culture of active, autonomous risk management within the agricultural sector.
In the early stages of implementation, several operational challenges emerged. Limited institutional experience, unstable loss ratios across the newly insured crops, and a sharp increase in payouts due to massive disasters such as Typhoons Rusa and Maemi placed a significant operational burden on the primary insurer, NongHyup Property & Casualty Insurance Co.,Ltd. Consequently, in 2005, the government introduced a national reinsurance scheme based on a stop-loss design. Under this framework, the government compensates for losses exceeding a certain threshold, a measure that significantly reduced the burden on private insurers and served as a crucial turning point in the program's expansion and stabilization.
Since this stabilization, the program has seen a rapid expansion in the number of covered crops and eligible regions. Following the initial focus on major fruits such as peaches, grapes, and citrus in the early 2000s, the program expanded to field crops (chili peppers, soybeans, onions) in 2008 and to staples such as rice in 2009. Throughout the 2010s, a wide variety of greenhouse crops (strawberries, cucumbers, tomatoes), specialty crops (ginseng, tea), and forest products (walnuts, jujubes) were integrated into the pilot and nationwide programs.
Recent years have seen the inclusion of diverse vegetables and grains to create a more inclusive safety net:
This continuous growth ensures that the vast majority of Korea's agricultural produce is protected, contributing significantly to the stability of farm management nationwide.
Table 1. Development of the crop disaster insurance program
Year
Major Developments
2001
Enactment of the Crop Disaster Insurance Act and its Enforcement Decree; pilot programs for apples and pears
2002
Pilot programs for peaches, grapes, sweet persimmons, and citrus
2003
Nationwide implementation for apples and pears
2004
Nationwide implementation for peaches, grapes, sweet persimmons, and citrus
2005
Revision of the Crop Disaster Insurance Act (introduction of national reinsurance and fund establishment); establishment of the Crop Disaster Insurance Fund
2008
Full implementation for sweet persimmons; pilot programs for chili peppers, soybeans, potatoes, onions, and watermelons
2009
Revision of the Agricultural Disaster Insurance Act; pilot programs for rice, barley, corn, sweet potatoes, garlic, and plums
2010
Enforcement of the Agricultural Disaster Insurance Act (integration of crops, livestock, and aquaculture); pilot programs for jujubes, greenhouse strawberries, greenhouse cucumbers, greenhouse tomatoes, greenhouse paprika, and agricultural facilities
2011
Pilot programs for Bokbunja (Korean black raspberry), red chili peppers, pumpkins, greenhouse chrysanthemums, and greenhouse roses
2012
Pilot programs for ginseng, greenhouse melons, greenhouse paprika, ducks, and green tea
2013
Pilot programs for greenhouse crops (lettuce, spinach, Chinese cabbage, oyster mushrooms, shiitake mushrooms); pilot program for comprehensive coverage for pears
2014
Pilot programs for greenhouse crops (Chinese cabbage, eggplant, green onions); pilot program for comprehensive coverage for sweet persimmons
2015
Pilot programs for greenhouse crops (radish, lilies, carnations); pilot program for comprehensive coverage for apples
2016
Pilot programs for greenhouse water dropwort, wheat, napa cabbage, and schizandra; pilot program for comprehensive coverage for sweet persimmons
2017
Pilot programs for greenhouse peppers, figs, and yuja (citron); full implementation of comprehensive coverage for pears and sweet persimmons
2018
Pilot programs for buckwheat, broccoli, king oyster mushrooms, and enoki mushrooms
2019
Pilot programs for Chinese cabbage, radish, pumpkin, carrots, and green onions
2020
Pilot programs for walnuts, adzuki beans, spinach, barley, and apricots
2023
Pilot programs for squash, carrots, and green onions (including large green onions)
2024
Pilot programs for adlay (Job’s tears), blueberries, and watermelons
2025
Pilot programs for mung beans, ginger, and sesame
Source: Ministry of Agriculture, Food and Rural Affairs. 2025.
Eligibility and support structure
The accessibility and financial feasibility of the crop disaster insurance program are underpinned by a structured eligibility framework and a multi-layered premium support system designed to minimize the financial burden on individual farm households.
Eligibility for the program is strictly defined to ensure that the insurance functions as a professional management tool. Participation is limited to individual farmers and agricultural corporations that own or cultivate farmland. A critical prerequisite for enrollment is meeting the minimum insured area requirements, which vary by crop to reflect different cultivation standards and risk profiles. This ensures that the insured plots are at a viable commercial scale, enabling more accurate disaster loss assessment and actuarial management.
To cater to farmers' varying risk appetites and financial capacities, the program offers a wide range of coverage levels. While specific coverage terms may vary by crop, most insurance products offer multiple coverage levels, typically including 60%, 70%, 80%, 85%, and 90%. This flexibility allows farmers to choose between lower-premium options with basic protection or higher-coverage levels that offer more robust income security against catastrophic events.
The most significant driver of high participation rates is the comprehensive subsidy structure provided by both central and local authorities.
As a result of this robust support framework, farmers' actual out-of-pocket expenses are remarkably low. On average, after accounting for central and local government subsidies, farmers are officially responsible for only about 15.1% of the pure premiums. When the additional contributions from local cooperatives are factored in, the real premium burden borne by farmers is often even lower, making the insurance a highly cost-effective risk management strategy for most agricultural households.
Budget and insured crops
The financial scale of the crop disaster insurance program has undergone a remarkable transformation, reflecting the government's growing commitment to agricultural stability. According to budgetary data, total expenditure for crop disaster insurance exceeded USD 68 million for the first time in 2012 and has continued to rise since. This growth became particularly explosive after 2019, with the total budget reaching a record high of USD 296.3 million in 2021, encompassing both premium subsidies and essential operational cost support.
A detailed analysis of the expenditure components reveals several critical trends:
Since its inception in 2001, with a narrow focus on apples and pears, the crop disaster insurance program has undergone a steady, strategic expansion to encompass nearly every sector of Korean agriculture. A significant milestone in this growth occurred in 2020, when five additional crops—apricots (fruit), adzuki beans and barley (food crops), spinach (vegetables), and walnuts (forest products)—were introduced on a pilot basis. This brought the total number of protected crops to 67 by the end of 2020, marking a transition toward a more comprehensive national safety net.
As of 2025, the program has reached a high level of maturity, covering a total of 76 crops categorized into diverse agricultural groups:
This evolution from a fruit-centric pilot to a multi-sectoral framework demonstrates the program's adaptability to the diverse risks faced by modern farming households, ensuring that specialty and greenhouse cultivation are as protected as traditional open-field staples.
Table 2. Crops covered by the crop disaster insurance program (as of 2025)
Category
Covered Crops
Fruit Crops (13)
Apples, Pears, Sweet Persimmons, Astringent Persimmons, Citrus, Grapes, Peaches, Plums, Japanese Apricots, Kiwifruit, Figs, Yuja (Citron), Apricots
Food Crops (11)
Rice, Potatoes, Sweet Potatoes, Corn, Soybeans, Wheat, Buckwheat, Red Beans, Barley, Oats, Mung Beans
Specialty Crops (4)
Tea, Mulberry, Ginseng, Sesame
Vegetables (14)
Onions, Garlic, Cabbage, Chinese Cabbage, Radish, Green Onions, Squash, Spinach, Carrots, Chili Peppers, Broccoli, Lettuce, Watermelon, Ginger
Forest Products (8)
Astringent Persimmons, Chestnuts, Jujubes, Bokbunja (Korean Black Raspberry), Schisandra, Walnuts, Shiitake Mushrooms, Deodeok(Codonopsis lanceolata)
Greenhouse Crops (23)
Watermelon, Strawberries, Cucumbers, Tomatoes, Chamoe (Oriental Melon), Chili Peppers, Squash, Chrysanthemums, Roses, Melons, Paprika, Chives, Spinach, Lettuce, Eggplant, Chinese Cabbage, Green Onions, Radish, Lilies, Carnations, Water Dropwort, Mugwort, Potatoes
Mushrooms (3)
Oyster Mushrooms, King Oyster Mushrooms, Enoki Mushrooms
Agricultural Facilities
Single-span Greenhouses, Multi-span Greenhouses, Glass Greenhouses
Source: Agricultural Policy Insurance and Finance Service
Operational Framework
The operational structure of Korea’s crop disaster insurance program is built upon a sophisticated multi-layered partnership involving government bodies, public agencies, private insurers, and specialized evaluation entities. This integrated system ensures transparent management, professional risk assessment, and stable financial support.
Governance and oversight
The Ministry of Agriculture, Food and Rural Affairs (MAFRA) holds primary responsibility for the program, delegating management and oversight to the Agricultural Policy Insurance and Finance Service (APIFS).
Execution and sales operations
NONGHYUP PROPERTY & CASUALITY INSURANCE (NH Insurance) is designated as the primary disaster insurance operator.
Disaster loss assessment and actuarial support
To ensure fairness and accuracy in payouts, the system utilizes specialized assessment personnel.
Risk Distribution and Reinsurance
Given the catastrophic nature of agricultural risks, the framework includes a robust risk-sharing mechanism.
OPERATIONAL PERFORMANCE OF CROP DISASTER INSURANCE PROGRAM
Program outcomes and operational performance
Since its official introduction in 2001, the Crop Disaster Insurance (CDI) program has achieved extraordinary quantitative and qualitative growth. The total insured area under the program surged from a modest 4,096 hectares in its inaugural year to 551,735 hectares by 2020, representing a staggering 135-fold increase. Correspondingly, the overall insurance participation rate has risen steadily, from 13.5% in 2011 to 45.0% in 2020, and to an average of 54.4% by 2024.
Trends in Participation Rates
As illustrated in the historical data, participation rates are highly sensitive to disaster occurrences in the preceding year. For instance, the lack of major disasters in 2013 led to a slight decline in the 2014 participation rate. However, several key trends have defined the program's expansion:
Risk Pooling and Farmer Burden
As participation rates increase, the program’s ability to pool risk improves, enhancing overall operational efficiency. Despite subsidy rates often exceeding 80% — with the central and local governments covering the vast majority of costs — the area-based participation rate remained modest at 45.0% in 2020.
However, the financial incentive for farmers remains strong:
While participation is high for staple crops like rice and the four major fruit categories, it remains relatively low for other food crops and vegetables. Bridging this gap remains a key policy objective to ensure a comprehensive national agricultural safety net.
Table 3. Enrollment and indemnity payments under the crop disaster insurance program (2024)
(Unit: USD million, number of cases, %)
Category
Insured
Amount
Participation
Rate (%)
Risk
Premium (A)
Farmer
Premium
No. of Insured farmlands
No. of Paid farmlands
Indemnity
Payments (B)
Loss
Ratio
(B/A)
Claim
Rate (%)
Insurance
Rate (%)
Fruit Crops
1,873.8
49.6
277.0
40.3
132,950
54,494
164.9
59.52
40.99
14.78
Food Crops
4,011.1
59.9
156.4
27.3
1,931,505
599,099
258.9
165.54
31.02
3.90
Vegetables
1,130.3
40.7
92.8
10.8
174,614
95,903
120.0
129.26
54.92
8.21
Specialty Crops
493.2
42.5
20.3
1.9
20,878
3,036
20.4
100.66
14.54
4.12
Forest Products
240.2
38.9
38.3
3.8
15,609
9,319
44.1
115.33
59.70
15.93
Agricultural
Facilities
12,560.4
-
85.0
10.0
372,472
29,236
38.3
45.03
7.85
0.68
Greenhouse
Crops
1,170.6
-
39.6
4.0
266,690
38,365
47.8
120.92
14.39
3.38
Revenue
Insurance
63.1
3.9
5.6
0.6
8,090
4,000
4.3
76.64
49.44
8.91
Total
21,542.7
54.4
715.0
98.8
2,922,808
833,452
698.7
97.73
28.52
3.32
Note: Crop categories are based on 73 items as of 2024.
Source: Agricultural Policy Insurance and Finance Service.
Loss ratios of crop disaster insurance
The financial stability of the crop disaster insurance program is primarily measured by its loss ratio, which reflects the relationship between indemnity payments and risk premiums. Over the past 24 years, the program has demonstrated significant regional volatility, with cumulative loss ratios generally ranging from 0.6 to 1.14 across most provinces and metropolitan regions.
Regional Variations and Cumulative Performance
A detailed examination of the cumulative data reveals that five of the eight major provinces recorded loss ratios exceeding the "break-even" threshold of 1.0, indicating that total payouts in these regions have exceeded the premiums collected.
Table 4. Cumulative loss ratios by province under the crop disaster insurance program (2024)
Province / Metropolitan city
Cumulative loss ratio
Standard deviation of loss ratio
Gangwon
0.99
1.38
Gyeonggi
0.71
1.33
Gyeongnam
0.79
1.55
Gyeongbuk
1.03
1.05
Gwangju
0.76
1.60
Daegu
0.95
1.24
Daejeon
0.84
1.31
Busan
0.59
1.40
Seoul
0.31
10.56
Sejong
0.88
1.31
Ulsan
0.82
2.01
Incheon
1.07
2.37
Jeonnam
1.02
1.73
Jeonbuk
1.13
1.91
Jeju
0.77
0.98
Chungnam
1.10
2.74
Chungbuk
1.14
1.11
Source: Agricultural Policy Insurance and Finance Service.
Historical volatility and catastrophic events
The annual loss ratio trends depicted in Figure 3 highlight the agricultural sector's inherent vulnerability to catastrophic black-swan events. While many years show loss ratios remaining below 1.0, the program's history is punctuated by sharp peaks that threaten fiscal sustainability.
Despite these improvements, the frequent recurrence of "peak years" confirms that the national reinsurance scheme remains essential for protecting the primary insurer from insolvency during catastrophic periods.
DEVELOPMENT OF AGRICULTURAL REVENUE INSURANCE PROGRAM
Overview and strategic background
While crop disaster insurance focuses on production volume risks, the early 2010s saw a growing need for a more comprehensive safety net that could also address market-driven risks. As agricultural price volatility increased, the vulnerability of farm households to income instability became a critical policy concern.
Against this background, formal discussions on introducing a Revenue Insurance program—which covers both yield loss and price declines—commenced in 2012. Following extensive research and multiple simulation exercises, a pilot program was officially launched in 2015. Since its inception, the program has evolved from a limited trial into a critical instrument for mitigating management risks, now covering 15 crops in selected regions as of 2025.
Evolution and chronological milestones
The development of the revenue insurance program has been characterized by a cautious, data-driven approach, involving rigorous testing before regional expansion.
Current scope and policy implications
The transition from a 3-item pilot to a 15-item program reflects the government's strategy to move beyond simple natural disaster compensation toward comprehensive income protection. By integrating price risk into the insurance framework, the program provides a more realistic safety net for modern commercial farming, where market fluctuations are often as damaging as weather events.
The systematic expansion seen in the 2025 timeline suggests that revenue insurance is moving toward becoming a mainstream pillar of the national agricultural policy, providing a vital reference point for other Asian economies facing similar market volatility challenges.
Table 5. Development timeline of the agricultural revenue insurance program
Year
Key developments
Jun 2012
Policy Coordination Committee meeting held by the Ministry of Agriculture, Food and Rural Affairs
Jul 2012
Operation of a task force to review institutional improvements and introduction plans for revenue insurance
2012–2013
Research commissioned on the design of agricultural revenue insurance products
Mar 2013
First simulation exercises conducted for six items (grapes, onions, greenhouse cucumbers, soybeans, Chinese cabbage, Hanwoo cattle)
Mar 2014
Second simulation exercises conducted for five items (rice, garlic, sweet potatoes, greenhouse tomatoes, citrus)
2015
Pilot project implemented in 14 cities and counties for three items (soybeans, onions, grapes)
2016
Pilot project expanded to 22 cities and counties, additionally including garlic
2017
Pilot project expanded to 30 cities and counties, additionally including sweet potatoes and fall potatoes
2018–2023
Pilot project expanded to 35 cities and counties, additionally including cabbage
2024
Corn and barley added
2025
Rice, spring potatoes, highland potatoes, fall cabbage, fall radish, citrus (late-maturing), sweet persimmons, peaches, highland cabbage, and highland radish added
Source: Ministry of Agriculture, Food and Rural Affairs.
Budget
In contrast to the steady upward trend in crop disaster insurance, the budget for revenue insurance remained relatively modest and even declined temporarily between 2021 and 2023. However, the fiscal landscape changed dramatically in 2025.
This unprecedented surge to USD 141.4 million in 2025 reflects a major policy shift. The government is now moving beyond small-scale pilot projects to establish revenue insurance as a primary management tool in response to the growing instability of farm income conditions.
Table 6. Budget trends of the agricultural revenue insurance program over the past five years
Unit: USD million
Category
2021
2022
2023
2024
2025
Budget
1.3
1.4
1.4
3.6
141.4
Source: Ministry of Agriculture, Food and Rural Affairs, "Guidelines for the Agricultural Revenue Insurance Program," each year.
Covered crops
As the program matures, it distinguishes between established "Main Program" items and emerging "Pilot Program" items to manage risk effectively.
The transition of rice into the pilot program for revenue insurance is particularly significant, as it indicates the government's intention to provide price-floor protection for Korea's most vital staple crop, mirroring the comprehensive protection already enjoyed under the disaster insurance scheme.
Table 7. Crops covered by the agricultural revenue insurance program (as of 2025)
Category
Covered Crops
Main program
Sweet potatoes, Corn, Soybeans, Fall Chinese cabbage, Winter Chinese cabbage, Fall potatoes, Garlic, Onions, Grapes, Barley
Pilot program
Rice, Spring potatoes, Highland potatoes, Fall cabbage, Fall radish, Citrus (late-maturing), Sweet persimmons, Peaches, Highland cabbage, Highland radish
Source: Agricultural Policy Insurance and Finance Service.
KEY POLICY CHALLENGES RELATED TO AGRICULTURAL INSURANCE[1]
Basic policy direction
As the Korean crop disaster insurance program marks its 25th year, it has achieved remarkable quantitative growth, evidenced by a 135-fold increase in insured area since 2001 and an expansion to 76 insured crops as of 2025. The program is now entering a stage of qualitative maturity, where expansion must be balanced with operational precision.
To ensure long-term viability, the policy must satisfy three conditions:
Short-term tasks
Expansion and Improvement of Revenue Insurance
Abnormal climate conditions increase production and price volatility, heightening farm instability. The 2025 budget for revenue insurance has seen a monumental surge to USD 141.4 million.
Compensation for pests and diseases
While disaster insurance covers most production risks, compensation for pests and diseases is currently limited to specific crops.
Linkage with other agricultural policies
Agricultural insurance should serve as a catalyst for broader policy goals.
Medium- to Long-term tasks
Utilization of ICT technologies
Korea's fragmented farmland structure requires advanced technology to ensure accuracy in underwriting and loss assessment.
Strengthening insurance product planning capacity
The program must move beyond incremental improvements toward sophisticated risk response.
Development of objective risk awareness programs
A barrier to enrollment is farmers' subjective risk perception.
Strategic policy suggestions
Based on the historical loss ratio data and budgetary trends, this paper suggests the following additional focuses:
Implications for Asian countries
The South Korean experience offers a vital blueprint for Asian nations characterized by small-scale farming and high climate vulnerability:
REFERENCES
Kim Taehoo, Yeon Kwanghun (2024), Strategies to Strengthen the Role of Agricultural Disaster Insurance, Agro-Policy Focus, Korea Rural Economic Institute (KREI).
Ministry of Agriculture, Food and Rural Affairs (2025). Guidelines for the Agricultural Disaster Insurance Program.
Ministry of Agriculture, Food and Rural Affairs. Guidelines for the Agricultural Revenue Insurance Program, each year.
Ministry of Agriculture, Food and Rural Affairs, Overview of Budget and Fund Operation plans, each year. Agricultural Policy Insurance and Finance Service:https://www.apfs.kr/front/contents/chart1ListPage.do?menuId=5366
[1] This chapter is heavily adopted from Kim and Yeon (2024)