ABSTRACT
A Headspace Solid Phase Microextraction (HS-SPME) method was developed using multivariate experimental designs, which was conducted in two stages. The significance of each factor was estimated using the Plackett-Burman (P-B) design, for the identification of significant factors, followed by the optimization of the significant factors using central composite design (CCD). The multivariate experiment involved the use of Minitab® statistical software for the generation of a 27-4 P-B design and CCD matrices. The method performance evaluated with internal standard calibration method produced good analytical figures of merit with linearity ranging from 1 – 500 µg/kg with correlation coefficient greater than 0.99; limit of detection (LOD) and limit of quantification (LOQ) were found between 0.35 and 8.33 µg/kg and 1.15 and 27.76 µg/kg, respectively. The average recovery was between 73 % and 118 % with relative standard deviation (RSD = 1.5 – 14 %) for all the investigated pesticides. The multivariate method helps to reduce sampling time and improve analytical throughput.
Kewords: GC-MS, SPME, multivariate design, central composite design, pesticide residues, fruits and vegetables
INTRODUCTION
An estimate of 1 billion people went hungry in 2010, and with the ever increasing world population, there is need for 70% increase in global food production by the year 2050. The increase in world population which has led to drastic increase in demand for food supply has also led to immeasurable rise in the application of chemical pesticides and fertilizers. To increase agricultural production and meet the growing demand for food, pesticides are used for control of pest and vector of plant diseases. Pesticides are also used in non-agricultural activities to control and eradicate carriers of vector borne diseases, such as malaria, yellow fever, typhoid fever and dengue, which are major public health concerns. The production and applications of pesticides in agriculture and non-agricultural purposes have led to steady increase in food production, high food quality and reduced incidence of illness due to insect-borne diseases. However, their continuous use has negative impact on the environment and their presence in soil, air, water and food poses a potential health risk due to their biocide activity. Therefore, pesticides must be used efficiently and effectively in order to strike a balance between their expected benefits and the possible risk to human health. This will enable their economic viability and environmental sustainability.
Although the use of pesticides has helped to increase food production, there is need to strike balance between the expected benefit and the possible risks to human health. Therefore, there is an urgent need for quality control monitoring of the use of such pesticides on fruits and vegetables for safety purposes. Analytical study is undertaken in order to obtain information on the quality and quantity of contaminants present in the sample. The extraction and subsequent analysis of pesticide residues and other contaminants in fruit and vegetable samples is becoming increasingly important due to the health hazards caused by their accumulation in human tissues.
Solid Phase Microextraction (SPME) is a very attractive extraction technique in sample preparation that results in high throughput analysis, and remarkable analytical characteristics, including linearity, reproducibility, repeatability, low and improved limits of detection and quantitation, high selectivity, sensitivity and versatility with minimum matrix interferences. It combines sampling, isolation, concentration and enrichment and sample introduction into analytical instruments in a single and uninterrupted sampling step, which results in high throughput analysis. SPME was developed to overcome the problems associated with the solvent-based, time consuming conventional techniques, which are multistep and usually require a large amount of samples and solvents that can cause environmental pollution and be hazardous to human health.
There are different parameters that influence the partitioning of the analytes between the sample matrix and the SPME fiber. When considering the optimization of parameters for fruits and vegetables analysis, the complex nature of the sample should be taken into consideration. The amount of analytes extracted from fruit and vegetable samples depend on the nature of the stationary phase (fiber) and on the properties of the sample matrix. The most important method used in the optimization of extraction parameters is the consideration of the thermodynamic and theoretical models, in the selection of a particular procedure for the development of method for the determination of pesticides in fruits and vegetable samples.
The univariate optimization of SPME parameters involves optimizing each factor one at a time, in which other factors are kept constant except for the one being optimized and it involves many experiments. This does not allow the estimation of possible interaction between the studied factors. Multivariate experimental design helps to identify the significant factors that maximize the response of an experiment. It also helps to improve the yield or chromatographic separation by optimizing the significant factors using response surface methodology or central composite design (CCD). It saves time and requires few experimental runs and can be used for quantitative modeling of mathematical relationships between factors and response. Its use is aimed to understand the effect of each factor and model the relationship between the factors and response with a minimal number of experiments carried out in an orderly and efficient manner.
In this study, a fast and robust Headspace (HS)-SPME-gas chromatography-mass spectrometry (GC-MS) method was developed for the simultaneous determination of fourteen multiclass pesticide residues in fruit and vegetable samples using Plackett-Burman (P-B) design to study the significance of various factors and its optimization using CCD.
MATERIALS AND METHODS
Reagents and Solutions
Pesticide standards (fenobucarb, ethoprop, diazinon, chlorothalonil, fenitrothion, methyl parathion, chlorpyrifos, thiobencarb, quinalphos, endosulfan I, endosulfan II, bifenthrin, fenpropathrin and permethrin) at 100 µg/mL and 1-chloro-3-nitrolbenzene (1000 µg/mL) used as internal standard with more than 95% purity, were purchased from AccuStandard Inc. New Haven CT, U.S.A. A working standard solution containing the pesticides was prepared daily by diluting the stock solution in methanol to a concentration of 10µg/mL, and kept at 40C before use. All solvents used were pesticide grade: methanol, acetone and acetonitrile were purchased from Fisher Scientific, Loughborough, U.K. Sodium chloride, sodium sulphate, ammonium chloride were purchased from Merck. The pH buffer solutions 4, 6, 8 – 10 and 5 – 7 were purchased from Fisher Scientific and Sigma-Aldrich respectively. Millipore filtered (0.45 µm) deionized water was used for method development.
Sample Preparation
For SPME method development, 100 g of pesticide free fruits and vegetables were accurately weighed, finely chopped and homogenized in a blender. A known aliquot of the homogenized sample was then weighed into a separate 20 mL amber glass vial containing the internal standard and diluted accurately with Milli-Q filtered deionized water containing 10 % of NaCl to make up a total mass of 5 g. The mixture was then spiked with a known amount of the working standard solution to prepare a concentration of 50µg/kg. The mixture was then homogenized at 3000 rpm for 5 min and subjected to SPME procedure. Fruit and vegetable samples used for method development, calibration and recovery studies were first analyzed to ensure the absence of the target pesticide residues.
HS-SPME Procedure
The SPME fibers (Supleco, Bellefonte, PA USA) were conditioned in the GC/MS injection at 250 0C for 30 min (PDMS and PDMS/DVB) and 2800C for 1 hr (PA), prior to their first use as recommended by the manufacturer. Optimization of parameters and analysis were performed in a 20 mL amber glass vial containing 5 mL of Milli-Q filtered deionized water containing 10% of NaCl and spiked with 50 µL of the working standard solution to give a concentration of 0.1µg/mL. The vial containing the sample was shaken ultrasonically for 5 min, agitated and incubated for 5 min at 600C in the autosampler agitator, followed by the exposure of the fiber to the headspace of the sample in the vial sealed with PTFE/silicone septum.
GC Condition
The extraction and analysis of pesticides were carried out with CTC CombiPAL autosampler equipped with agitator and needle heater (for fiber conditioning and inter-extraction clean up) coupled to a GC-MS (Shimadzu QP2010Series) and operated in the split/splitless mode at an injection temperature of 270 0C. The separation of target analytes was achieved on a DB-5MS fused capillary column containing 5 % diphenyl and 95 % dimethylpolysiloxane (30 m x 0.25 mm i.d. x 0.25 µm film thickness). The injection port of the GC was equipped with a high-pressure Merlin Microseal septumless injection kit and a silanized narrow bore liner (78.5 x 6.5 mm o.d x 0.75 mm i.d). Helium (carrier gas) was set to a constant flow rate of 1.3 mL/min with linear velocity of 42 cm/sec. The GC column oven temperature program was set as follows. Initially set at 600C for 2 min, ramped at 300C/min to 1800C, then ramped to 210 0C at 50C/min, and finally to 2700C held for 5 min, for a total runtime of 24.50 min. The MS operation condition includes transfer line of 300 0C, ion source of 2000C, electron ionization (EI) of 70 eV. The optimization of methods was done in scan mode while quantitation was done in selected ion monitoring (SIM) mode. A target ion (most abundance ion) and two other reference ions were monitored for the target analytes. The investigated pesticides were identified by comparing the mass spectrum obtained for each analyte to that of the reference compound in GC-MS library using the US National Institute of Standard and Technology (NIST) and PESTANA libraries search. In case of co-elution, easy spectral identification and integration was achieved by using the deconvolution feature of the GC-MS system. The P-B and the CCD matrices were performed and estimated with Minitab® statistical software package version 16 (Minitab Inc., State College, USA).
RESULTS AND DISCUSSION
Several parameters affecting the efficiency of SPME of pesticide residues in fruits and vegetables were optimized. The optimization involved a two-step design: the screening design was used to determine the significant factors and the optimization design for estimating the best experimental conditions
P-B Design
The P-B design matrix with a 27–4 (resolution III) reduced factorial was generated for the screening of the most important factors affecting the SPME efficiency and recovery of pesticide residues from fruit and vegetable samples. It contains experimental runs of a multiple of four (4, 8 , 12, 16, etc.) and the factors are one less than the number of experiments. It helps for the estimation of the significant factors affecting extraction efficiency. It does not yield the exact quantity, but provides valuable information on each variable with relatively few and reasonable experimental runs. The factors and level of variables selected for P-D design are shown in Table 1. A 27–4 P-B design matrix (Table 2), was used to run the experiment for the determination of main effects of the factors under investigation. The P-B design consists of 12 runs, conducted in duplicate, to annul the effects of extraneous variables.
The main effect of each factor was estimated using least square regression which indicates the significance in relation to the response (TCPA). In the Pareto chart (Fig 1a), the length of the bar is proportional to the absolute value of the main effect, while the vertical line indicates 95 % confidence level. The normal plot (Fig 1b) shows the significance of each factor (estimated using ANOVA test) and the magnitude of various effects, while the residual plots (Fig 1c) show that the measurement deviation is randomly distributed around the mean. The main effect plot (Fig 1d), as indicated by the slope of the plots, shows that when extraction temperature and extraction time increase from low value to high value, the extraction efficiency also increases with decrease in stirring rate and pH, while other factors such as salt addition, desorption time and desorption temperature show no significant effect. The extraction temperature is the most important factor followed by the extraction time. As can be observed from the normal plot (Fig 1b) extraction temperature and time shows positive effects, while pH and stirring rate show negative effect. Therefore, for the optimization step, all other factors were fixed, while extraction temperature, time, pH and stirring rate were considered for further optimization.
C CD
The screening experiment obtained by the use of P-B design indicates thatdesorption time, desorption temperature and salt addition do not affect extraction efficiency to a significant extent. Therefore, they were fixed according to the optimal value estimated using the univariate experiments (desorption time, 7 min; desorption temperature, 270 0C; salt addition, 10%) (Data not shown). The extraction time, extraction temperature, salt addition and pH, which are the significant variables, were further optimized by the use of second-order CCD utilizing a response surface methodology (RSM). The number of points in CCD contains a factorial run of 2k, axial runs of 2k and Co center point runs. Therefore, the total experimental runs (N) of CCD is given by: N = 2k + 2k + Co, where k and Co are the number of variables and the number of center points, respectively. In order to reduce the effect of uncontrolled variables, the CCD experiments were run in a random manner. The CCD design includes 16 cube points, 7 center points in cube, 8 axial points and 0 center point in axial with α = 2 (selected to establish rotatability conditions) and a total of 31 randomized runs. The significant variables involved in the generation of CCD, their levels and the design matrix are shown in Table 3.
The total chromatographic peak area (TCPA) corresponding to the 14 investigated pesticides for the experimental runs presented in Table 3, were used to obtain the response surface plot as shown in Fig 2. The desirability function was first fixed by assigning values of 0.0 (undesirable), 0.5 (medium desirability) and 1.0 (very desirable). The global desirability surface response in 3D plot was obtained for the optimized parameters as shown in Fig 2. The second order response is utilized because it has flexibility, the ability to give an approximation of the true value and the parameters to be easily estimated.
The surface plot (Fig 2) and response optimizer plot (Fig 3) were used to indicate the optimal conditions, and it was observed that the overall response desirability of the independent variables in the experimental domain was obtained at extraction temperature greater than or equal to 62 0C, while optimum extraction time can be for 34 min or longer, the optimum stirring rate was at 351 rpm or lower and the optimum pH was greater than or equal to 6. The result is in good agreement with the P-B design as represented by the main effect plot (Fig 5.24) where extraction efficiency is increased by increasing of extraction temperature and time while it is increased by decreasing of stirring rate and pH value. Consequently, the optimal extraction conditions are as follows: Temperature, 650C; time, 35 min; salt addition, 10 %; stirring rate, 350 rpm; pH, 6; desorption time, 7 min; desorption temperature, 270 0C. The chromatogram of the 14 investigated pesticides spiked in water sample and analyzed under the optimized conditions is shown in Fig 4. The chromatogram was integrated for each peak and the ion fragmentations obtained were compared with the NIST library (See Supplementary Information Fig S1-S15).
Validation of Analytical Figures of Merit
The validation of analytical methodology has been observed to be a quality assurance step in method development, used to confirm the method performance and its suitability for the intended purpose. In the present study, the figures of merit of analytical methodology of the developed method was validated in terms of linearity, accuracy, intra- and inter-day precisions, limits of detection (LOD) and quantification (LOQ) using the optimized HS-SPME parameters. Although, validation of figures of merit of analytical methodology has been described to be a time consuming activity, it is very essential in order to ensure optimal utilization of analytical resources.
The linearity was estimated using set of calibration curves prepared with concentrations ranging from 1 – 500 µg/kg, with an internal standard calibration method. The peak area ratio which is the ratio of the peak area of analytes to the peak area of internal standard was plotted against the concentration of analytes. As shown in Table 4, the calibration curves were linear over the tested concentration range and the correlation coefficients (r2) were greater than 0.99 for all the investigated pesticides. Table 5 shows the precisions and accuracies (relative recoveries) of the developed method in fruit and vegetable samples. The intra-day precision varies from 1.56 to 13.9 % while the intermediate precision varies from 2.4 to 14.9 %. The relative recoveries of the spiked fruit and vegetable samples range from 73.3 to 118.5 % which were acceptable according to the SANCO guideline.
The recoveries obtained in vegetable samples were slightly higher than those obtained in fruit samples, this could be attributed to the presence of suspended solid particles and high molecular mass substances such as pectin and sugar present in the fruit samples, although matrix interference were completely eliminated by appropriate dilution of the samples. It was also observed that, better recoveries and precisions were achieved at higher spiked levels. All the parameters validated in this study were based on the method validation requirements of the European Union. The LOQ (S/N =10) and LOD (S/N=3) values obtained (Table 6) are in most cases below the first calibration level and are lower than the maximum residue levels (MRL) allowed by Codex Alimentarius and the European Union. The LOD range from 0.35 to 8.33 µg/kg, while the LOQ was between 1.15 and 27.76 µg/kg.
The HS-SPME method developed in this study was subsequently applied to the analysis of apple, tomato, cucumber and cabbage samples purchased from a local Malaysian wet market. The real sample analysis was conducted in order to further verify the reliability and robustness of the developed method. A total of 220 samples were analyzed, and three samples each of tomato and cabbage were found to contain chlorothalonil, while one sample of tomato contains permethrin. One sample of apple was also found to contain chlorpyrifos, with three samples of cabbage found to contain chlorothalonil. However, all fruits and vegetables found to contain the target pesticides were far below the maximum residue levels allowed by the European Union and the Codex Alimentarius Commission. All other pesticides investigated in the selected commodities were either not detected or were detected below the limits of quantification and thus were not quantified.
The use of chemometric approach to the screening and subsequent optimization of extraction parameters has helped to reduce analysis time and also helped to determine the best optimized parameters. The combination of microextraction and chemometrics, as can be observed in this study, enhances better recoveries and precisions and also improves detectability of the target analytes as an improved method validation. Further studies should be focused on the use of sol-gel prepared, ionic liquid, supramolecular molecules and molecularly imprinted polymer coatings as the extraction phase to increase the range of analytes that can be qualitatively and quantitatively analyzed in a wide range of environmental samples.
AUTHOR INFORMATION
Corresponding Author
*Phone: +60379674247. Fax +6079674193. E mail: ghtan@um.edu.my
Funding Sources
Financial support of the University of Malaya Center for Research Management through the IPPP grant (PV09/2011A) and UMRG grant (RG227/12AFR)
Notes
The authors declare no competing financial interest.
ACKNOWLEDGMENT
The University of Malaya Research Management Center is gratefully acknowledged for the permission given to publish this research work.
ABBREVIATIONS USED
SPME, solid phase microextraction; HS, headspace; PDMS, polydimethylsiloxane,; DVB, divinylbenzene; PA, polyacrylate; GC-MS’ gas chromatography-mass spectrometry; TCPA, total chromatographic peak area; ANOVA, analysis of variance; CCD’ central composite design; RSM, response surface methodology; S/N, signal to noise ratio; SIM, selective ion monitoring; RSD, relative standard deviation
REFERENCES
IUPAC, A Vision for Chemistry for 2050. Chemistry International 2012.
Aulakh, J. S.; Malik, A. K.; Kaur, V.; Schmitt-Kopplin, P., A Review on Solid Phase Micro Extraction—High Performance Liquid Chromatography (SPME-HPLC) Analysis of Pesticides. Crit. Rev. Anal. Chem. 2005, 35 (1), 71-85.10.1080/10408340590947952
Araoud, M.; Douki, W.; Rhim, A.; Najjar, M. F.; Gazzah, N., Multiresidue analysis of pesticides in fruits and vegetables by gas chromatography-mass spectrometry. J. Environ. Sci. Heal. B 2007, 42 (2), 179-187.10.1080/03601230601123474
Chai, M. K.; Tan, G. H.; Kumari, A., Application of Solid-Phase Microextraction for the Determination of Pesticides in Vegetabble Samples by Gas Chromatography with Electron Capture Detector. Malay. J. Anal. Sci. 2008, 12 (1), 1-9
Cabras, P., Pesticides: Toxicology and Residues in Food. In Food Safety: Contaminants and Toxins, D'Mello, J. P. F., Ed. CABI Publishing: Cambridge, MA, USA, 2003; pp 91-124.
Maharaj, R., Use of Insecticides for Malaria Control and needs for Reversion of Resistance. Indian J. Med. Res. 2010, 132, 248-250
Rose, R. I., Pesticides and Public Health: Integrated Methods of Mosquito Management. Emerg. Infect. Dis. 2001, 7 (1), 17-23
WHO, Vector Control for Malaria and other Mosquito-borne Diseases. Geneva, 1995.
Lambropoulou, D. A.; Albanis, T. A., Liquid-phase micro-extraction techniques in pesticide residue analysis. J. Biochem. Biophys. Methods 2007, 70 (2), 195-228.10.1016/j.jbbm.2006.10.004
Beceiro-González, E.; González-Castro, M. J.; Muniategui-Lorenzo, S.; López-Mahía, P.; Prada-Rodríguez, D., Analytical methodology for the determination of organochlorine pesticides in vegetation. J. AOAC Int. 2012, 95 (5), 1291-1310
Cooper, J.; Dobson, H., The benefits of pesticides to mankind and the environment. Crop Prot. 2007, 26 (9), 1337-1348.10.1016/j.cropro.2007.03.022
Chai, M. K.; Tan, G. H., Headspace solid-phase microextraction for the evaluation of pesticide residue contents in cucumber and strawberry after washing treatment. Food Chem. 2010, 123 (3), 760-764.10.1016/j.foodchem.2010.05.038
Tadeo, J. L.; Pérez, R. A.; Albero, B.; García-Valcárcel, A. I.; Sánchez-Brunete, C., Review of sample preparation techniques for the analysis of pesticide residues in soil. J. AOAC Int. 2012, 95 (5), 1258-1271
Abdulra'uf, L. B.; Chai, M. K.; Tan, G. H., Applications of solid-phase microextraction for the analysis of pesticide residues in fruits and vegetables: A review. J. AOAC Int. 2012, 95 (5), 1272-1290
Tan, G. H.; Abdulra’uf, L. B., Recent Developments and Applications of Microextraction Techniques for the Analysis of Pesticide Residues in Fruits and Vegetables. In Pesticides - Strategies for Pesticides Analysis, Stoytcheva, M., Ed. InTech: 2012; pp 171-190.
Risticevic, S.; Niri, V. H.; Vuckovic, D.; Pawliszyn, J., Recent developments in solid-phase microextraction. Anal. Bioanal. Chem. 2009, 393 (3), 781-795
De Fátima Alpendurada, M., Solid-phase microextraction: A promising technique for sample preparation in environmental analysis. J. Chromatogr. A 2000, 889 (1-2), 3-14
Fytianos, K.; Drimaropoulou, G.; Raikos, N.; Theodoridis, G.; Tsoukali, H., Headspace solid-phase microextraction for the gas chromatographic analysis of organophosphorus insecticides in vegetables. J. AOAC Int. 2007, 90 (6), 1677-1681
Pawliszyn, J., Solid Phase Microextraction: Theory and Practice. VCH: New York, USA, 1997.
Picó, Y.; Fernández, M.; Ruiz, M. J.; Font, G., Current trends in solid-phase-based extraction techniques for the determination of pesticides in food and environment. J. Biochem. Biophys. Methods 2007, 70 (2), 117-131.10.1016/j.jbbm.2006.10.010
Ouyang, G.; Pawliszyn, J., A critical review in calibration methods for solid-phase microextraction. Anal. Chim. Acta 2008, 627 (2), 184-197
Risticevic, S.; Lord, H.; Górecki, T.; Arthur, C. L.; Pawliszyn, J., Protocol for solid-phase microextraction method development. Nat. Protoc. 2010, 5 (1), 122-139
Pawliszyn, J., New directions in sample preparation for analysis of organic compounds. TrAC - Trends Anal. Chem. 1995, 14 (3), 113-122
Miller, J. N.; Miller, J. C., Statistics and Chemometrics for Analytical Chemisry. 6th ed.; Pearson: Essex, England, 2010.
Brereton, R. G., Chemometrics: Data Analyiss for the Laboratory and Chemical Plants. Wiley: West Sussex, England, 2003.
Brereton, R. G., Applied Chemometrics for Scientists. Wiley: West Sussex, England, 2007.
Massart, D. L.; Vandaginste, B. G. M.; Buydens, L. M. C.; De Jong, S.; Lewi, P. J.; Smeyers-Verbeke, J., Handbook of Chemometrics and Qualimetrics: Part A. Elsevier: Amsrterderm, The Netherlands, 1997.
Cortés Aguado, S.; Sánchez‐Morito, N.; Arrebola, F. J.; Frenich, A. G.; Vidal, J. L. M., Fast screening of pesticide residues in fruit juice by solid-phase microextraction and gas chromatography-mass spectrometry. Food Chem. 2008, 107 (3), 1314-1325
Cortés Aguado, S.; Sánchez‐Morito, N.; Garrido Frenich, A.; Martínez Vidal, J. L.; Arrebola, F. J., Screening Method for the Determination at Parts Per Trillion Levels of Pesticide Residues in Vegetables Combining Solid‐Phase Microextraction and Gas Chromatography‐Tandem Mass Spectrometry. Anal. Lett. 2007, 40 (15), 2886-2914.10.1080/00032710701603934
Souza-Silva, É. A.; Lopez-Avila, V.; Pawliszyn, J., Fast and robust direct immersion solid phase microextraction coupled with gas chromatography–time-of-flight mass spectrometry method employing a matrix compatible fiber for determination of triazole fungicides in fruits. J. Chromatogr. A 2013, (0).http://dx.doi.org/10.1016/j.chroma.2013.07.071
Melo, A.; Aguiar, A.; Mansilha, C.; Pinho, O.; Ferreira, I. M. P. L. V. O., Optimisation of a solid-phase microextraction/HPLC/Diode Array method for multiple pesticide screening in lettuce. Food Chem. 2012, 130 (4), 1090-1097.10.1016/j.foodchem.2011.07.137
López, R.; Goñi, F.; Etxandia, A.; Millán, E., Determination of organochlorine pesticides and polychlorinated biphenyls in human serum using headspace solid-phase microextraction and gas chromatography-electron capture detection. J. Chromatogr. B 2007, 846 (1-2), 298-305
Khodadoust, S.; Hadjmohammadi, M., Determination of N-methylcarbamate insecticides in water samples using dispersive liquid-liquid microextraction and HPLC with the aid of experimental design and desirability function. Anal. Chim. Acta 2011, 699 (1), 113-119
Stalikas, C.; Fiamegos, Y.; Sakkas, V.; Albanis, T., Developments on chemometric approaches to optimize and evaluate microextraction. J. Chromatogr. A 2009, 1216 (2), 175-189
Stoyanov, K. S.; Walmsley, A. D., Response Surface Modelling and Experimental Designs. In Practical Guide to Chemometrics, 2nd ed.; Gemperline, P., Ed. Taylor and Francis: Boca Raton, FL, USA, 2006.
Myers, R. H.; Montgomery, D. C.; Anderson-Cook, C. M., Response Surface Methodology: Process and Product Optimization using Designed Experiments. 3rd ed.; Wiley: USA, 2009.
Thompson, M.; Ellison, S. L. R.; Wood, R., Harmonized Guides for Single-Laboratory Validation of Method of Analysis. Pure Appl. Chem. 2002, 74 (5), 835-855
Chan, C. C., Analytical Method Validation: Principlea and Practices. In Pharmaceutical Manufacturing Handbook: Regulations and Quality, Gad, S. C., Ed. John Wiley: Hoboken, NJ, 2008; pp 727-742.
Chan, C. C., Principles and Practices of Analytical Method Validation: Validation of Analytical Methods is Time‐consuming but Essential. Qual. Assur. J. 2011, 14, 61-64
SANCO, Method Validation and Quality Control Procedures for Pesticide Residues Analysis in Food and Feed; SANCO/12495/2011. EU, Ed. 2011.
Simplício, A. L.; Vilas Boas, L., Validation of a solid-phase microextraction method for the determination of organophosphorus pesticides in fruits and fruit juice. J. Chromatogr. A 1999, 833 (1), 35-42
Lambropoulou, D. A.; Albanis, T. A., Headspace solid-phase microextraction in combination with gas chromatography-mass spectrometry for the rapid screening of organophosphorus insecticide residues in strawberries and cherries. J. Chromatogr. A 2003, 993 (1-2), 197-203
Sang, Z. Y.; Wang, Y. T.; Tsoi, Y. K.; Leung, K. S. Y., CODEX-compliant eleven organophosphorus pesticides screening in multiple commodities using headspace-solid phase microextraction-gas chromatography-mass spectrometry. Food Chem. 2013, 136 (2), 710-717
EU, Regulation (EC) No 396/2005. In EU Pesticide Database, 2005.
Zhang, Z.; Yang, M. J.; Pawliszyn, J., Solid-phase microextraction. Anal. Chem. 1994, 66 (17), 844A-853A
Table 1. Factors and levels of variables
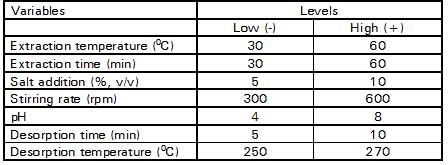
Table 2. Plackett-Burman design matrixa
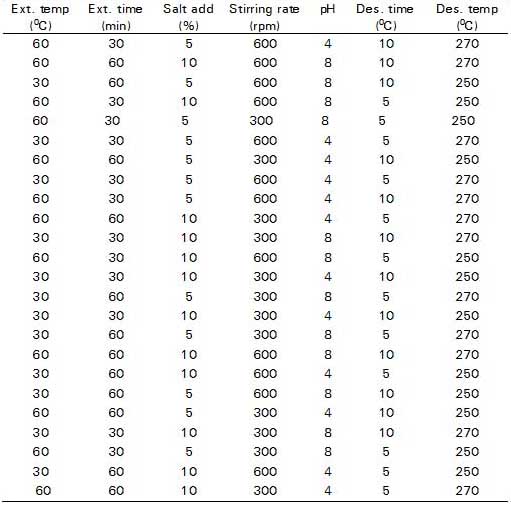
a Generated using Minitab® statistical software
Table 3. Factors, levels and CCD design matrix
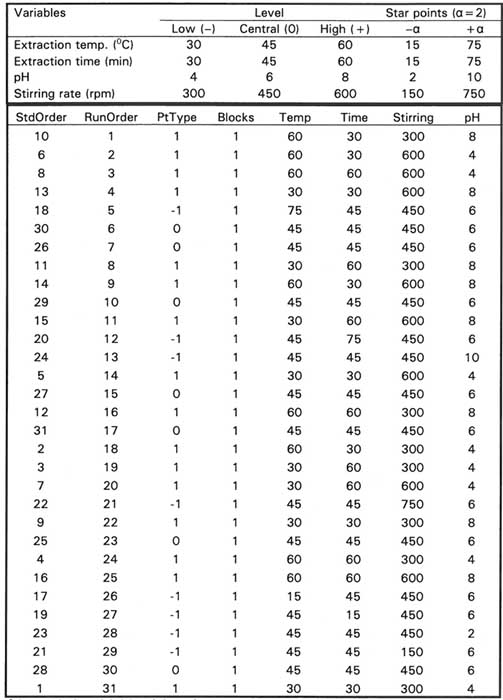
a Generated using Minitab® statistical software
Table 6. Figures of Merit of the Developed Method
Fig 1. Plackett-Burman design plot (a) Pareto chart of standardized main effect (b) Normal plot of standardized main effect (c) Main effect plot (d) Residual plot
Fig 2. Desirability response surface plot from CCD design (Ext. temp vs. Ext. time)
Fig 3. Response optimizer for optimized parameters
Fig 4. GC-MS Chromatogram of Aqueous Sample spiked at 50 µg/kg; 1. I.S (Internal Standard; 2. Fenobucarb;3. Ethoprophos; 4. Diaxinon; 5. Chlorothalonil; 6. Parathion Methyl; 7. Fenitrothion; 8. Chlropyrifos; 9. Thiobencarb; 10. Quinalphos; 11. Endosulfan I; 12. Endosulfan II; 13. Bifenthrin; 14. Fenpropathrin; 15. Permethrin

Chemometric Approach to the Optimization of HS-SPME/GC-MS for the Determination of Multiclass Pesticide Residues in Fruits and Vegetables
ABSTRACT
A Headspace Solid Phase Microextraction (HS-SPME) method was developed using multivariate experimental designs, which was conducted in two stages. The significance of each factor was estimated using the Plackett-Burman (P-B) design, for the identification of significant factors, followed by the optimization of the significant factors using central composite design (CCD). The multivariate experiment involved the use of Minitab® statistical software for the generation of a 27-4 P-B design and CCD matrices. The method performance evaluated with internal standard calibration method produced good analytical figures of merit with linearity ranging from 1 – 500 µg/kg with correlation coefficient greater than 0.99; limit of detection (LOD) and limit of quantification (LOQ) were found between 0.35 and 8.33 µg/kg and 1.15 and 27.76 µg/kg, respectively. The average recovery was between 73 % and 118 % with relative standard deviation (RSD = 1.5 – 14 %) for all the investigated pesticides. The multivariate method helps to reduce sampling time and improve analytical throughput.
Kewords: GC-MS, SPME, multivariate design, central composite design, pesticide residues, fruits and vegetables
INTRODUCTION
An estimate of 1 billion people went hungry in 2010, and with the ever increasing world population, there is need for 70% increase in global food production by the year 2050. The increase in world population which has led to drastic increase in demand for food supply has also led to immeasurable rise in the application of chemical pesticides and fertilizers. To increase agricultural production and meet the growing demand for food, pesticides are used for control of pest and vector of plant diseases. Pesticides are also used in non-agricultural activities to control and eradicate carriers of vector borne diseases, such as malaria, yellow fever, typhoid fever and dengue, which are major public health concerns. The production and applications of pesticides in agriculture and non-agricultural purposes have led to steady increase in food production, high food quality and reduced incidence of illness due to insect-borne diseases. However, their continuous use has negative impact on the environment and their presence in soil, air, water and food poses a potential health risk due to their biocide activity. Therefore, pesticides must be used efficiently and effectively in order to strike a balance between their expected benefits and the possible risk to human health. This will enable their economic viability and environmental sustainability.
Although the use of pesticides has helped to increase food production, there is need to strike balance between the expected benefit and the possible risks to human health. Therefore, there is an urgent need for quality control monitoring of the use of such pesticides on fruits and vegetables for safety purposes. Analytical study is undertaken in order to obtain information on the quality and quantity of contaminants present in the sample. The extraction and subsequent analysis of pesticide residues and other contaminants in fruit and vegetable samples is becoming increasingly important due to the health hazards caused by their accumulation in human tissues.
Solid Phase Microextraction (SPME) is a very attractive extraction technique in sample preparation that results in high throughput analysis, and remarkable analytical characteristics, including linearity, reproducibility, repeatability, low and improved limits of detection and quantitation, high selectivity, sensitivity and versatility with minimum matrix interferences. It combines sampling, isolation, concentration and enrichment and sample introduction into analytical instruments in a single and uninterrupted sampling step, which results in high throughput analysis. SPME was developed to overcome the problems associated with the solvent-based, time consuming conventional techniques, which are multistep and usually require a large amount of samples and solvents that can cause environmental pollution and be hazardous to human health.
There are different parameters that influence the partitioning of the analytes between the sample matrix and the SPME fiber. When considering the optimization of parameters for fruits and vegetables analysis, the complex nature of the sample should be taken into consideration. The amount of analytes extracted from fruit and vegetable samples depend on the nature of the stationary phase (fiber) and on the properties of the sample matrix. The most important method used in the optimization of extraction parameters is the consideration of the thermodynamic and theoretical models, in the selection of a particular procedure for the development of method for the determination of pesticides in fruits and vegetable samples.
The univariate optimization of SPME parameters involves optimizing each factor one at a time, in which other factors are kept constant except for the one being optimized and it involves many experiments. This does not allow the estimation of possible interaction between the studied factors. Multivariate experimental design helps to identify the significant factors that maximize the response of an experiment. It also helps to improve the yield or chromatographic separation by optimizing the significant factors using response surface methodology or central composite design (CCD). It saves time and requires few experimental runs and can be used for quantitative modeling of mathematical relationships between factors and response. Its use is aimed to understand the effect of each factor and model the relationship between the factors and response with a minimal number of experiments carried out in an orderly and efficient manner.
In this study, a fast and robust Headspace (HS)-SPME-gas chromatography-mass spectrometry (GC-MS) method was developed for the simultaneous determination of fourteen multiclass pesticide residues in fruit and vegetable samples using Plackett-Burman (P-B) design to study the significance of various factors and its optimization using CCD.
MATERIALS AND METHODS
Reagents and Solutions
Pesticide standards (fenobucarb, ethoprop, diazinon, chlorothalonil, fenitrothion, methyl parathion, chlorpyrifos, thiobencarb, quinalphos, endosulfan I, endosulfan II, bifenthrin, fenpropathrin and permethrin) at 100 µg/mL and 1-chloro-3-nitrolbenzene (1000 µg/mL) used as internal standard with more than 95% purity, were purchased from AccuStandard Inc. New Haven CT, U.S.A. A working standard solution containing the pesticides was prepared daily by diluting the stock solution in methanol to a concentration of 10µg/mL, and kept at 40C before use. All solvents used were pesticide grade: methanol, acetone and acetonitrile were purchased from Fisher Scientific, Loughborough, U.K. Sodium chloride, sodium sulphate, ammonium chloride were purchased from Merck. The pH buffer solutions 4, 6, 8 – 10 and 5 – 7 were purchased from Fisher Scientific and Sigma-Aldrich respectively. Millipore filtered (0.45 µm) deionized water was used for method development.
Sample Preparation
For SPME method development, 100 g of pesticide free fruits and vegetables were accurately weighed, finely chopped and homogenized in a blender. A known aliquot of the homogenized sample was then weighed into a separate 20 mL amber glass vial containing the internal standard and diluted accurately with Milli-Q filtered deionized water containing 10 % of NaCl to make up a total mass of 5 g. The mixture was then spiked with a known amount of the working standard solution to prepare a concentration of 50µg/kg. The mixture was then homogenized at 3000 rpm for 5 min and subjected to SPME procedure. Fruit and vegetable samples used for method development, calibration and recovery studies were first analyzed to ensure the absence of the target pesticide residues.
HS-SPME Procedure
The SPME fibers (Supleco, Bellefonte, PA USA) were conditioned in the GC/MS injection at 250 0C for 30 min (PDMS and PDMS/DVB) and 2800C for 1 hr (PA), prior to their first use as recommended by the manufacturer. Optimization of parameters and analysis were performed in a 20 mL amber glass vial containing 5 mL of Milli-Q filtered deionized water containing 10% of NaCl and spiked with 50 µL of the working standard solution to give a concentration of 0.1µg/mL. The vial containing the sample was shaken ultrasonically for 5 min, agitated and incubated for 5 min at 600C in the autosampler agitator, followed by the exposure of the fiber to the headspace of the sample in the vial sealed with PTFE/silicone septum.
GC Condition
The extraction and analysis of pesticides were carried out with CTC CombiPAL autosampler equipped with agitator and needle heater (for fiber conditioning and inter-extraction clean up) coupled to a GC-MS (Shimadzu QP2010Series) and operated in the split/splitless mode at an injection temperature of 270 0C. The separation of target analytes was achieved on a DB-5MS fused capillary column containing 5 % diphenyl and 95 % dimethylpolysiloxane (30 m x 0.25 mm i.d. x 0.25 µm film thickness). The injection port of the GC was equipped with a high-pressure Merlin Microseal septumless injection kit and a silanized narrow bore liner (78.5 x 6.5 mm o.d x 0.75 mm i.d). Helium (carrier gas) was set to a constant flow rate of 1.3 mL/min with linear velocity of 42 cm/sec. The GC column oven temperature program was set as follows. Initially set at 600C for 2 min, ramped at 300C/min to 1800C, then ramped to 210 0C at 50C/min, and finally to 2700C held for 5 min, for a total runtime of 24.50 min. The MS operation condition includes transfer line of 300 0C, ion source of 2000C, electron ionization (EI) of 70 eV. The optimization of methods was done in scan mode while quantitation was done in selected ion monitoring (SIM) mode. A target ion (most abundance ion) and two other reference ions were monitored for the target analytes. The investigated pesticides were identified by comparing the mass spectrum obtained for each analyte to that of the reference compound in GC-MS library using the US National Institute of Standard and Technology (NIST) and PESTANA libraries search. In case of co-elution, easy spectral identification and integration was achieved by using the deconvolution feature of the GC-MS system. The P-B and the CCD matrices were performed and estimated with Minitab® statistical software package version 16 (Minitab Inc., State College, USA).
RESULTS AND DISCUSSION
Several parameters affecting the efficiency of SPME of pesticide residues in fruits and vegetables were optimized. The optimization involved a two-step design: the screening design was used to determine the significant factors and the optimization design for estimating the best experimental conditions
P-B Design
The P-B design matrix with a 27–4 (resolution III) reduced factorial was generated for the screening of the most important factors affecting the SPME efficiency and recovery of pesticide residues from fruit and vegetable samples. It contains experimental runs of a multiple of four (4, 8 , 12, 16, etc.) and the factors are one less than the number of experiments. It helps for the estimation of the significant factors affecting extraction efficiency. It does not yield the exact quantity, but provides valuable information on each variable with relatively few and reasonable experimental runs. The factors and level of variables selected for P-D design are shown in Table 1. A 27–4 P-B design matrix (Table 2), was used to run the experiment for the determination of main effects of the factors under investigation. The P-B design consists of 12 runs, conducted in duplicate, to annul the effects of extraneous variables.
The main effect of each factor was estimated using least square regression which indicates the significance in relation to the response (TCPA). In the Pareto chart (Fig 1a), the length of the bar is proportional to the absolute value of the main effect, while the vertical line indicates 95 % confidence level. The normal plot (Fig 1b) shows the significance of each factor (estimated using ANOVA test) and the magnitude of various effects, while the residual plots (Fig 1c) show that the measurement deviation is randomly distributed around the mean. The main effect plot (Fig 1d), as indicated by the slope of the plots, shows that when extraction temperature and extraction time increase from low value to high value, the extraction efficiency also increases with decrease in stirring rate and pH, while other factors such as salt addition, desorption time and desorption temperature show no significant effect. The extraction temperature is the most important factor followed by the extraction time. As can be observed from the normal plot (Fig 1b) extraction temperature and time shows positive effects, while pH and stirring rate show negative effect. Therefore, for the optimization step, all other factors were fixed, while extraction temperature, time, pH and stirring rate were considered for further optimization.
C CD
The screening experiment obtained by the use of P-B design indicates thatdesorption time, desorption temperature and salt addition do not affect extraction efficiency to a significant extent. Therefore, they were fixed according to the optimal value estimated using the univariate experiments (desorption time, 7 min; desorption temperature, 270 0C; salt addition, 10%) (Data not shown). The extraction time, extraction temperature, salt addition and pH, which are the significant variables, were further optimized by the use of second-order CCD utilizing a response surface methodology (RSM). The number of points in CCD contains a factorial run of 2k, axial runs of 2k and Co center point runs. Therefore, the total experimental runs (N) of CCD is given by: N = 2k + 2k + Co, where k and Co are the number of variables and the number of center points, respectively. In order to reduce the effect of uncontrolled variables, the CCD experiments were run in a random manner. The CCD design includes 16 cube points, 7 center points in cube, 8 axial points and 0 center point in axial with α = 2 (selected to establish rotatability conditions) and a total of 31 randomized runs. The significant variables involved in the generation of CCD, their levels and the design matrix are shown in Table 3.
The total chromatographic peak area (TCPA) corresponding to the 14 investigated pesticides for the experimental runs presented in Table 3, were used to obtain the response surface plot as shown in Fig 2. The desirability function was first fixed by assigning values of 0.0 (undesirable), 0.5 (medium desirability) and 1.0 (very desirable). The global desirability surface response in 3D plot was obtained for the optimized parameters as shown in Fig 2. The second order response is utilized because it has flexibility, the ability to give an approximation of the true value and the parameters to be easily estimated.
The surface plot (Fig 2) and response optimizer plot (Fig 3) were used to indicate the optimal conditions, and it was observed that the overall response desirability of the independent variables in the experimental domain was obtained at extraction temperature greater than or equal to 62 0C, while optimum extraction time can be for 34 min or longer, the optimum stirring rate was at 351 rpm or lower and the optimum pH was greater than or equal to 6. The result is in good agreement with the P-B design as represented by the main effect plot (Fig 5.24) where extraction efficiency is increased by increasing of extraction temperature and time while it is increased by decreasing of stirring rate and pH value. Consequently, the optimal extraction conditions are as follows: Temperature, 650C; time, 35 min; salt addition, 10 %; stirring rate, 350 rpm; pH, 6; desorption time, 7 min; desorption temperature, 270 0C. The chromatogram of the 14 investigated pesticides spiked in water sample and analyzed under the optimized conditions is shown in Fig 4. The chromatogram was integrated for each peak and the ion fragmentations obtained were compared with the NIST library (See Supplementary Information Fig S1-S15).
Validation of Analytical Figures of Merit
The validation of analytical methodology has been observed to be a quality assurance step in method development, used to confirm the method performance and its suitability for the intended purpose. In the present study, the figures of merit of analytical methodology of the developed method was validated in terms of linearity, accuracy, intra- and inter-day precisions, limits of detection (LOD) and quantification (LOQ) using the optimized HS-SPME parameters. Although, validation of figures of merit of analytical methodology has been described to be a time consuming activity, it is very essential in order to ensure optimal utilization of analytical resources.
The linearity was estimated using set of calibration curves prepared with concentrations ranging from 1 – 500 µg/kg, with an internal standard calibration method. The peak area ratio which is the ratio of the peak area of analytes to the peak area of internal standard was plotted against the concentration of analytes. As shown in Table 4, the calibration curves were linear over the tested concentration range and the correlation coefficients (r2) were greater than 0.99 for all the investigated pesticides. Table 5 shows the precisions and accuracies (relative recoveries) of the developed method in fruit and vegetable samples. The intra-day precision varies from 1.56 to 13.9 % while the intermediate precision varies from 2.4 to 14.9 %. The relative recoveries of the spiked fruit and vegetable samples range from 73.3 to 118.5 % which were acceptable according to the SANCO guideline.
The recoveries obtained in vegetable samples were slightly higher than those obtained in fruit samples, this could be attributed to the presence of suspended solid particles and high molecular mass substances such as pectin and sugar present in the fruit samples, although matrix interference were completely eliminated by appropriate dilution of the samples. It was also observed that, better recoveries and precisions were achieved at higher spiked levels. All the parameters validated in this study were based on the method validation requirements of the European Union. The LOQ (S/N =10) and LOD (S/N=3) values obtained (Table 6) are in most cases below the first calibration level and are lower than the maximum residue levels (MRL) allowed by Codex Alimentarius and the European Union. The LOD range from 0.35 to 8.33 µg/kg, while the LOQ was between 1.15 and 27.76 µg/kg.
The HS-SPME method developed in this study was subsequently applied to the analysis of apple, tomato, cucumber and cabbage samples purchased from a local Malaysian wet market. The real sample analysis was conducted in order to further verify the reliability and robustness of the developed method. A total of 220 samples were analyzed, and three samples each of tomato and cabbage were found to contain chlorothalonil, while one sample of tomato contains permethrin. One sample of apple was also found to contain chlorpyrifos, with three samples of cabbage found to contain chlorothalonil. However, all fruits and vegetables found to contain the target pesticides were far below the maximum residue levels allowed by the European Union and the Codex Alimentarius Commission. All other pesticides investigated in the selected commodities were either not detected or were detected below the limits of quantification and thus were not quantified.
The use of chemometric approach to the screening and subsequent optimization of extraction parameters has helped to reduce analysis time and also helped to determine the best optimized parameters. The combination of microextraction and chemometrics, as can be observed in this study, enhances better recoveries and precisions and also improves detectability of the target analytes as an improved method validation. Further studies should be focused on the use of sol-gel prepared, ionic liquid, supramolecular molecules and molecularly imprinted polymer coatings as the extraction phase to increase the range of analytes that can be qualitatively and quantitatively analyzed in a wide range of environmental samples.
AUTHOR INFORMATION
Corresponding Author
*Phone: +60379674247. Fax +6079674193. E mail: ghtan@um.edu.my
Funding Sources
Financial support of the University of Malaya Center for Research Management through the IPPP grant (PV09/2011A) and UMRG grant (RG227/12AFR)
Notes
The authors declare no competing financial interest.
ACKNOWLEDGMENT
The University of Malaya Research Management Center is gratefully acknowledged for the permission given to publish this research work.
ABBREVIATIONS USED
SPME, solid phase microextraction; HS, headspace; PDMS, polydimethylsiloxane,; DVB, divinylbenzene; PA, polyacrylate; GC-MS’ gas chromatography-mass spectrometry; TCPA, total chromatographic peak area; ANOVA, analysis of variance; CCD’ central composite design; RSM, response surface methodology; S/N, signal to noise ratio; SIM, selective ion monitoring; RSD, relative standard deviation
REFERENCES
IUPAC, A Vision for Chemistry for 2050. Chemistry International 2012.
Aulakh, J. S.; Malik, A. K.; Kaur, V.; Schmitt-Kopplin, P., A Review on Solid Phase Micro Extraction—High Performance Liquid Chromatography (SPME-HPLC) Analysis of Pesticides. Crit. Rev. Anal. Chem. 2005, 35 (1), 71-85.10.1080/10408340590947952
Araoud, M.; Douki, W.; Rhim, A.; Najjar, M. F.; Gazzah, N., Multiresidue analysis of pesticides in fruits and vegetables by gas chromatography-mass spectrometry. J. Environ. Sci. Heal. B 2007, 42 (2), 179-187.10.1080/03601230601123474
Chai, M. K.; Tan, G. H.; Kumari, A., Application of Solid-Phase Microextraction for the Determination of Pesticides in Vegetabble Samples by Gas Chromatography with Electron Capture Detector. Malay. J. Anal. Sci. 2008, 12 (1), 1-9
Cabras, P., Pesticides: Toxicology and Residues in Food. In Food Safety: Contaminants and Toxins, D'Mello, J. P. F., Ed. CABI Publishing: Cambridge, MA, USA, 2003; pp 91-124.
Maharaj, R., Use of Insecticides for Malaria Control and needs for Reversion of Resistance. Indian J. Med. Res. 2010, 132, 248-250
Rose, R. I., Pesticides and Public Health: Integrated Methods of Mosquito Management. Emerg. Infect. Dis. 2001, 7 (1), 17-23
WHO, Vector Control for Malaria and other Mosquito-borne Diseases. Geneva, 1995.
Lambropoulou, D. A.; Albanis, T. A., Liquid-phase micro-extraction techniques in pesticide residue analysis. J. Biochem. Biophys. Methods 2007, 70 (2), 195-228.10.1016/j.jbbm.2006.10.004
Beceiro-González, E.; González-Castro, M. J.; Muniategui-Lorenzo, S.; López-Mahía, P.; Prada-Rodríguez, D., Analytical methodology for the determination of organochlorine pesticides in vegetation. J. AOAC Int. 2012, 95 (5), 1291-1310
Cooper, J.; Dobson, H., The benefits of pesticides to mankind and the environment. Crop Prot. 2007, 26 (9), 1337-1348.10.1016/j.cropro.2007.03.022
Chai, M. K.; Tan, G. H., Headspace solid-phase microextraction for the evaluation of pesticide residue contents in cucumber and strawberry after washing treatment. Food Chem. 2010, 123 (3), 760-764.10.1016/j.foodchem.2010.05.038
Tadeo, J. L.; Pérez, R. A.; Albero, B.; García-Valcárcel, A. I.; Sánchez-Brunete, C., Review of sample preparation techniques for the analysis of pesticide residues in soil. J. AOAC Int. 2012, 95 (5), 1258-1271
Abdulra'uf, L. B.; Chai, M. K.; Tan, G. H., Applications of solid-phase microextraction for the analysis of pesticide residues in fruits and vegetables: A review. J. AOAC Int. 2012, 95 (5), 1272-1290
Tan, G. H.; Abdulra’uf, L. B., Recent Developments and Applications of Microextraction Techniques for the Analysis of Pesticide Residues in Fruits and Vegetables. In Pesticides - Strategies for Pesticides Analysis, Stoytcheva, M., Ed. InTech: 2012; pp 171-190.
Risticevic, S.; Niri, V. H.; Vuckovic, D.; Pawliszyn, J., Recent developments in solid-phase microextraction. Anal. Bioanal. Chem. 2009, 393 (3), 781-795
De Fátima Alpendurada, M., Solid-phase microextraction: A promising technique for sample preparation in environmental analysis. J. Chromatogr. A 2000, 889 (1-2), 3-14
Fytianos, K.; Drimaropoulou, G.; Raikos, N.; Theodoridis, G.; Tsoukali, H., Headspace solid-phase microextraction for the gas chromatographic analysis of organophosphorus insecticides in vegetables. J. AOAC Int. 2007, 90 (6), 1677-1681
Pawliszyn, J., Solid Phase Microextraction: Theory and Practice. VCH: New York, USA, 1997.
Picó, Y.; Fernández, M.; Ruiz, M. J.; Font, G., Current trends in solid-phase-based extraction techniques for the determination of pesticides in food and environment. J. Biochem. Biophys. Methods 2007, 70 (2), 117-131.10.1016/j.jbbm.2006.10.010
Ouyang, G.; Pawliszyn, J., A critical review in calibration methods for solid-phase microextraction. Anal. Chim. Acta 2008, 627 (2), 184-197
Risticevic, S.; Lord, H.; Górecki, T.; Arthur, C. L.; Pawliszyn, J., Protocol for solid-phase microextraction method development. Nat. Protoc. 2010, 5 (1), 122-139
Pawliszyn, J., New directions in sample preparation for analysis of organic compounds. TrAC - Trends Anal. Chem. 1995, 14 (3), 113-122
Miller, J. N.; Miller, J. C., Statistics and Chemometrics for Analytical Chemisry. 6th ed.; Pearson: Essex, England, 2010.
Brereton, R. G., Chemometrics: Data Analyiss for the Laboratory and Chemical Plants. Wiley: West Sussex, England, 2003.
Brereton, R. G., Applied Chemometrics for Scientists. Wiley: West Sussex, England, 2007.
Massart, D. L.; Vandaginste, B. G. M.; Buydens, L. M. C.; De Jong, S.; Lewi, P. J.; Smeyers-Verbeke, J., Handbook of Chemometrics and Qualimetrics: Part A. Elsevier: Amsrterderm, The Netherlands, 1997.
Cortés Aguado, S.; Sánchez‐Morito, N.; Arrebola, F. J.; Frenich, A. G.; Vidal, J. L. M., Fast screening of pesticide residues in fruit juice by solid-phase microextraction and gas chromatography-mass spectrometry. Food Chem. 2008, 107 (3), 1314-1325
Cortés Aguado, S.; Sánchez‐Morito, N.; Garrido Frenich, A.; Martínez Vidal, J. L.; Arrebola, F. J., Screening Method for the Determination at Parts Per Trillion Levels of Pesticide Residues in Vegetables Combining Solid‐Phase Microextraction and Gas Chromatography‐Tandem Mass Spectrometry. Anal. Lett. 2007, 40 (15), 2886-2914.10.1080/00032710701603934
Souza-Silva, É. A.; Lopez-Avila, V.; Pawliszyn, J., Fast and robust direct immersion solid phase microextraction coupled with gas chromatography–time-of-flight mass spectrometry method employing a matrix compatible fiber for determination of triazole fungicides in fruits. J. Chromatogr. A 2013, (0).http://dx.doi.org/10.1016/j.chroma.2013.07.071
Melo, A.; Aguiar, A.; Mansilha, C.; Pinho, O.; Ferreira, I. M. P. L. V. O., Optimisation of a solid-phase microextraction/HPLC/Diode Array method for multiple pesticide screening in lettuce. Food Chem. 2012, 130 (4), 1090-1097.10.1016/j.foodchem.2011.07.137
López, R.; Goñi, F.; Etxandia, A.; Millán, E., Determination of organochlorine pesticides and polychlorinated biphenyls in human serum using headspace solid-phase microextraction and gas chromatography-electron capture detection. J. Chromatogr. B 2007, 846 (1-2), 298-305
Khodadoust, S.; Hadjmohammadi, M., Determination of N-methylcarbamate insecticides in water samples using dispersive liquid-liquid microextraction and HPLC with the aid of experimental design and desirability function. Anal. Chim. Acta 2011, 699 (1), 113-119
Stalikas, C.; Fiamegos, Y.; Sakkas, V.; Albanis, T., Developments on chemometric approaches to optimize and evaluate microextraction. J. Chromatogr. A 2009, 1216 (2), 175-189
Stoyanov, K. S.; Walmsley, A. D., Response Surface Modelling and Experimental Designs. In Practical Guide to Chemometrics, 2nd ed.; Gemperline, P., Ed. Taylor and Francis: Boca Raton, FL, USA, 2006.
Myers, R. H.; Montgomery, D. C.; Anderson-Cook, C. M., Response Surface Methodology: Process and Product Optimization using Designed Experiments. 3rd ed.; Wiley: USA, 2009.
Thompson, M.; Ellison, S. L. R.; Wood, R., Harmonized Guides for Single-Laboratory Validation of Method of Analysis. Pure Appl. Chem. 2002, 74 (5), 835-855
Chan, C. C., Analytical Method Validation: Principlea and Practices. In Pharmaceutical Manufacturing Handbook: Regulations and Quality, Gad, S. C., Ed. John Wiley: Hoboken, NJ, 2008; pp 727-742.
Chan, C. C., Principles and Practices of Analytical Method Validation: Validation of Analytical Methods is Time‐consuming but Essential. Qual. Assur. J. 2011, 14, 61-64
SANCO, Method Validation and Quality Control Procedures for Pesticide Residues Analysis in Food and Feed; SANCO/12495/2011. EU, Ed. 2011.
Simplício, A. L.; Vilas Boas, L., Validation of a solid-phase microextraction method for the determination of organophosphorus pesticides in fruits and fruit juice. J. Chromatogr. A 1999, 833 (1), 35-42
Lambropoulou, D. A.; Albanis, T. A., Headspace solid-phase microextraction in combination with gas chromatography-mass spectrometry for the rapid screening of organophosphorus insecticide residues in strawberries and cherries. J. Chromatogr. A 2003, 993 (1-2), 197-203
Sang, Z. Y.; Wang, Y. T.; Tsoi, Y. K.; Leung, K. S. Y., CODEX-compliant eleven organophosphorus pesticides screening in multiple commodities using headspace-solid phase microextraction-gas chromatography-mass spectrometry. Food Chem. 2013, 136 (2), 710-717
EU, Regulation (EC) No 396/2005. In EU Pesticide Database, 2005.
Zhang, Z.; Yang, M. J.; Pawliszyn, J., Solid-phase microextraction. Anal. Chem. 1994, 66 (17), 844A-853A
Table 1. Factors and levels of variables
Table 2. Plackett-Burman design matrixa
a Generated using Minitab® statistical software
Table 3. Factors, levels and CCD design matrix
a Generated using Minitab® statistical software
Table 4. Linearity range (µg/kg) of the developed HS-SPME method
Table 5. Accuracy, intra- and inter-day precisions of the pesticides in fruit and vegetable samples
Table 5. Accuracy, intra- and inter-day precisions of the pesticides in fruit and vegetable samples (cont’d)
Table 6. Figures of Merit of the Developed Method
Fig 1. Plackett-Burman design plot (a) Pareto chart of standardized main effect (b) Normal plot of standardized main effect (c) Main effect plot (d) Residual plot
Fig 2. Desirability response surface plot from CCD design (Ext. temp vs. Ext. time)
Fig 3. Response optimizer for optimized parameters
Fig 4. GC-MS Chromatogram of Aqueous Sample spiked at 50 µg/kg; 1. I.S (Internal Standard; 2. Fenobucarb;3. Ethoprophos; 4. Diaxinon; 5. Chlorothalonil; 6. Parathion Methyl; 7. Fenitrothion; 8. Chlropyrifos; 9. Thiobencarb; 10. Quinalphos; 11. Endosulfan I; 12. Endosulfan II; 13. Bifenthrin; 14. Fenpropathrin; 15. Permethrin
TOC Graphic
Reprinted (adapted) with permission from (45). Copyright (1994) American Chemical Society