ABSTRACT
High-resolution mass spectrometry (HRMS)-based non-targeted metabolomic analysis is a new technology used for unbiased collections of food chemical data in food safety inspections involving unexpected factors. HRMS with high resolving power and high mass spectral accuracy allows screening of unknown and suspected analytes without reference standards. Its reliable identification is due to increased selectivity against the food matrix background and thus it assigns to correct molecular formula of unknown compounds. To introduce the concept and framework of non-target analysis, we reviewed recent researches involving screening and identification of chemical contaminant in foods and water by liquid chromatography (LC)-HRMS. These results indicate that this new detection technique can be used as an early warning system before running thorough sample analysis for scrutiny.
Keywords: Non-Target Analysis, High-Resolution Mass Spectrometry, Mass Accuracy
Introduction
As the last defense line in food safety evaluation, food inspection and analysis usually target on specified pesticides, veterinary drugs, and food additives, etc. The problem of these target specified tests is not being able to detect any chemicals which are not defined in the initial settings. For examples, incidents of China’s melamine adulterant in milk; illegal dye used in tofu products and olive oil; phthalate plasticizer added in drinks, jam, jelly, and capsule food in Taiwan. Nowadays, the international trend is towards to identify emerging food safety issues at their early stages through non-targeted monitoring analysis technology.
The comparison of the systematic workflows for target and non-target analysis (includes suspect and unknown screening) is shown in Fig 1. Target analysis is conventional analysis based on establishing a specified method with standards, i.e. interested analytes, prior to analysis and monitoring real samples. Compounds are characterized during method development, and information (retention time, characteristic fragmentation and their ratios) is obtained for further identification and quantitation of these compounds in real samples. Mass spectrometer with triple quadrupole (QqQ) technology is useful analyzer for target analysis, due to their high specificity in multiple reaction-monitoring (MRM) mode and their low limit of detection (LOD). In contrast to target analysis, non-target analysis starts without any a priori information on the compounds to be detected and uses general method.
To meet the challenges of analyzing unexpected compounds at low concentrations in complex matrices, a range of different LC-MS technologies have been bring up in recent years. Moreover, since sample preparation for non-target analysis is often non-selective and chromatographic resolution in LC is limited, mass-resolving power (R; defined at full width at half maximum, FWHM) plays the key role. High resolution mass spectrometry (HRMS) with high mass accuracy and resolving power has emerged as a powerful tool for non-targeted analysis. Selectivity in HRMS-based extracted-ion chromatograms is obtained by using narrow mass-extraction windows (MEWs). About the R of HRMS, EU defines it as 20,000 FWHM (2002/657/EC, EU/589/2014, SANCO/12571/2013) while World Anti-Doping Agency (WADA) defines it as 10,000 FWHM. As carrying out an experiment, the resolving power selected depends on the ratio of the analyte concentration relative to co-eluting matrix interferences and the sample preparation before LC-MS analysis. With straightforward generic extraction procedures, typically used in broad screening methods, a first evaluation shows that a resolving power of 7,000–10,000 can be sufficient for detection of analytes in samples of intermediate complexity, at levels down to 25 ng/g, with mass errors below 5 ppm (Kellmann et al. 2009). For consistent and reliable mass assignment (<2 ppm) of analytes at low levels in complex matrices, a high resolving power (≧50,000) was found to be required (Kellmann et al. 2009; Nielen et al. 2007; van der Heeft et al. 2009). Krauss et al. (2010)overviewed commercially available mass spectrometers and showed that Orbitrap is increasingly applied due to the combination of high R (up to 100,000), high mass accuracy (<2 ppm), and a sensitivity down to the femtogram range. Moreover, in Orbitrap instruments different resolving-power settings can be chosen, involving a trade-off in data-acquisition rate at increased resolving power (e.g., 12 Hz at 17,500 FWHM and 1 Hz at 140,000 FWHM).
A major advantage of LC-HRMS is the possibility of retrospective analysis of full-scan data, which enables laboratories to search for new contaminants years after data recording. Other advantages of these instruments are the possibility for a posteriori analysis and their usefulness in identifying unknown compounds. Moreover, full scan HRMS data can also be recorded under conditions where fragmentation energy is applied, but without involving a previous precursor selection (e.g., data dependent MS2 (ddMS2), variable data-independent acquisition (vDIA). Newer acquisition modes lie somewhere between all-ion fragmentation (AIF) and traditional unit-mass MS/MS, and, in this “in-between zone”, the measurement involves multiple scan events in which consecutively smaller m/z ranges (25–100 Da) are isolated and fragmented (e.g., vDIA), thereby still covering the entire m/z range of interest. Hernandez et al. (2012)provided a critical review about the use of HRMS instruments in environmental sciences, outlining the main characteristics of HRMS and its great potential in that field. Regarding different fields of food analysis, Kaufmann (2012)discussed the role of HRMS instruments, including screening techniques and other aspects related to the potential, or limitations, in quantification and confirmation processes. In this article, we reviewed recent researches involving with screening and identification of chemical contaminant in foods and water by LC-HRMS to introduce the concept and framework of non-target analysis.
Suspect screening of chemical contaminants
For non-target analysis, suspects screening is easier than unknown screening. The use of HRMS for suspect screening benefits from the advantages of using the full-scan operation mode which can provide high specificity without limiting the number of simultaneously observed compounds. The suspect ion list just including the molecular formula allows for the calculation of an exact m/z of the expected ion, which is in turn extracted from the chromatogram. In the case of positive findings, further confirmatory steps based solely on structure-derived information can be employed. The information such as fragment, retention time and so on, can be established by experimental data of standard. Furthermore, an in-house database can be set up using this information. Once a database has been established, the parameters of the data processing software for analyte detection need to be optimized in order to obtain a fit-for-purpose balance between false positives and false negatives reported by the software (Fig. 2). About the criteria for the acceptable rates of false positives and false negatives for screening methods, the USDA Food Safety and Inspection Service (FSIS) requires ≤5% and ≤10%, respectively (Lehotay et al. 2012; Schneider et al. 2015). Nowadays, most researches of suspect screening using HRMS focused on pesticides, mycotoxins, fungal metabolites, veterinary drug (Dzuman et al. 2015; Jia et al. 2014; Gomez-Perez et al. 2012; Wang et al. 2012; Lehner et al. 2011)and plant toxins (Mol et al. 2011).
The procedure of data processing in suspect screening is shown in Fig. 3. Criteria for the confirmation of suspects need to be carefully chosen in order to minimize the possibilities for both false-positive and false-negative results. The parameters’ values of criteria are strongly related to the analysis instruments and their characteristics. The accurate mass and retention time (RT) is common criterion. In most cases, the mass accuracy in full-scan mode, for different matrices and concentration levels, is lower than 5 ppm. Gomez-Ramos et al. (2013)indicated that this value is an acceptable mass accuracy threshold for the confirmation of elemental composition. In order to avoid both false positives and negatives but, at the same time, missing the compounds present the sample, the RT window was set at ±0.15 min. Typically, with the column and gradient selected in that study, the RT precision was very high (<0.02 min for most of the compounds). Satisfactory results were obtained when combining an accurate mass tolerance of 1 mDa or 5 ppm with a ±0.15 min RT window. The obtained rates for pesticide identification with the selected parameters at different concentration levels were over 95% (Mezcua et al. 2009).
One of the major limitations of non-target approach is derived from unexpected matrix effects or a lack of MS parameter optimization which leads to unexpected false negative results. It is possible to estimate the efficiency of the automatic screening method in identifying the selected compounds related to the tested matrix. Jia et al. (2014)successfully developed a simultaneous screening of 333 pesticide and veterinary drug residues in baby food. In order to increase sample throughput, full MS scan mode was used for screening to distinguish between negative and positive samples, and ddMS2 (TopN) fragment spectra were acquired in order to confirm the presence of the suspected analytes. They showed that as the R set as 70,000 FWHM (17,500 FWHM for dd-MS2), coeluting matrix compounds from the matrix or noisy peaks can be easily excluded. The identification of the suspected compounds was based on the measurement of the accurate mass, RT and fragments. The best results were obtained when mass extraction windows of 2.5 ppm were employed, providing a high selectivity and reduced probability of false positives. Mol et al. (2012)studied 21 different vegetable and fruit commodities, a screening database of 556 pesticides for evaluation of false positives, and a test set of 130 pesticides spiked to the commodities for evaluation of false negatives. The criteria based on accurate mass of one diagnostic ion and RT resulted in too many false positives. Using relative response thresholds and one second diagnostic ion effectively reduced false positives. The threshold was set at half the lowest response obtained for any of the studied matrices. With this value, the number of false positives was lowered from 88 to 14 without affecting the overall percentage of detected pesticides. The two-ion approach (other adduct ions, M+1 or M+2 isotopes, fragments) was considered most useful in daily practice. The number of false positives out of 11,676 pesticide/commodity combinations targeted was 36 (0.3 %). The percentage of false negatives, assessed for 2,730 pesticide/commodity combinations, was 13 %, 3 %, and 1 % at the 0.01-, 0.05-, and 0.20-mg/kg level, respectively. Lehner et al. (2011)discussed the identification criteria for a suspects screening for 200 fungal secondary metabolites in food samples. The criteria included (1) presence of at least two adduct ion species (protonated molecules or ammonia/sodium adducts, accurate mass tolerance ± 3 ppm), (2) the response threshold of the most intense adduct ion species above 10,000 counts, (3) of the most intense ion species (I) the peak corresponding to the first 13C isotopologue had to be present (accurate mass tolerance ± 5 ppm) and the ratio of the measured intensity of the I+1 ion to the calculated (theoretically expected) intensity [Int(I+1)meas]/[Int(I+1)calc] had to be 0.65–1.05, (4) criteria (1) to (3) had to be fulfilled in at least five scans within a period of 25 s. Their results showed that applying criteria (1) and (2) to standards in pure solvents and standards in matrix maize led to zero false-negatives in both cases and to 13 (pure solvents) and 37 (matrix maize) false-positives. Application of criteria (1) to (3) led to only three false-positives but also two (pure solvent) and 12 (matrix maize) false-negatives. Applying criteria (1) to (4) led to the nine (pure solvent) and 16 (standards in matrix maize) false-negatives and zero false-positives.
Acceptable method performance criteria should be established for qualitative analysis purposes to suit the analytical needs for given applications, and empirical method validation should be conducted to demonstrate the qualitative performance capabilities of the method. Lehotay et al. (2015)made recommendations for validation of qualitative methods that meet common needs for monitoring of chemical contaminants in foods. For regulatory applications in the European Union (EU), single-laboratory validation of MS-based methods (screening and/or identification) involves analysis of a set of ≥20 different samples each of blanks and spikes at the RL (Reporting Level, fit-for-purpose threshold concentration above which the laboratory reports the presence of an analyte in the sample) and/or other concentrations of interest.
Unknown screening for chemical contaminants
In contrast to suspects screening, unknown screening analyzes without any priori information of those detected compounds. Therefore, comprehensive online databases are indispensable to provide tentative information of structures identity while processing a huge quantity HRMS data. Here are some useful databases and mass spectral libraries shown in Table 1 (Milman 2015). ChemSpider, which is a free database provides structural search access to over 32 million structures from hundreds of data sources, properties and associated information. There are several databases that can be used for the searching of pesticides. Commercial applications include the Merck Index (10,000 compounds total, 500 pesticides estimated) and ChemIndex (77,000 compounds total, 600 pesticides estimated) both from Cambridge Software.
Here we used the strategy of unknown screening to explore the suspected hazards or unexpected compounds existed in water samples. The HRMS data were processed and analyzed by Progenesis QI software (Waters ®). The workflow includes alignment, peak detection, deconvolution, component intensity comparison and statistics. In order to increase the efficiency of data processing, we select the potential peaks with criteria which ANOVA p value < 0.05 and max fold change >2. The results of multivariate statistical analysis (principal components analysis, PCA) of these selected peaks showed that reverse osmosis (RO) water was different from others. Then the S-Plot was drawn for extracting the compounds prominent in RO and other groundwater samples. Y axis indicated the credit and X axis indicated the response. We picked up the potential compounds with higher credit and response (shown in Fig. 4). The results of the tentative identification were shown in Table 2. The mass error of candidate is less than 2 ppm and isotope similarity is higher than 87.11288. The presence of a distinct isotope signal at M+2, as is the case for Cl-, Br-, and S-containing compounds, is important for the elemental composition elucidation. Thus, unknown identification is currently biased to these types of compounds. We also obtained the structure information of each formula from ChemSpider. Next step, we will find or predict those characteristics of structure, such as fragment ions and retentions to check the possibility of each candidate. An unknown screening is challenging to accomplish the methodology and explore the reality of unknown structures. More experiences of suspect screening supply the more information of unknown screenings.
CONCLUSION
Nowadays, simultaneous trace analysis of hundreds of unexpected compounds from different classes is required, preferably in just one run. HRMS instruments can adequately address such issues and generate meaningful structure suggestions of suspected and unknown compounds present in experiment samples; however, the main drawbacks are as a result of insufficient prior optimization of the operational parameters during non-target analysis in full-scan mode and due to software and database shortcomings. The problem comes from the software which needs to be enhanced for a better fit-for-purpose performance in non-target analysis and for an increase in data processing speed in quantitation processes. Overcoming this drawback will improve non-target analysis technology to perform in a routine detection and an early warning detection system. Additionally it could be used to continuously monitor for new food contaminants as a complement to the specific targeted analysis that is today’s foundation of food safety analysis.
REFERENCES
Dzuman, Z., M. Zachariasova, Z. Veprikova, M. Godula, and J. Hajslova. 2015. Multi-analyte high performance liquid chromatography coupled to high resolution tandem mass spectrometry method for control of pesticide residues, mycotoxins, and pyrrolizidine alkaloids. Analytica Chimica Acta 863:29-40.
Gomez-Perez, M. L., P. Plaza-Bolanos, R. Romero-Gonzalez, J. L. Martinez-Vidal, and A. Garrido-Frenich. 2012. Comprehensive qualitative and quantitative determination of pesticides and veterinary drugs in honey using liquid chromatography-Orbitrap high resolution mass spectrometry. Journal of Chromatography A 1248:130-138.
Gomez-Ramos, M. M., C. Ferrer, O. Malato, A. Aguera, and A. R. Fernandez-Alba. 2013. Liquid chromatography-high-resolution mass spectrometry for pesticide residue analysis in fruit and vegetables: Screening and quantitative studies. Journal of Chromatography A 1287:24-37.
Hernandez, F., J. V. Sancho, M. Ibanez, E. Abad, T. Portoles, and L. Mattioli. 2012. Current use of high-resolution mass spectrometry in the environmental sciences. Analytical and Bioanalytical Chemistry 403 (5):1251-1264.
Jia, W., X. G. Chu, Y. Ling, J. R. Huang, and J. Chang. 2014. High-throughput screening of pesticide and veterinary drug residues in baby food by liquid chromatography coupled to quadrupole Orbitrap mass spectrometry. Journal of Chromatography A 1347:122-128.
Kaufmann, A. 2012. The current role of high-resolution mass spectrometry in food analysis. Analytical and Bioanalytical Chemistry 403 (5):1233-1249.
Kellmann, M., H. Muenster, P. Zomer, and H. Mol. 2009. Full scan ms in comprehensive qualitative and quantitative residue analysis in food and feed matrices: How much resolving power is required? Journal of the American Society for Mass Spectrometry 20 (8):1464-1476.
Krauss, M., H. Singer, and J. Hollender. 2010. LC-high resolution MS in environmental analysis: from target screening to the identification of unknowns. Analytical and Bioanalytical Chemistry 397 (3):943-951.
Lehner, S. M., N. K. N. Neumann, M. Sulyok, M. Lemmens, R. Krska, and R. Schuhmacher. 2011. Evaluation of LC-high-resolution FT-Orbitrap MS for the quantification of selected mycotoxins and the simultaneous screening of fungal metabolites in food. Food Additives and Contaminants Part a-Chemistry Analysis Control Exposure & Risk Assessment 28 (10):1457-1468.
Lehotay, S. J., A. R. Lightfield, L. Geis-Asteggiante, M. J. Schneider, T. Dutko, C. Ng, L. Bluhm, and K. Mastovska. 2012. Development and validation of a streamlined method designed to detect residues of 62 veterinary drugs in bovine kidney using ultra-high performance liquid chromatography - tandem mass spectrometry. Drug Testing and Analysis 4:75-90.
Lehotay, S. J., Y. Sapozhnikova, and H. G. J. Mol. 2015. Current issues involving screening and identification of chemical contaminants in foods by mass spectrometry. Trac-Trends in Analytical Chemistry 69:62-75.
Mezcua, M., O. Malato, J. F. Garcia-Reyes, A. Molina-Diaz, and A. R. Fernandez-Alba. 2009. Accurate-mass databases for comprehensive screening of pesticide residues in food by fast liquid chromatography time-of-flight mass spectrometry. Analytical Chemistry 81 (3):913-929.
Milman, B. L. 2015. General principles of identification by mass spectrometry. Trac-Trends in Analytical Chemistry 69:24-33.
Mol, H. G. J., R. C. J. Van Dam, P. Zomer, and P. P. J. Mulder. 2011. Screening of plant toxins in food, feed and botanicals using full-scan high-resolution (Orbitrap) mass spectrometry. Food Additives and Contaminants Part a-Chemistry Analysis Control Exposure & Risk Assessment 28 (10):1405-1423.
Mol, H. G. J., P. Zomer, and M. de Koning. 2012. Qualitative aspects and validation of a screening method for pesticides in vegetables and fruits based on liquid chromatography coupled to full scan high resolution (Orbitrap) mass spectrometry. Analytical and Bioanalytical Chemistry 403 (10):2891-2908.
Nielen, M. W. F., M. C. van Engelen, R. Zuiderent, and R. Ramaker. 2007. Screening and confirmation criteria for hormone residue analysis using liquid chromatography accurate mass time-of-flight, Fourier transform ion cyclotron resonance and orbitrap mass spectrometry techniques. Analytica Chimica Acta 586 (1-2):122-129.
Schneider, M. J., S. J. Lehotay, and A. R. Lightfield. 2015. Validation of a streamlined multiclass, multiresidue method for determination of veterinary drug residues in bovine muscle by liquid chromatography-tandem mass spectrometry. Analytical and Bioanalytical Chemistry 407 (15):4423-4435.
van der Heeft, E., Y. J. C. Bolck, B. Beumer, A. Nijrolder, A. A. M. Stolker, and M. W. F. Nielen. 2009. Full-scan accurate mass selectivity of ultra-performance liquid chromatography combined with time-of-flight and orbitrap mass spectrometry in hormone and veterinary drug residue analysis. Journal of the American Society for Mass Spectrometry 20 (3):451-463.
Wang, J., W. Chow, D. Leung, and J. Chang. 2012. Application of ultrahigh-performance liquid chromatography and electrospray ionization quadrupole orbitrap high-resolution mass spectrometry for determination of 166 pesticides in fruits and vegetables. Journal of Agricultural and Food Chemistry 60 (49):12088-12104.
Table 1. Useful databases and mass spectral libraries for the identification of the non-target analysis
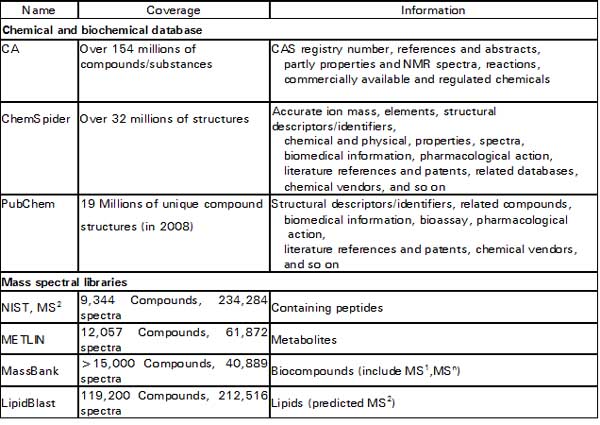
Fig. 4. Statistics analysis of S-Plot for extracting the compounds prominent in groundwater and RO.

Application of Non-Target Analysis by High-Resolution Mass Spectrometry
ABSTRACT
High-resolution mass spectrometry (HRMS)-based non-targeted metabolomic analysis is a new technology used for unbiased collections of food chemical data in food safety inspections involving unexpected factors. HRMS with high resolving power and high mass spectral accuracy allows screening of unknown and suspected analytes without reference standards. Its reliable identification is due to increased selectivity against the food matrix background and thus it assigns to correct molecular formula of unknown compounds. To introduce the concept and framework of non-target analysis, we reviewed recent researches involving screening and identification of chemical contaminant in foods and water by liquid chromatography (LC)-HRMS. These results indicate that this new detection technique can be used as an early warning system before running thorough sample analysis for scrutiny.
Keywords: Non-Target Analysis, High-Resolution Mass Spectrometry, Mass Accuracy
Introduction
As the last defense line in food safety evaluation, food inspection and analysis usually target on specified pesticides, veterinary drugs, and food additives, etc. The problem of these target specified tests is not being able to detect any chemicals which are not defined in the initial settings. For examples, incidents of China’s melamine adulterant in milk; illegal dye used in tofu products and olive oil; phthalate plasticizer added in drinks, jam, jelly, and capsule food in Taiwan. Nowadays, the international trend is towards to identify emerging food safety issues at their early stages through non-targeted monitoring analysis technology.
The comparison of the systematic workflows for target and non-target analysis (includes suspect and unknown screening) is shown in Fig 1. Target analysis is conventional analysis based on establishing a specified method with standards, i.e. interested analytes, prior to analysis and monitoring real samples. Compounds are characterized during method development, and information (retention time, characteristic fragmentation and their ratios) is obtained for further identification and quantitation of these compounds in real samples. Mass spectrometer with triple quadrupole (QqQ) technology is useful analyzer for target analysis, due to their high specificity in multiple reaction-monitoring (MRM) mode and their low limit of detection (LOD). In contrast to target analysis, non-target analysis starts without any a priori information on the compounds to be detected and uses general method.
To meet the challenges of analyzing unexpected compounds at low concentrations in complex matrices, a range of different LC-MS technologies have been bring up in recent years. Moreover, since sample preparation for non-target analysis is often non-selective and chromatographic resolution in LC is limited, mass-resolving power (R; defined at full width at half maximum, FWHM) plays the key role. High resolution mass spectrometry (HRMS) with high mass accuracy and resolving power has emerged as a powerful tool for non-targeted analysis. Selectivity in HRMS-based extracted-ion chromatograms is obtained by using narrow mass-extraction windows (MEWs). About the R of HRMS, EU defines it as 20,000 FWHM (2002/657/EC, EU/589/2014, SANCO/12571/2013) while World Anti-Doping Agency (WADA) defines it as 10,000 FWHM. As carrying out an experiment, the resolving power selected depends on the ratio of the analyte concentration relative to co-eluting matrix interferences and the sample preparation before LC-MS analysis. With straightforward generic extraction procedures, typically used in broad screening methods, a first evaluation shows that a resolving power of 7,000–10,000 can be sufficient for detection of analytes in samples of intermediate complexity, at levels down to 25 ng/g, with mass errors below 5 ppm (Kellmann et al. 2009). For consistent and reliable mass assignment (<2 ppm) of analytes at low levels in complex matrices, a high resolving power (≧50,000) was found to be required (Kellmann et al. 2009; Nielen et al. 2007; van der Heeft et al. 2009). Krauss et al. (2010)overviewed commercially available mass spectrometers and showed that Orbitrap is increasingly applied due to the combination of high R (up to 100,000), high mass accuracy (<2 ppm), and a sensitivity down to the femtogram range. Moreover, in Orbitrap instruments different resolving-power settings can be chosen, involving a trade-off in data-acquisition rate at increased resolving power (e.g., 12 Hz at 17,500 FWHM and 1 Hz at 140,000 FWHM).
A major advantage of LC-HRMS is the possibility of retrospective analysis of full-scan data, which enables laboratories to search for new contaminants years after data recording. Other advantages of these instruments are the possibility for a posteriori analysis and their usefulness in identifying unknown compounds. Moreover, full scan HRMS data can also be recorded under conditions where fragmentation energy is applied, but without involving a previous precursor selection (e.g., data dependent MS2 (ddMS2), variable data-independent acquisition (vDIA). Newer acquisition modes lie somewhere between all-ion fragmentation (AIF) and traditional unit-mass MS/MS, and, in this “in-between zone”, the measurement involves multiple scan events in which consecutively smaller m/z ranges (25–100 Da) are isolated and fragmented (e.g., vDIA), thereby still covering the entire m/z range of interest. Hernandez et al. (2012)provided a critical review about the use of HRMS instruments in environmental sciences, outlining the main characteristics of HRMS and its great potential in that field. Regarding different fields of food analysis, Kaufmann (2012)discussed the role of HRMS instruments, including screening techniques and other aspects related to the potential, or limitations, in quantification and confirmation processes. In this article, we reviewed recent researches involving with screening and identification of chemical contaminant in foods and water by LC-HRMS to introduce the concept and framework of non-target analysis.
Suspect screening of chemical contaminants
For non-target analysis, suspects screening is easier than unknown screening. The use of HRMS for suspect screening benefits from the advantages of using the full-scan operation mode which can provide high specificity without limiting the number of simultaneously observed compounds. The suspect ion list just including the molecular formula allows for the calculation of an exact m/z of the expected ion, which is in turn extracted from the chromatogram. In the case of positive findings, further confirmatory steps based solely on structure-derived information can be employed. The information such as fragment, retention time and so on, can be established by experimental data of standard. Furthermore, an in-house database can be set up using this information. Once a database has been established, the parameters of the data processing software for analyte detection need to be optimized in order to obtain a fit-for-purpose balance between false positives and false negatives reported by the software (Fig. 2). About the criteria for the acceptable rates of false positives and false negatives for screening methods, the USDA Food Safety and Inspection Service (FSIS) requires ≤5% and ≤10%, respectively (Lehotay et al. 2012; Schneider et al. 2015). Nowadays, most researches of suspect screening using HRMS focused on pesticides, mycotoxins, fungal metabolites, veterinary drug (Dzuman et al. 2015; Jia et al. 2014; Gomez-Perez et al. 2012; Wang et al. 2012; Lehner et al. 2011)and plant toxins (Mol et al. 2011).
The procedure of data processing in suspect screening is shown in Fig. 3. Criteria for the confirmation of suspects need to be carefully chosen in order to minimize the possibilities for both false-positive and false-negative results. The parameters’ values of criteria are strongly related to the analysis instruments and their characteristics. The accurate mass and retention time (RT) is common criterion. In most cases, the mass accuracy in full-scan mode, for different matrices and concentration levels, is lower than 5 ppm. Gomez-Ramos et al. (2013)indicated that this value is an acceptable mass accuracy threshold for the confirmation of elemental composition. In order to avoid both false positives and negatives but, at the same time, missing the compounds present the sample, the RT window was set at ±0.15 min. Typically, with the column and gradient selected in that study, the RT precision was very high (<0.02 min for most of the compounds). Satisfactory results were obtained when combining an accurate mass tolerance of 1 mDa or 5 ppm with a ±0.15 min RT window. The obtained rates for pesticide identification with the selected parameters at different concentration levels were over 95% (Mezcua et al. 2009).
One of the major limitations of non-target approach is derived from unexpected matrix effects or a lack of MS parameter optimization which leads to unexpected false negative results. It is possible to estimate the efficiency of the automatic screening method in identifying the selected compounds related to the tested matrix. Jia et al. (2014)successfully developed a simultaneous screening of 333 pesticide and veterinary drug residues in baby food. In order to increase sample throughput, full MS scan mode was used for screening to distinguish between negative and positive samples, and ddMS2 (TopN) fragment spectra were acquired in order to confirm the presence of the suspected analytes. They showed that as the R set as 70,000 FWHM (17,500 FWHM for dd-MS2), coeluting matrix compounds from the matrix or noisy peaks can be easily excluded. The identification of the suspected compounds was based on the measurement of the accurate mass, RT and fragments. The best results were obtained when mass extraction windows of 2.5 ppm were employed, providing a high selectivity and reduced probability of false positives. Mol et al. (2012)studied 21 different vegetable and fruit commodities, a screening database of 556 pesticides for evaluation of false positives, and a test set of 130 pesticides spiked to the commodities for evaluation of false negatives. The criteria based on accurate mass of one diagnostic ion and RT resulted in too many false positives. Using relative response thresholds and one second diagnostic ion effectively reduced false positives. The threshold was set at half the lowest response obtained for any of the studied matrices. With this value, the number of false positives was lowered from 88 to 14 without affecting the overall percentage of detected pesticides. The two-ion approach (other adduct ions, M+1 or M+2 isotopes, fragments) was considered most useful in daily practice. The number of false positives out of 11,676 pesticide/commodity combinations targeted was 36 (0.3 %). The percentage of false negatives, assessed for 2,730 pesticide/commodity combinations, was 13 %, 3 %, and 1 % at the 0.01-, 0.05-, and 0.20-mg/kg level, respectively. Lehner et al. (2011)discussed the identification criteria for a suspects screening for 200 fungal secondary metabolites in food samples. The criteria included (1) presence of at least two adduct ion species (protonated molecules or ammonia/sodium adducts, accurate mass tolerance ± 3 ppm), (2) the response threshold of the most intense adduct ion species above 10,000 counts, (3) of the most intense ion species (I) the peak corresponding to the first 13C isotopologue had to be present (accurate mass tolerance ± 5 ppm) and the ratio of the measured intensity of the I+1 ion to the calculated (theoretically expected) intensity [Int(I+1)meas]/[Int(I+1)calc] had to be 0.65–1.05, (4) criteria (1) to (3) had to be fulfilled in at least five scans within a period of 25 s. Their results showed that applying criteria (1) and (2) to standards in pure solvents and standards in matrix maize led to zero false-negatives in both cases and to 13 (pure solvents) and 37 (matrix maize) false-positives. Application of criteria (1) to (3) led to only three false-positives but also two (pure solvent) and 12 (matrix maize) false-negatives. Applying criteria (1) to (4) led to the nine (pure solvent) and 16 (standards in matrix maize) false-negatives and zero false-positives.
Acceptable method performance criteria should be established for qualitative analysis purposes to suit the analytical needs for given applications, and empirical method validation should be conducted to demonstrate the qualitative performance capabilities of the method. Lehotay et al. (2015)made recommendations for validation of qualitative methods that meet common needs for monitoring of chemical contaminants in foods. For regulatory applications in the European Union (EU), single-laboratory validation of MS-based methods (screening and/or identification) involves analysis of a set of ≥20 different samples each of blanks and spikes at the RL (Reporting Level, fit-for-purpose threshold concentration above which the laboratory reports the presence of an analyte in the sample) and/or other concentrations of interest.
Unknown screening for chemical contaminants
In contrast to suspects screening, unknown screening analyzes without any priori information of those detected compounds. Therefore, comprehensive online databases are indispensable to provide tentative information of structures identity while processing a huge quantity HRMS data. Here are some useful databases and mass spectral libraries shown in Table 1 (Milman 2015). ChemSpider, which is a free database provides structural search access to over 32 million structures from hundreds of data sources, properties and associated information. There are several databases that can be used for the searching of pesticides. Commercial applications include the Merck Index (10,000 compounds total, 500 pesticides estimated) and ChemIndex (77,000 compounds total, 600 pesticides estimated) both from Cambridge Software.
Here we used the strategy of unknown screening to explore the suspected hazards or unexpected compounds existed in water samples. The HRMS data were processed and analyzed by Progenesis QI software (Waters ®). The workflow includes alignment, peak detection, deconvolution, component intensity comparison and statistics. In order to increase the efficiency of data processing, we select the potential peaks with criteria which ANOVA p value < 0.05 and max fold change >2. The results of multivariate statistical analysis (principal components analysis, PCA) of these selected peaks showed that reverse osmosis (RO) water was different from others. Then the S-Plot was drawn for extracting the compounds prominent in RO and other groundwater samples. Y axis indicated the credit and X axis indicated the response. We picked up the potential compounds with higher credit and response (shown in Fig. 4). The results of the tentative identification were shown in Table 2. The mass error of candidate is less than 2 ppm and isotope similarity is higher than 87.11288. The presence of a distinct isotope signal at M+2, as is the case for Cl-, Br-, and S-containing compounds, is important for the elemental composition elucidation. Thus, unknown identification is currently biased to these types of compounds. We also obtained the structure information of each formula from ChemSpider. Next step, we will find or predict those characteristics of structure, such as fragment ions and retentions to check the possibility of each candidate. An unknown screening is challenging to accomplish the methodology and explore the reality of unknown structures. More experiences of suspect screening supply the more information of unknown screenings.
CONCLUSION
Nowadays, simultaneous trace analysis of hundreds of unexpected compounds from different classes is required, preferably in just one run. HRMS instruments can adequately address such issues and generate meaningful structure suggestions of suspected and unknown compounds present in experiment samples; however, the main drawbacks are as a result of insufficient prior optimization of the operational parameters during non-target analysis in full-scan mode and due to software and database shortcomings. The problem comes from the software which needs to be enhanced for a better fit-for-purpose performance in non-target analysis and for an increase in data processing speed in quantitation processes. Overcoming this drawback will improve non-target analysis technology to perform in a routine detection and an early warning detection system. Additionally it could be used to continuously monitor for new food contaminants as a complement to the specific targeted analysis that is today’s foundation of food safety analysis.
REFERENCES
Dzuman, Z., M. Zachariasova, Z. Veprikova, M. Godula, and J. Hajslova. 2015. Multi-analyte high performance liquid chromatography coupled to high resolution tandem mass spectrometry method for control of pesticide residues, mycotoxins, and pyrrolizidine alkaloids. Analytica Chimica Acta 863:29-40.
Gomez-Perez, M. L., P. Plaza-Bolanos, R. Romero-Gonzalez, J. L. Martinez-Vidal, and A. Garrido-Frenich. 2012. Comprehensive qualitative and quantitative determination of pesticides and veterinary drugs in honey using liquid chromatography-Orbitrap high resolution mass spectrometry. Journal of Chromatography A 1248:130-138.
Gomez-Ramos, M. M., C. Ferrer, O. Malato, A. Aguera, and A. R. Fernandez-Alba. 2013. Liquid chromatography-high-resolution mass spectrometry for pesticide residue analysis in fruit and vegetables: Screening and quantitative studies. Journal of Chromatography A 1287:24-37.
Hernandez, F., J. V. Sancho, M. Ibanez, E. Abad, T. Portoles, and L. Mattioli. 2012. Current use of high-resolution mass spectrometry in the environmental sciences. Analytical and Bioanalytical Chemistry 403 (5):1251-1264.
Jia, W., X. G. Chu, Y. Ling, J. R. Huang, and J. Chang. 2014. High-throughput screening of pesticide and veterinary drug residues in baby food by liquid chromatography coupled to quadrupole Orbitrap mass spectrometry. Journal of Chromatography A 1347:122-128.
Kaufmann, A. 2012. The current role of high-resolution mass spectrometry in food analysis. Analytical and Bioanalytical Chemistry 403 (5):1233-1249.
Kellmann, M., H. Muenster, P. Zomer, and H. Mol. 2009. Full scan ms in comprehensive qualitative and quantitative residue analysis in food and feed matrices: How much resolving power is required? Journal of the American Society for Mass Spectrometry 20 (8):1464-1476.
Krauss, M., H. Singer, and J. Hollender. 2010. LC-high resolution MS in environmental analysis: from target screening to the identification of unknowns. Analytical and Bioanalytical Chemistry 397 (3):943-951.
Lehner, S. M., N. K. N. Neumann, M. Sulyok, M. Lemmens, R. Krska, and R. Schuhmacher. 2011. Evaluation of LC-high-resolution FT-Orbitrap MS for the quantification of selected mycotoxins and the simultaneous screening of fungal metabolites in food. Food Additives and Contaminants Part a-Chemistry Analysis Control Exposure & Risk Assessment 28 (10):1457-1468.
Lehotay, S. J., A. R. Lightfield, L. Geis-Asteggiante, M. J. Schneider, T. Dutko, C. Ng, L. Bluhm, and K. Mastovska. 2012. Development and validation of a streamlined method designed to detect residues of 62 veterinary drugs in bovine kidney using ultra-high performance liquid chromatography - tandem mass spectrometry. Drug Testing and Analysis 4:75-90.
Lehotay, S. J., Y. Sapozhnikova, and H. G. J. Mol. 2015. Current issues involving screening and identification of chemical contaminants in foods by mass spectrometry. Trac-Trends in Analytical Chemistry 69:62-75.
Mezcua, M., O. Malato, J. F. Garcia-Reyes, A. Molina-Diaz, and A. R. Fernandez-Alba. 2009. Accurate-mass databases for comprehensive screening of pesticide residues in food by fast liquid chromatography time-of-flight mass spectrometry. Analytical Chemistry 81 (3):913-929.
Milman, B. L. 2015. General principles of identification by mass spectrometry. Trac-Trends in Analytical Chemistry 69:24-33.
Mol, H. G. J., R. C. J. Van Dam, P. Zomer, and P. P. J. Mulder. 2011. Screening of plant toxins in food, feed and botanicals using full-scan high-resolution (Orbitrap) mass spectrometry. Food Additives and Contaminants Part a-Chemistry Analysis Control Exposure & Risk Assessment 28 (10):1405-1423.
Mol, H. G. J., P. Zomer, and M. de Koning. 2012. Qualitative aspects and validation of a screening method for pesticides in vegetables and fruits based on liquid chromatography coupled to full scan high resolution (Orbitrap) mass spectrometry. Analytical and Bioanalytical Chemistry 403 (10):2891-2908.
Nielen, M. W. F., M. C. van Engelen, R. Zuiderent, and R. Ramaker. 2007. Screening and confirmation criteria for hormone residue analysis using liquid chromatography accurate mass time-of-flight, Fourier transform ion cyclotron resonance and orbitrap mass spectrometry techniques. Analytica Chimica Acta 586 (1-2):122-129.
Schneider, M. J., S. J. Lehotay, and A. R. Lightfield. 2015. Validation of a streamlined multiclass, multiresidue method for determination of veterinary drug residues in bovine muscle by liquid chromatography-tandem mass spectrometry. Analytical and Bioanalytical Chemistry 407 (15):4423-4435.
van der Heeft, E., Y. J. C. Bolck, B. Beumer, A. Nijrolder, A. A. M. Stolker, and M. W. F. Nielen. 2009. Full-scan accurate mass selectivity of ultra-performance liquid chromatography combined with time-of-flight and orbitrap mass spectrometry in hormone and veterinary drug residue analysis. Journal of the American Society for Mass Spectrometry 20 (3):451-463.
Wang, J., W. Chow, D. Leung, and J. Chang. 2012. Application of ultrahigh-performance liquid chromatography and electrospray ionization quadrupole orbitrap high-resolution mass spectrometry for determination of 166 pesticides in fruits and vegetables. Journal of Agricultural and Food Chemistry 60 (49):12088-12104.
Table 1. Useful databases and mass spectral libraries for the identification of the non-target analysis
Table. 2. The compounds prominent in groundwater and RO
a "n" means "neutral mass"
b The criteria of the accurate mass tolerance is 2 ppm
Fig. 1. Comparison of systematic workflows for target and non-target analysis in detecting samples
Fig. 2. Proposed workflow for identification strategies of non-target analysis
Fig. 3. The procedure of data processing in suspect screening
Fig. 4. Statistics analysis of S-Plot for extracting the compounds prominent in groundwater and RO.
Submitted for the FFTC-KU International Workshop on Risk Management on Agrochemicals through Novel Technologies for Food Safety in Asia, November 10-14, Sampran Riverside, Nakorn Pathom, Thailand