Introduction
In response to global economic environments, improving the competitiveness of agriculture is a major issue. At the regional context, ASEAN member states including Indonesia are confronted with the implementation of ASEAN Economic Community (AEC) by 31 December 2015. This is especially pressing for Indonesia with the largest population in ASEAN (255 million in 2015). Over the last several years, the position of Indonesia in the international agricultural trade has been surpassed by other countries. This trend is not only caused by low competitiveness of the agricultural sector but also by limited production capacity.
The agricultural sector in Indonesia actually poses a comparative advantage compared to other countries. However, so far the sector is not the focus of regional development. Regional authorities consider agriculture as a cost center, which require a sizeable investment, with long return period. Therefore, it is of interest to study the competitiveness of agriculture at the provincial level. More specifically, the objectives of the analysis are: (a) to identify some factors influencing agriculture’s competitiveness; (b) mapping the status of agriculture’s competitiveness at the national and provincial level, and (c) identify leverage of agriculture’s competitiveness in the provinces.
Method of analysis
One of the challenges of agricultural development in Indonesia is the emergence of competitor countries which produce agricultural products at the same season and the emergence of substitute products. Huge number of consumers in Indonesia is considered as potential destination for export of products from other countries. Therefore, we need data and information as indicators influencing agricultural competitiveness and their corresponding leverages. In accordance with the framework used by Tan et. al (2014), there are four pilars influencing competitiveness of agriculture, namely: (a) macroeconomic; (b) governace and institutions; (c) financial, business, and labor force; and (d) quality of life and infrastructure. To identify and compose those pilars and leverage atributes, we need a set of analytical tools such as Analysis Hierarchy Process (AHP), Multidimensional Scaling (MDS) Analysis, and Participatory Prospective Analysis (PPA).
Analyses of AHP and some MDS are conducted at the national level, whereas analyses of some other components of MDS and PPA are conducted using data from 10 provinces. These provinces are selected based on Gross Domestict Regional Product and their rank on regional competitiveness as reported by Tan et al. (2014). Based on the combination of these two indicators, all provinces are then grouped into four quadrants, namely: (a) quadrant I ( Competitive in both regional economy and agriculture); (b) quadrant II (Competitive in agriculture but not in regional economy): (c) quadrant III ( Not competitive in neither regional economy nor agriculture); and (d) quadrant IV (Competitive in regional economy but not in agriculture).
Regional and agricultural competitiveness
Tan et. al (2014) has analyzed the mapping of all provinces in Indonesia based on some sets of indicators related to the performace of economy as a whole, which was then refered to as regional competitiveness. This classification is then combined with the result of competitiveness analyses of each province in agriculture. The result is mapped into four quadrant as presented in Table 1.
Out of 32 provinces in Indonesia, 5 provinces are grouped into quadrant IV, 7 provinces in quadrant I, 8 provinces in quadrant II, and the rest 12 provinces in quadrant III. All provinces in quadrant I are fast growing regions and strong in both agriculture and economy as a whole. Some of them are endowed with rich natural resources, including oil, natural gas, and mineral (Riau and East Kalimantan), and the center for estate crop development, such as oil palm and natural rubber. Provinces in quadrant IV do not have any competitiveness in agriculture but they are more competitive in the non-agricultural sectors such as manufacturing industries, trade, and tourism. Agriculture is not major economic activity, partly due to limited land resources (DKI Jakarta and Riau Islands). Quadrant II represent provinces which are competitive in agriculture, particularly estate crops as source of export, in addition to food crops. Lastly quadrant III represent countries which is not yet competitive in agriculture and neither in the economic aspect as a whole. Some provinces are again poor in land resources such as East Nusa Tenggara and Central Sulawesi. Some other provinces are constrained by poor infrastructures and human resources (Papua, West Papua, Maluku, and North Maluku).
Among the four pilars of agriculture competitiveness, macroeconomic shows the largest contribution to the level of competitiveness (29.5%) followed by finance, business and labor force (25.4%), governance and institutions (24.0%), and quality of life and infrastructures (21.7%). Furthermore, the leverage attributes on macroeconomic are: ratio of agricultural exports and imports, agriculture term of trade, and the ratio of agriculture credit to total credit at the village level. Related to governance and institution, the most important leverage attributes are: access to agriculture R&D, ratio of agriculture revenue to total revenue, and access to education and training services. The leverage factor of finance, business and labor force are: growth rate of wages, per capita regional gross domestic product on food crops and horticulture, and intensity of labor force on processing and marketing. Lastly, the most important leverage attributes on quality of life and infrastructure are: the number of slaughter livestock, the number of villages accessible by vechicles or water transportation means (ship, motor boat, etc), and the ratio of actual and potential estate crop productivity.
Conclusion
Out of 32 provinces, there are seven provinces which show competitivenes in both agriculture and economy as a whole, whereas 12 provinces do not have any form of attributes competitiveness in neither agriculture nor economy at large. The other 13 provinces show competitiveness in either agriculture or economy as a whole. From national economic development view point, the strategic direction is to move 12 provinces in the lowest quadrant to either quadrant III (agriculture) or quadrant I (non-agriculture) or quadrant II (both agriculture and non- agriculture). Macroeconomic is the most important pillar to improve competitiveness followed by finance, business and labor force, governance and institution, and quality of life and infrastructures. The strategy to improve competitiveness should be based on the strength of pillars in the corresponding provinces.
References
Tan, K.G., K.Y. Tan, and N. Merdikawati. 2014. “Competitiveness Ranking, Simulation Analysis and Development Strategies for 33 Provinces and Six Regions in Indonesia”. Paper presented at the “International Symposium on Applied System Analysis”. Indonesian Agency for Agricultural Research and Development, Jakarta, 14 October 2014.
Darmoredjo, S.K, T.Sudaryanto, B.F.Hutabarat Budiman, R.Heriawan, S.M. Pasaribu, Hermanto, A.Iswariyadi, A.Setiyanto, R.Elizabeth, dan R.Aldilah. 2015. “Pemetaan Daya Saing Pertanian Indonesia (Mapping of Agriculture Competitiveness in Indonesia)”, Research Report, Indonesian Center for Agriculture Socio Economic and Policy Studies, Bogor.
Table 1. Mapping of provinces based on regional and agricultural competitiveness
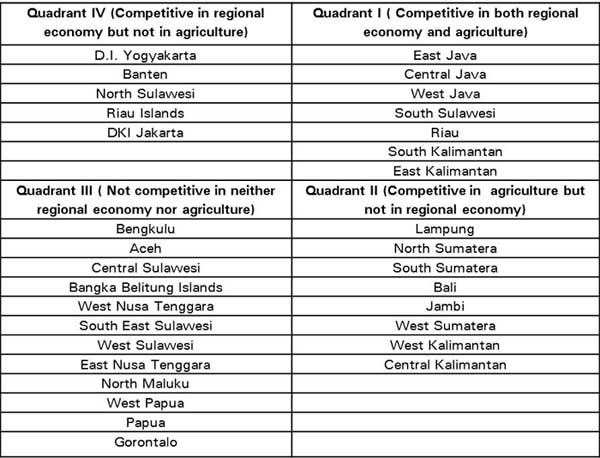
Source: Darmoredjo et. al., 2015
|
Date submitted: Nov. 17, 2015
Reviewed, edited and uploaded: Nov. 18, 2015
|

Mapping of Agriculture’s Competitiveness Across Provinces in Indonesia
Introduction
In response to global economic environments, improving the competitiveness of agriculture is a major issue. At the regional context, ASEAN member states including Indonesia are confronted with the implementation of ASEAN Economic Community (AEC) by 31 December 2015. This is especially pressing for Indonesia with the largest population in ASEAN (255 million in 2015). Over the last several years, the position of Indonesia in the international agricultural trade has been surpassed by other countries. This trend is not only caused by low competitiveness of the agricultural sector but also by limited production capacity.
The agricultural sector in Indonesia actually poses a comparative advantage compared to other countries. However, so far the sector is not the focus of regional development. Regional authorities consider agriculture as a cost center, which require a sizeable investment, with long return period. Therefore, it is of interest to study the competitiveness of agriculture at the provincial level. More specifically, the objectives of the analysis are: (a) to identify some factors influencing agriculture’s competitiveness; (b) mapping the status of agriculture’s competitiveness at the national and provincial level, and (c) identify leverage of agriculture’s competitiveness in the provinces.
Method of analysis
One of the challenges of agricultural development in Indonesia is the emergence of competitor countries which produce agricultural products at the same season and the emergence of substitute products. Huge number of consumers in Indonesia is considered as potential destination for export of products from other countries. Therefore, we need data and information as indicators influencing agricultural competitiveness and their corresponding leverages. In accordance with the framework used by Tan et. al (2014), there are four pilars influencing competitiveness of agriculture, namely: (a) macroeconomic; (b) governace and institutions; (c) financial, business, and labor force; and (d) quality of life and infrastructure. To identify and compose those pilars and leverage atributes, we need a set of analytical tools such as Analysis Hierarchy Process (AHP), Multidimensional Scaling (MDS) Analysis, and Participatory Prospective Analysis (PPA).
Analyses of AHP and some MDS are conducted at the national level, whereas analyses of some other components of MDS and PPA are conducted using data from 10 provinces. These provinces are selected based on Gross Domestict Regional Product and their rank on regional competitiveness as reported by Tan et al. (2014). Based on the combination of these two indicators, all provinces are then grouped into four quadrants, namely: (a) quadrant I ( Competitive in both regional economy and agriculture); (b) quadrant II (Competitive in agriculture but not in regional economy): (c) quadrant III ( Not competitive in neither regional economy nor agriculture); and (d) quadrant IV (Competitive in regional economy but not in agriculture).
Regional and agricultural competitiveness
Tan et. al (2014) has analyzed the mapping of all provinces in Indonesia based on some sets of indicators related to the performace of economy as a whole, which was then refered to as regional competitiveness. This classification is then combined with the result of competitiveness analyses of each province in agriculture. The result is mapped into four quadrant as presented in Table 1.
Out of 32 provinces in Indonesia, 5 provinces are grouped into quadrant IV, 7 provinces in quadrant I, 8 provinces in quadrant II, and the rest 12 provinces in quadrant III. All provinces in quadrant I are fast growing regions and strong in both agriculture and economy as a whole. Some of them are endowed with rich natural resources, including oil, natural gas, and mineral (Riau and East Kalimantan), and the center for estate crop development, such as oil palm and natural rubber. Provinces in quadrant IV do not have any competitiveness in agriculture but they are more competitive in the non-agricultural sectors such as manufacturing industries, trade, and tourism. Agriculture is not major economic activity, partly due to limited land resources (DKI Jakarta and Riau Islands). Quadrant II represent provinces which are competitive in agriculture, particularly estate crops as source of export, in addition to food crops. Lastly quadrant III represent countries which is not yet competitive in agriculture and neither in the economic aspect as a whole. Some provinces are again poor in land resources such as East Nusa Tenggara and Central Sulawesi. Some other provinces are constrained by poor infrastructures and human resources (Papua, West Papua, Maluku, and North Maluku).
Among the four pilars of agriculture competitiveness, macroeconomic shows the largest contribution to the level of competitiveness (29.5%) followed by finance, business and labor force (25.4%), governance and institutions (24.0%), and quality of life and infrastructures (21.7%). Furthermore, the leverage attributes on macroeconomic are: ratio of agricultural exports and imports, agriculture term of trade, and the ratio of agriculture credit to total credit at the village level. Related to governance and institution, the most important leverage attributes are: access to agriculture R&D, ratio of agriculture revenue to total revenue, and access to education and training services. The leverage factor of finance, business and labor force are: growth rate of wages, per capita regional gross domestic product on food crops and horticulture, and intensity of labor force on processing and marketing. Lastly, the most important leverage attributes on quality of life and infrastructure are: the number of slaughter livestock, the number of villages accessible by vechicles or water transportation means (ship, motor boat, etc), and the ratio of actual and potential estate crop productivity.
Conclusion
Out of 32 provinces, there are seven provinces which show competitivenes in both agriculture and economy as a whole, whereas 12 provinces do not have any form of attributes competitiveness in neither agriculture nor economy at large. The other 13 provinces show competitiveness in either agriculture or economy as a whole. From national economic development view point, the strategic direction is to move 12 provinces in the lowest quadrant to either quadrant III (agriculture) or quadrant I (non-agriculture) or quadrant II (both agriculture and non- agriculture). Macroeconomic is the most important pillar to improve competitiveness followed by finance, business and labor force, governance and institution, and quality of life and infrastructures. The strategy to improve competitiveness should be based on the strength of pillars in the corresponding provinces.
References
Tan, K.G., K.Y. Tan, and N. Merdikawati. 2014. “Competitiveness Ranking, Simulation Analysis and Development Strategies for 33 Provinces and Six Regions in Indonesia”. Paper presented at the “International Symposium on Applied System Analysis”. Indonesian Agency for Agricultural Research and Development, Jakarta, 14 October 2014.
Darmoredjo, S.K, T.Sudaryanto, B.F.Hutabarat Budiman, R.Heriawan, S.M. Pasaribu, Hermanto, A.Iswariyadi, A.Setiyanto, R.Elizabeth, dan R.Aldilah. 2015. “Pemetaan Daya Saing Pertanian Indonesia (Mapping of Agriculture Competitiveness in Indonesia)”, Research Report, Indonesian Center for Agriculture Socio Economic and Policy Studies, Bogor.
Table 1. Mapping of provinces based on regional and agricultural competitiveness
Source: Darmoredjo et. al., 2015
Date submitted: Nov. 17, 2015
Reviewed, edited and uploaded: Nov. 18, 2015