Abstract
Korean agriculture is characterized by small-sized family farming. The FTAs with major trading partners has led to important changes in its agriculture. Particularly Korea’s agricultural sector has high concerns about the government’s participation in Trans-Pacific Partnership (TPP) which is seeking for a high level of liberalization with creating WTO Plus trade rules. Korea’s agriculture with low international competitiveness might be expected to be significantly affected if Korea joins the TPP agreement in the near future. This study analyzes the impact of Korea’s joining TPP on agricultural sector with employing the Korea Agricultural Simulation Model (KASMO) which is jointly developed by the Korea Rural Economic Institute (KREI) and the Food and Agricultural Policy Research Institute (FAPRI). The estimation results show that both the Korean fruits and livestock industries are expected to be decreasing largely in the production value after TPP participation. Major commodities which are expected to be damaged by TPP are dairy products, grapes, beef, pumpkin, and tangerines.
Keywords: Trans-Pacific Partnership(TPP), KASMO , Korea, Agriculture
Introduction
The Trans-Pacific Partnership (TPP) is a 21st century multilateral FTA in progress, aiming for a high level of liberalization to create new global trade order. TPP is based on New Zealand, Singapore, Chile and Brunei’s “Pacific Four” (P4) FTA in June 2005 for economic integration in the Asia-Pacific region. Later, the US joined TPP negotiations, followed by Australia, Peru, Vietnam, Malaysia, Mexico, Canada and Japan. Now 12 nations are participating in TPP talks, and these nations mean the creation of another huge economic bloc that accounts for 38% of the world GDP and 28% of global trade.
After the Korean government formally declared its intention to participate in TPP on November 29, 2013, it has carried forward preliminary bilateral agreements with TPP nations. Due to the government’s intention of participating actively, if TPP negotiations are settled, their effect on Korean agriculture is expected to be big, as regional economies will be integrated on an immense scale.
Currently, Korea's FTAs with nine nations, including the US, Chile and Peru among the 12 TPP nations except Japan and Mexico, have taken effect. Korea also settled FTA with New Zealand, and only the National Assembly’s ratification is needed. Because of this situation, some argue that the nation’s participation in TPP will not affect its agricultural sector much. However, TPP talks basically aim for a high level of trade liberalization through tariff elimination without exception, so Korea’s agriculture with low international competitiveness is expected to be significantly affected. The reason is that the nation’s existing FTAs led to more conservative market opening in its agricultural sector than in other sectors, given the sector’s sensitivity.
Therefore, Korea’s agricultural sector is concerned about considerable negative effects on agriculture, if the nation joins TPP talks and should open its agricultural market at a high level. Accordingly, this paper aims to empirically measure the influence of expanding agricultural market opening due to the nation’s joining TPP on agriculture.
There are many studies for estimating TPP effects based on negotiating conditions and simulation models. A number of comprehensive trade simulation models have been used to estimate or forecast shocks of TPP. For the studies about a GTAP simulation models, Petri and Plummer (2012) estimated the Korea’s annual income could be increased by 4.3bilion dollars . Badri Narayanan, G. et al. (2014) conducted the impacts of TPP in India economy situation using the several scenarios in tariff reduction under Trans-Pacific Partnership on various macro and trade variables by using GTAP database. Choi, Sei-kyun et al. (2012) suggested Korea’s agri-forecasts using the volumes of trade and analysis of various negotiation FTA’s.
Situation of agricultural trade between Korea and TPP partners
As of 2013, Korea’s total agro-food trade value is US$32.3 billion. Among that, while exports are about US$6.3 billion, imports are about US$26 billion, so the nation’s agro-food trade deficit is around US$19.7 billion. Korea is one of the large agricultural importers, and has recorded the chronic trade deficit in agro-food trade.
Korea’s agro-food trade value with the 12 TPP nations is about US$14.1 billion as of 2013. Among that, while its agricultural imports are about US$11.4 billion, exports are about US$2.7 billion. That is, in the nation’s agro-food trade with TPP nations, import accounts for 81% and export accounts for 19%, indicating the agro-food trade deficit of around US$8.7 billion. As of 2013, agricultural imports from TPP nations account for about 44.0% of Korea’s total agro-food imports, and agricultural exports to the TPP nations account for about 42.3% of its total agro-food exports.
Table 1. Situation of agricultural trade between Korea and TPP partners
Unit: 1,000 dollars (USD), %
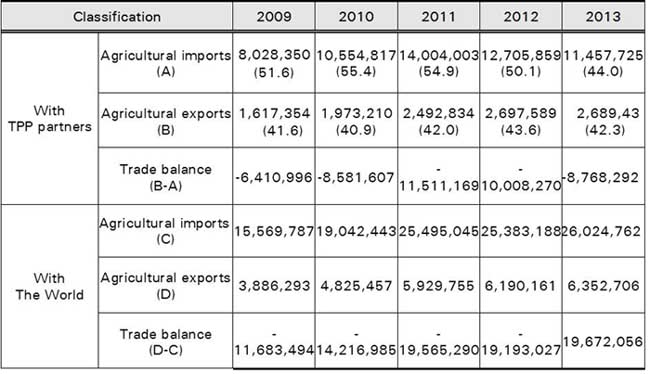
Source: UN Comtrade (www.uncomtrade.org)
Note: Figures in parentheses refer to the proportion of TPP nations in Korea’s agricultural imports from and exports to the world.
As for the agro-food trade status between Korea and TPP nations as of 2013, Korea’s trade with traditional agricultural exporters such as the US, Australia, New Zealand, Chile and Canada records large deficits. Among TPP nations, agricultural imports from the US account for about US$5.8 billion, the highest proportion (22.4%), and Korea’s exports to the US account for only about US$0.5 billion, leading to the trade gap of around US$5.3 billion. Korea records an agricultural trade surplus only with Vietnam and Japan but it is insignificant. Particularly, it has recorded the trade deficit with Vietnam in more years.
That is, Korea has recorded agricultural trade deficits with all TPP nations except Japan and Vietnam. Given that agricultural imports from 12 TPP nations are about 4.2 times agricultural exports to them, if the agricultural market is more open after the TPP settlement in the future, more agro-food can be imported from the TPP nations, although there is also a possibility that Korea’s agro-food exports to them will increase.
Table 2. Situation of Korea’s agricultural trade by TPP partner (as of 2013)
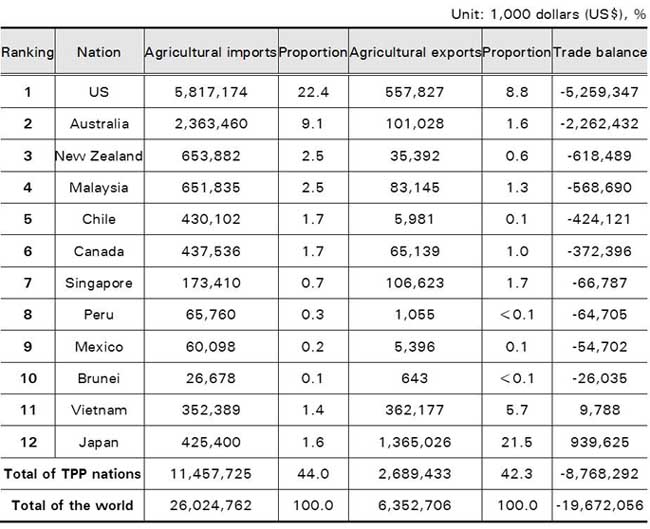
Source: UN Comtrade (www.uncomtrade.org)
Note: Rankings are in order of Korea’s agro-food trade deficit with a partner.
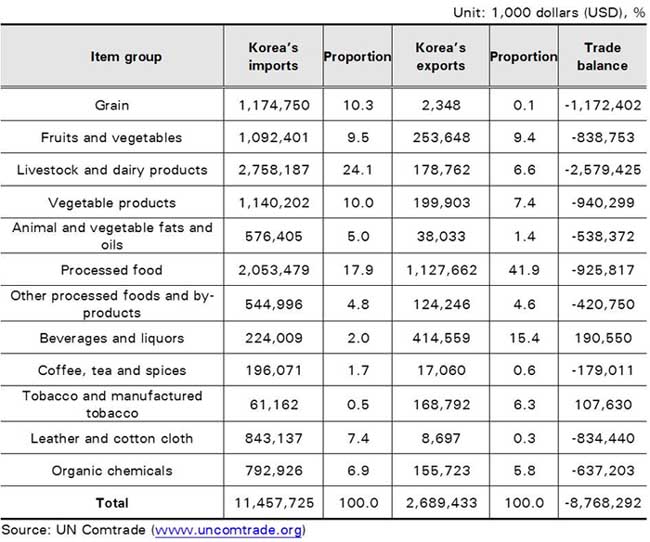
As for item groups of agro-food that Korea mainly imports from TPP nations as of 2013, imports of livestock and dairy products (HS Code 1-5) are around US$2,758 million. It explains the largest part accounting for 24.1% of total imports from TPP partners, followed by imports of processed food (HS Code 16-21) about US$2,053 million and grain imports (HS Code 10) about US$1,175 million. Among agro-food’s subcategories, beef and pork have a high percentage about 16.3% of total imports from TPP partners.
On the other hand, as for item groups of agro-food that Korea mainly exports to TPP partners as of 2013, exports of processed food (HS Code 16-21) are around 1,128 million dollars, having the highest percentage about 41.9%; exports of beverages and liquors (HS Code 22) are about 415 million dollars, and exports of fruits and vegetables (HS Code 6-8) are about 254 million dollars, of great importance. Among agro-food’s subcategories, processed foods such as unclassified preparations, sweets and bakery products, and beverages and liquors such as fermented and distilled liquors and alcohol-free drinks have a high percentage of exports to TPP nations.
In agricultural trade with TPP partners, Korea’s trade deficit of livestock and dairy products was around US$2,579 million, the largest deficit, and grain’s deficit was about US$1,172 million. Thus, if Korea joins TPP and eliminates tariffs on these items, the biggest damage is expected in these sectors.
Table 3. Situation of Korea’s agricultural trade with TPP nations by item group (as of 2013)
Competitiveness of Korea and TPP partners in agricultural trade
Analytical methodology
Comparative advantage across the international trade can be measured by various indices using import, export and trade statistics. Export competitiveness or international competitiveness of certain nation or specific commodity can be calculated by various methods such as Market Share Index (MSI), direct comparison of unit price competitiveness, Revealed Comparative Advantage Index (RCA), and Comparative Advantage by Nations (CAC) and so on.( Lee, Byoung-hoon et al., 2013)
RCA and MSI indices are evaluated as close to the concept of comparative advantage as reflecting price and quality competitiveness which are relatively easy to measure. Therefore we use RCA and MSI index to analyze international competitiveness by TPP nation in agricultural trade.
The advantages of the RCA index are that it embraces price and quality competitiveness factors and data gathering is relatively easy. The RCA index is expressed as the following equation (1):
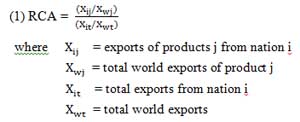
It indicates a comparative advantage (export competitiveness) in export of j product in i nation when the index is greater than 1. We can interpret that the higher index value means the higher export competitiveness. RCA is an index widely used in international economics with respect to its feature representing export competitiveness by comparative advantage of specific product in certain importer nation. However, when it comes to agro-food, many considerations exist such as transportation distance, seasonality, difference in diet patterns, and animal and plant hygiene and inspection. Hence, there is a limit to evaluate export competitiveness of agro-food in a certain importer nation. So in the light of the aim of this paper, we will calculate MSI additionally to measure competitiveness of agricultural trade in TPP markets.
The market share index, measured by using exports in the TPP nations’ market, is an index of each nation’s market share in the evaluation’s target space. First, as for a certain item, a nation’s export value’s percentage of the total export value in the TPP nations’ market is measured.

A higher market share means higher competitiveness. Therefore, if we make .jpg) (nation k’s export market share in product j) into a standard index that meets the hierarchy
(nation k’s export market share in product j) into a standard index that meets the hierarchy .jpg) (condition (Archibugi 2004), its value ranges from 0 to 100, so comparison among TPP nations becomes possible. The MSI index is expressed as the following equation (3):
(condition (Archibugi 2004), its value ranges from 0 to 100, so comparison among TPP nations becomes possible. The MSI index is expressed as the following equation (3):
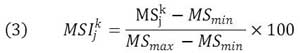
The MSI index is a method that measures competitiveness of a certain product by TPP nation. We can interpret that the higher the index is, the higher the export competitiveness is.
Results of measuring the Revealed Comparative Advantage (RCA) Index
TPP nations show competitiveness in various products in terms of the RCA index of 1 and over (see Table 4). The TPP nations’ competitiveness in food crops is high mainly in rice, barley, potato, sweet potato and soybean. Vietnam and Brunei have competitiveness in rice; Australia and Canada in barley; the US and Canada in potato, frozen potato and soybean; and the US, Japan and Peru in sweet potato.
As for fruits, Chile has competitiveness in most fruit items, while certain products of the US, Peru and New Zealand are competitive. Chile and the US show competitiveness in oranges; Chile and Peru in tangerines; the US, New Zealand, Chile and Japan in apples; Korea and Chile in pears; and Chile, the US, Peru and Mexico in grapes. In the case of kiwi fruit, competitiveness in exports is concentrated on New Zealand and Chile.
As for vegetables, Peru, Chile and Mexico show more competitiveness in major products compared to other nations. Chile, Peru and Mexico have competitiveness in chilies; New Zealand, Chile, Peru and Mexico in onions; and the US, Canada, Australia and Mexico in radish and carrot.
Mexico is competitive in most items of fruit-vegetables, and Korea has competitiveness in certain products such as pear, chili, strawberry, melon and so on. Canada, Chile and Mexico show competitiveness in tomato; the US and Mexico specialize in strawberry exports. Mexico has competitiveness in melons.
As for livestock products, the US, Canada, Australia and New Zealand are competitive. The four nations have competitiveness in beef; the US, Canada and Chile in pork; and the US and Chile in chicken. Australia and New Zealand in the southern hemisphere show competitiveness in mutton among other livestock products, and New Zealand, Chile, Vietnam and Mexico specialize in honey exports. Australia and New Zealand have high international competitiveness in dairy products. Australia shows competitiveness in powdered skim milk, whole milk powder, butter, whey and cheese; New Zealand in all dairy products except whey; and the US in powdered skim milk and whey.
Table 4. RCA measurement results by TPP nation and item (RCA index of 1 and over)
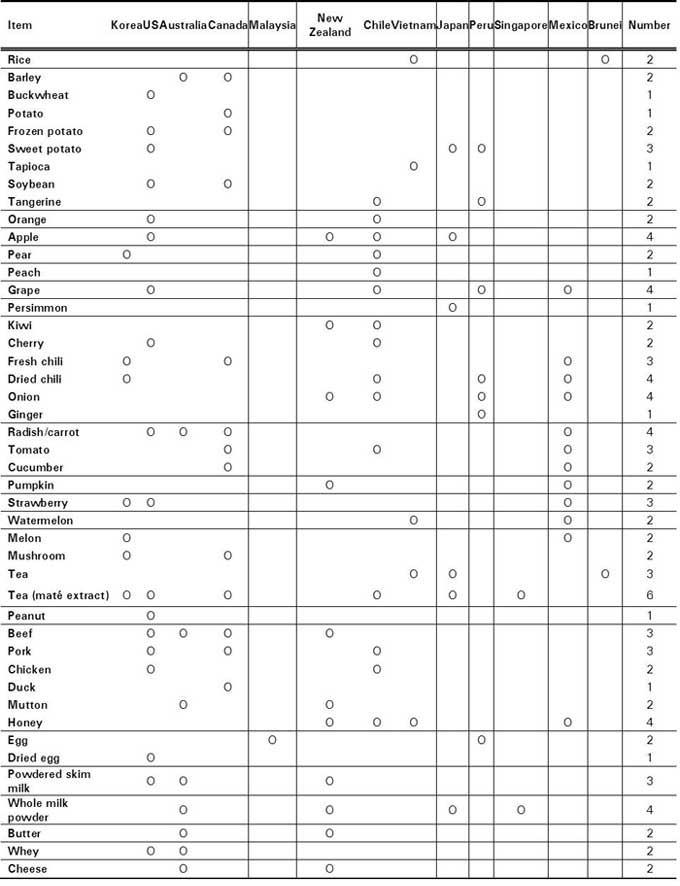
Source: FAO export data (2009-2011 average)
Results of measuring the Market Share Index (MSI)
The nation with the highest share in TPP nations’ grain export market is the US, followed by Australia and Canada. The US has the largest market share in buckwheat, sweet potato and soybean; Canada in potato; and Australia in barley. In case of fruit, the US has the highest market share in all products except grapes and kiwi; Chile in grapes; and New Zealand in kiwi. As for vegetables and fruit vegetables, the US has the largest market share in Welsh onion, radish, carrot, processed tomato and melon; Chile in garlic; Mexico in onion, fresh tomato, cucumber and watermelon; and Canada and Vietnam in mushroom. As for other products, the US and Mexico show the highest market share in peanuts and sesame, respectively. In case of livestock products, the US has the largest market share in pork and chicken. Australia and New Zealand have a high market share in all items of dairy products, and the US in powdered skim milk and whey.
Table 5. MSI measurement results by TPP nation and item

Analysis of the effect of Korea’s TPP participation on its agricultural sector
The analysis model and scenarios
To analyze the effect of Korea’s joining TPP, we employed the Korea Agricultural Simulation Model (KASMO), jointly developed by the Korea Rural Economic Institute (KREI) and the Food and Agricultural Policy Research Institute (FAPRI) for the mid- and long-term outlook for Korea’s agriculture and policy experiments (see Appendix).
Various assumptions are needed to analyze the influence of the nation’s participation in TPP on its agriculture and fisheries. In this paper, most of all, we assumed that the modality, which would be applied to all TPP nations, would be established, and that concessions would be finally negotiated in a way that allows additional market opening for the existing FTA partners among TPP nations based on it. First, for the effect analysis, two scenarios were set up: the baseline scenario and the scenario of Korea’s participation in TPP. The baseline scenario assumes that the nation’s level of agricultural market opening since 2016 is determined by concessions of the existing FTAs which Korea signed so far (including the Korea-EU, Korea-US, Korea-Australia FTA, Korea-Canada FTAs). In the nation’s TPP participation (Korea_TPP) scenario, TPP is assumed to take effect on January 1, 2016, and because TPP talks are in progress, predictable concessions are applied in the form of a scenario.
Table 6. Korea-US FTA & the highest level of the existing FTAs' concessions by comparing major products
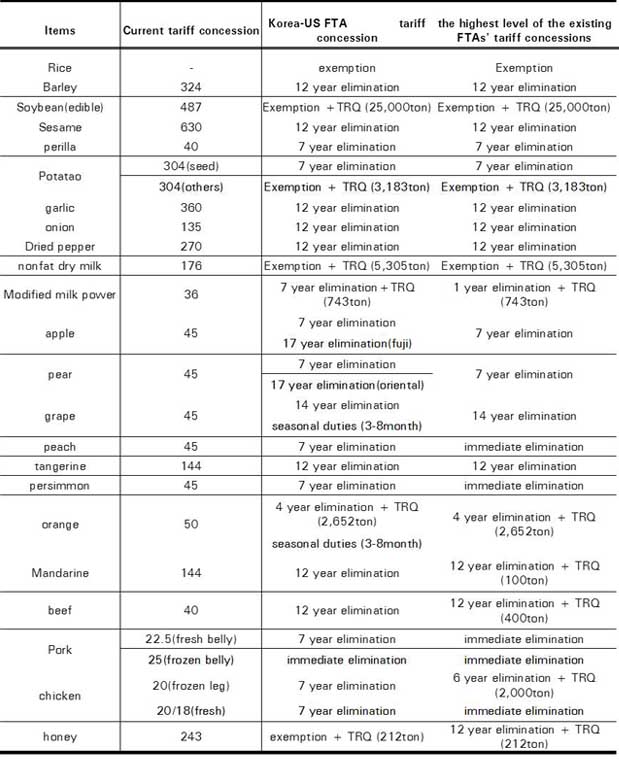
Source: KITA
To examine the TPP’s effect on Korean agricultural production, the difference between the baseline scenario and the Korea_TPP scenario was defined by the change in the production value due to joining TPP, and we measured the effect values for 15 years from 2016 to 2030.Source: KITA
Table 7. Scenarios for the effect analysis of Korea’s participation in TPP
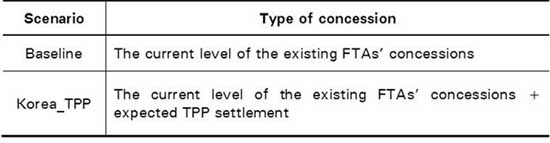
Note: The existing FTAs are assumed to be the Korea-US, Korea-EU, Korea-Australia and Korea-Canada FTAs. The expected TPP settlement is assumed to be the highest level of the existing FTAs’ concessions.
Results of analyzing the effect of joining TPP on Korean agriculture
General analysis
Due to an increase in imports of agricultural and livestock products after TPP participation, Korea’s agricultural production value is expected to decrease a certain degree according to our measurement. The decrease in the agricultural production value is 0.27% of the average gross agricultural production value for 15 years since effectuation (2016-2030).
Table 8. The effect of the decrease in the agricultural production value due to TPP participation compared to a baseline (2016-2030)
Unit: %
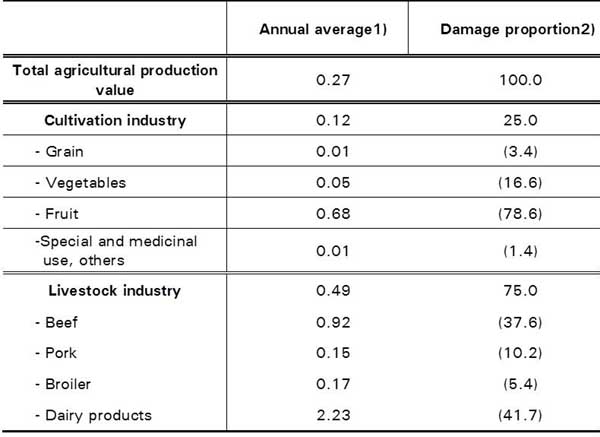
Note: 1) The proportion of the decreasing production value in the average production value by item for 15 years after effectuation. In other words, it means the ratio of annual average decrease in the agricultural production value for 15 years since effectuation (2016-2030), 2) The cultivation industry and the livestock industry’s proportion is their percentage of the total agricultural production value; the parentheses are that sub-products’ proportion is their percentage of each industry.
As for the estimates of the production decrease by category due to TPP participation compared to the baseline scenario, both the cultivation and livestock industries showed large decreases in the production value because of TPP participation. In the cultivation industry, fruit production is expected to drop most, followed by vegetable and grain production. The cultivation industry’s decreasing production value is 0.12% of the industry’s average gross production value for 15 years after effectuation (2016-2030). The livestock industry’s decreasing production value is 0.49% of the industry’s average gross production value for 15 years since effectuation (2016-2030).
Effect Analysis by Product
By item category, damage on dairy products is expected to be biggest, followed by damage on meat, fruits and vegetables. As for the proportion of the decreasing production value to the average baseline production value by item for 15 years after effectuation, dairy products’ proportion is estimated to be the highest (2.23%), followed by the proportion of grapes (1.60%), Korean beef (0.92%), pumpkin (0.65%) and tangerines (0.50%). As beef imports will grow due to price drops resulted from tariff reductions, 0.92% of the average Korean beef production value during 2016-2030 will decline. In case of dairy products, damage on production is expected due to the import increase because of TRQ provision on whole milk powder, powdered skim milk and cheese, and extra import increases due to butter tariff reductions. The damage is estimated to be 2.23% of dairy products’ average production value for 2016-2030. In addition, because TPP nations’ beef production capacity is big, the conclusion of TPP will considerably affect the Korean market. Domestic meat, fruit and fruit vegetables’ direct and indirect consumption replacement due to an increase in meat (beef, etc.) and fruit imports will lead to production reduction.
According to the analysis, imports of grapes, apples, etc. from the existing FTA partners will also increase, so indirect damage is expected including consumption replacement of Korean fruit vegetables and fruit and the change in kinds of crop.
As for the damage proportion by item of a decline in the annual average agricultural production value for the next 15 years according to the Korea TPP scenario compared to the baseline scenario, that of dairy products is the biggest (31.3%), followed by that of Korean beef (28.2%), pork(7.7%), grapes (5.9%), apples (5.4%) and broilers (4.1%).
Table 9. The effect of a decrease in the agricultural production value by major product compared to a baseline due to TPP participation (2016-2030)
Unit: %
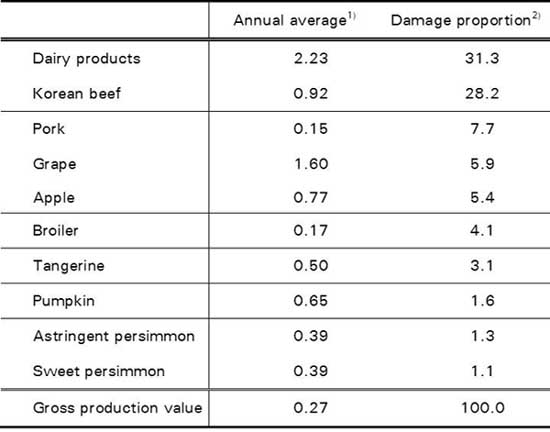
Note 1) The proportion of the decreasing production value in the average production value by item for 15 years after effectuation, in other words, it means the ratio of annual average decrease in the agricultural production value for 15 years since effectuation (2016-2030)
2) The damage’s proportion by product is its percentage of the gross production value.
Conclusion
The Trans-Pacific Partnership (TPP) has pursued for a high level of liberalization to create new global trade order. Now 12 nations are participating in TPP talks, and these members account for 38% of world GDP and 28% of global trade.
The Korean government has formally expressed its intention to join in TPP since 2013. Currently, Korea made FTAs with 10 nations among the 12 TPP nations except Japan and Mexico. But, Korea’s agriculture with low international competitiveness is expected to be significantly affected. Therefore, Korea’s agricultural sector is concerned about the negative impacts due to participating in TPP talks.
In this regard, this study has analyzed the effects of Korea’s joining TPP on its agricultural sector. Particularly, the paper has estimated the influence of expanding agricultural market opening in terms of change in agricultural production.
According to the analytical result on the reduction rate of production value after Korea’s joining in TPP effectuation, dairy sector is estimated to be the highest(2.23%), followed by the grapes (1.60%), Korean beef (0.92%), pumpkin (0.65%) and tangerines (0.50%). In a sense of the damage proportion by item in the annual average agricultural production value, dairy products is the biggest (31.3%), followed by Korean beef (28.2%), pork(7.7%), grapes (5.9%), apples (5.4%) and broilers (4.1%). These will be the most sensitive products with Korea’s joining in TPP
In addition, TPP members seem to require the additional opening in Korean agricultural market. For example, there would be strong pressures on additional rice market opening from rice exporting countries such as USA and Australia through tariff rate quota with zero duty. It has already been shown in Japanese rice market in recent TPP negotiation. In case of livestock products, there are increasing pressures from TPP members excepts USA to open Korean market up to the level of Korea-USA FTA in refrigerated chicken, beef, pork, honey, milk powder, cheese and other dairy products.
In conclusion, benefits of Korea’s joining of TPP in agricultural sector will not be significant. However, losses from additional market opening for agricultural products will be visible and clear. Therefore, it needs to review and monitor thoroughly TPP negotiation results of main countries, particularly between Japan and USA, with assessing negative and positive impacts of additional market opening of agricultural and non-agricultural products.
Appendix: An overview of KREI-KASMO
KREI-KASMO 2013 is the Korean agricultural sector’s partial equilibrium model of mid- and long-term supply and demand, and treats the international market and the non-agricultural sector’s market exogenously in the model. The model’s target items consist of 54 products including 45 of the cultivation industry and 9 of the livestock industry. The items, included in the model, cover 96.7% of the Korean agricultural sector’s production value, 95.9% of the cultivation industry and 98.3% of livestock production as of 2012.
The increasing agricultural imports due to tariff elimination after TPP participation, and the damage value of the decreasing domestic agricultural production value are drawn mainly by using import demand functions. The functions are estimated by nation, item and use (for food or feed). In the functions’ form, rival nations’ import prices and import prices of the nation concerned, to which the domestic price, exchange rate and tariff rate are applied, determine expected agricultural imports by nation. Elasticity of substitution and price elasticity among exporting rivals in the Korean market are formed into a matrix by item, and Korea’s imports from many nations at the same time are measured. In case of TRQ, damage on production is expected due to the import increase because of extra TRQ provision on grain and dairy products. The KREI-KASMO model has assumed that the volume of extra TRQ would be replaced by domestic products directly.
References
Archibugi, Daniel. 2004. “A New Indicator of Technological Capabilities for Developed and Developing Countries,” World Development,32(4): 629-654.
Badri, Narayanan. G., 2014, “An Analysis of TPP: Implication for Indian Economy.” Center for Global Trade Analysis.
Choi, Sei-kyun et al., 2012, “Outlook for the Trans-Pacific Partnership (TPP) and Directions for Responses,” Korea Rural Economic Institute
Im, Jeong-Bin “Characteristics of Trans-Pacific Partnership and Korean Agriculture,” in Korean, Seoul National University, 2013.
Jeong, Min-jeong, 2013, “Major Nations’ Position on TPP Negotiations and Korea’s Response,” National Assembly Research Service
Lee, Byoung-hoon et al., 2013, “A Study of Developing Evaluation Index for Agricultural Competitiveness,” Korea Rural Economic Institute
Park, I., M. Plummer and F. Zhai. 2011. “The Trans-Pacific Partnership and Asia-Pacific Integration: A Quantitative Assessment,” East-West Center Working Paper No. 119, posted 24 October 2011
Peter, A. and Michael G. Plummer., 2012, “The Trans-Pacific Partnership and Asia-Pacific Integration: Policy Implications.” Peterson institute for international economics
KITA FTA portal <http://fta.kita.net>
KOTRA
The Trans-Pacific Partnership Digest < http://tppdigest.org>
Trade Map,
USTR <http://www.ustr.gov>
|
Date submitted: Oct. 6, 2015
Reviewed, edited and uploaded: Oct. 12, 2015
|

An Impact of Korea's TPP Participation on Its Agricultural Sector
Abstract
Korean agriculture is characterized by small-sized family farming. The FTAs with major trading partners has led to important changes in its agriculture. Particularly Korea’s agricultural sector has high concerns about the government’s participation in Trans-Pacific Partnership (TPP) which is seeking for a high level of liberalization with creating WTO Plus trade rules. Korea’s agriculture with low international competitiveness might be expected to be significantly affected if Korea joins the TPP agreement in the near future. This study analyzes the impact of Korea’s joining TPP on agricultural sector with employing the Korea Agricultural Simulation Model (KASMO) which is jointly developed by the Korea Rural Economic Institute (KREI) and the Food and Agricultural Policy Research Institute (FAPRI). The estimation results show that both the Korean fruits and livestock industries are expected to be decreasing largely in the production value after TPP participation. Major commodities which are expected to be damaged by TPP are dairy products, grapes, beef, pumpkin, and tangerines.
Keywords: Trans-Pacific Partnership(TPP), KASMO , Korea, Agriculture
Introduction
The Trans-Pacific Partnership (TPP) is a 21st century multilateral FTA in progress, aiming for a high level of liberalization to create new global trade order. TPP is based on New Zealand, Singapore, Chile and Brunei’s “Pacific Four” (P4) FTA in June 2005 for economic integration in the Asia-Pacific region. Later, the US joined TPP negotiations, followed by Australia, Peru, Vietnam, Malaysia, Mexico, Canada and Japan. Now 12 nations are participating in TPP talks, and these nations mean the creation of another huge economic bloc that accounts for 38% of the world GDP and 28% of global trade.
After the Korean government formally declared its intention to participate in TPP on November 29, 2013, it has carried forward preliminary bilateral agreements with TPP nations. Due to the government’s intention of participating actively, if TPP negotiations are settled, their effect on Korean agriculture is expected to be big, as regional economies will be integrated on an immense scale.
Currently, Korea's FTAs with nine nations, including the US, Chile and Peru among the 12 TPP nations except Japan and Mexico, have taken effect. Korea also settled FTA with New Zealand, and only the National Assembly’s ratification is needed. Because of this situation, some argue that the nation’s participation in TPP will not affect its agricultural sector much. However, TPP talks basically aim for a high level of trade liberalization through tariff elimination without exception, so Korea’s agriculture with low international competitiveness is expected to be significantly affected. The reason is that the nation’s existing FTAs led to more conservative market opening in its agricultural sector than in other sectors, given the sector’s sensitivity.
Therefore, Korea’s agricultural sector is concerned about considerable negative effects on agriculture, if the nation joins TPP talks and should open its agricultural market at a high level. Accordingly, this paper aims to empirically measure the influence of expanding agricultural market opening due to the nation’s joining TPP on agriculture.
There are many studies for estimating TPP effects based on negotiating conditions and simulation models. A number of comprehensive trade simulation models have been used to estimate or forecast shocks of TPP. For the studies about a GTAP simulation models, Petri and Plummer (2012) estimated the Korea’s annual income could be increased by 4.3bilion dollars . Badri Narayanan, G. et al. (2014) conducted the impacts of TPP in India economy situation using the several scenarios in tariff reduction under Trans-Pacific Partnership on various macro and trade variables by using GTAP database. Choi, Sei-kyun et al. (2012) suggested Korea’s agri-forecasts using the volumes of trade and analysis of various negotiation FTA’s.
Situation of agricultural trade between Korea and TPP partners
As of 2013, Korea’s total agro-food trade value is US$32.3 billion. Among that, while exports are about US$6.3 billion, imports are about US$26 billion, so the nation’s agro-food trade deficit is around US$19.7 billion. Korea is one of the large agricultural importers, and has recorded the chronic trade deficit in agro-food trade.
Korea’s agro-food trade value with the 12 TPP nations is about US$14.1 billion as of 2013. Among that, while its agricultural imports are about US$11.4 billion, exports are about US$2.7 billion. That is, in the nation’s agro-food trade with TPP nations, import accounts for 81% and export accounts for 19%, indicating the agro-food trade deficit of around US$8.7 billion. As of 2013, agricultural imports from TPP nations account for about 44.0% of Korea’s total agro-food imports, and agricultural exports to the TPP nations account for about 42.3% of its total agro-food exports.
Table 1. Situation of agricultural trade between Korea and TPP partners
Unit: 1,000 dollars (USD), %
Source: UN Comtrade (www.uncomtrade.org)
Note: Figures in parentheses refer to the proportion of TPP nations in Korea’s agricultural imports from and exports to the world.
As for the agro-food trade status between Korea and TPP nations as of 2013, Korea’s trade with traditional agricultural exporters such as the US, Australia, New Zealand, Chile and Canada records large deficits. Among TPP nations, agricultural imports from the US account for about US$5.8 billion, the highest proportion (22.4%), and Korea’s exports to the US account for only about US$0.5 billion, leading to the trade gap of around US$5.3 billion. Korea records an agricultural trade surplus only with Vietnam and Japan but it is insignificant. Particularly, it has recorded the trade deficit with Vietnam in more years.
That is, Korea has recorded agricultural trade deficits with all TPP nations except Japan and Vietnam. Given that agricultural imports from 12 TPP nations are about 4.2 times agricultural exports to them, if the agricultural market is more open after the TPP settlement in the future, more agro-food can be imported from the TPP nations, although there is also a possibility that Korea’s agro-food exports to them will increase.
Table 2. Situation of Korea’s agricultural trade by TPP partner (as of 2013)
Source: UN Comtrade (www.uncomtrade.org)
Note: Rankings are in order of Korea’s agro-food trade deficit with a partner.
As for item groups of agro-food that Korea mainly imports from TPP nations as of 2013, imports of livestock and dairy products (HS Code 1-5) are around US$2,758 million. It explains the largest part accounting for 24.1% of total imports from TPP partners, followed by imports of processed food (HS Code 16-21) about US$2,053 million and grain imports (HS Code 10) about US$1,175 million. Among agro-food’s subcategories, beef and pork have a high percentage about 16.3% of total imports from TPP partners.
On the other hand, as for item groups of agro-food that Korea mainly exports to TPP partners as of 2013, exports of processed food (HS Code 16-21) are around 1,128 million dollars, having the highest percentage about 41.9%; exports of beverages and liquors (HS Code 22) are about 415 million dollars, and exports of fruits and vegetables (HS Code 6-8) are about 254 million dollars, of great importance. Among agro-food’s subcategories, processed foods such as unclassified preparations, sweets and bakery products, and beverages and liquors such as fermented and distilled liquors and alcohol-free drinks have a high percentage of exports to TPP nations.
In agricultural trade with TPP partners, Korea’s trade deficit of livestock and dairy products was around US$2,579 million, the largest deficit, and grain’s deficit was about US$1,172 million. Thus, if Korea joins TPP and eliminates tariffs on these items, the biggest damage is expected in these sectors.
Table 3. Situation of Korea’s agricultural trade with TPP nations by item group (as of 2013)
Competitiveness of Korea and TPP partners in agricultural trade
Analytical methodology
Comparative advantage across the international trade can be measured by various indices using import, export and trade statistics. Export competitiveness or international competitiveness of certain nation or specific commodity can be calculated by various methods such as Market Share Index (MSI), direct comparison of unit price competitiveness, Revealed Comparative Advantage Index (RCA), and Comparative Advantage by Nations (CAC) and so on.( Lee, Byoung-hoon et al., 2013)
RCA and MSI indices are evaluated as close to the concept of comparative advantage as reflecting price and quality competitiveness which are relatively easy to measure. Therefore we use RCA and MSI index to analyze international competitiveness by TPP nation in agricultural trade.
The advantages of the RCA index are that it embraces price and quality competitiveness factors and data gathering is relatively easy. The RCA index is expressed as the following equation (1):
It indicates a comparative advantage (export competitiveness) in export of j product in i nation when the index is greater than 1. We can interpret that the higher index value means the higher export competitiveness. RCA is an index widely used in international economics with respect to its feature representing export competitiveness by comparative advantage of specific product in certain importer nation. However, when it comes to agro-food, many considerations exist such as transportation distance, seasonality, difference in diet patterns, and animal and plant hygiene and inspection. Hence, there is a limit to evaluate export competitiveness of agro-food in a certain importer nation. So in the light of the aim of this paper, we will calculate MSI additionally to measure competitiveness of agricultural trade in TPP markets.
The market share index, measured by using exports in the TPP nations’ market, is an index of each nation’s market share in the evaluation’s target space. First, as for a certain item, a nation’s export value’s percentage of the total export value in the TPP nations’ market is measured.
A higher market share means higher competitiveness. Therefore, if we make.jpg) (nation k’s export market share in product j) into a standard index that meets the hierarchy
(nation k’s export market share in product j) into a standard index that meets the hierarchy .jpg) (condition (Archibugi 2004), its value ranges from 0 to 100, so comparison among TPP nations becomes possible. The MSI index is expressed as the following equation (3):
(condition (Archibugi 2004), its value ranges from 0 to 100, so comparison among TPP nations becomes possible. The MSI index is expressed as the following equation (3):
The MSI index is a method that measures competitiveness of a certain product by TPP nation. We can interpret that the higher the index is, the higher the export competitiveness is.
Results of measuring the Revealed Comparative Advantage (RCA) Index
TPP nations show competitiveness in various products in terms of the RCA index of 1 and over (see Table 4). The TPP nations’ competitiveness in food crops is high mainly in rice, barley, potato, sweet potato and soybean. Vietnam and Brunei have competitiveness in rice; Australia and Canada in barley; the US and Canada in potato, frozen potato and soybean; and the US, Japan and Peru in sweet potato.
As for fruits, Chile has competitiveness in most fruit items, while certain products of the US, Peru and New Zealand are competitive. Chile and the US show competitiveness in oranges; Chile and Peru in tangerines; the US, New Zealand, Chile and Japan in apples; Korea and Chile in pears; and Chile, the US, Peru and Mexico in grapes. In the case of kiwi fruit, competitiveness in exports is concentrated on New Zealand and Chile.
As for vegetables, Peru, Chile and Mexico show more competitiveness in major products compared to other nations. Chile, Peru and Mexico have competitiveness in chilies; New Zealand, Chile, Peru and Mexico in onions; and the US, Canada, Australia and Mexico in radish and carrot.
Mexico is competitive in most items of fruit-vegetables, and Korea has competitiveness in certain products such as pear, chili, strawberry, melon and so on. Canada, Chile and Mexico show competitiveness in tomato; the US and Mexico specialize in strawberry exports. Mexico has competitiveness in melons.
As for livestock products, the US, Canada, Australia and New Zealand are competitive. The four nations have competitiveness in beef; the US, Canada and Chile in pork; and the US and Chile in chicken. Australia and New Zealand in the southern hemisphere show competitiveness in mutton among other livestock products, and New Zealand, Chile, Vietnam and Mexico specialize in honey exports. Australia and New Zealand have high international competitiveness in dairy products. Australia shows competitiveness in powdered skim milk, whole milk powder, butter, whey and cheese; New Zealand in all dairy products except whey; and the US in powdered skim milk and whey.
Table 4. RCA measurement results by TPP nation and item (RCA index of 1 and over)
Source: FAO export data (2009-2011 average)
Results of measuring the Market Share Index (MSI)
The nation with the highest share in TPP nations’ grain export market is the US, followed by Australia and Canada. The US has the largest market share in buckwheat, sweet potato and soybean; Canada in potato; and Australia in barley. In case of fruit, the US has the highest market share in all products except grapes and kiwi; Chile in grapes; and New Zealand in kiwi. As for vegetables and fruit vegetables, the US has the largest market share in Welsh onion, radish, carrot, processed tomato and melon; Chile in garlic; Mexico in onion, fresh tomato, cucumber and watermelon; and Canada and Vietnam in mushroom. As for other products, the US and Mexico show the highest market share in peanuts and sesame, respectively. In case of livestock products, the US has the largest market share in pork and chicken. Australia and New Zealand have a high market share in all items of dairy products, and the US in powdered skim milk and whey.
Table 5. MSI measurement results by TPP nation and item
Analysis of the effect of Korea’s TPP participation on its agricultural sector
The analysis model and scenarios
To analyze the effect of Korea’s joining TPP, we employed the Korea Agricultural Simulation Model (KASMO), jointly developed by the Korea Rural Economic Institute (KREI) and the Food and Agricultural Policy Research Institute (FAPRI) for the mid- and long-term outlook for Korea’s agriculture and policy experiments (see Appendix).
Various assumptions are needed to analyze the influence of the nation’s participation in TPP on its agriculture and fisheries. In this paper, most of all, we assumed that the modality, which would be applied to all TPP nations, would be established, and that concessions would be finally negotiated in a way that allows additional market opening for the existing FTA partners among TPP nations based on it. First, for the effect analysis, two scenarios were set up: the baseline scenario and the scenario of Korea’s participation in TPP. The baseline scenario assumes that the nation’s level of agricultural market opening since 2016 is determined by concessions of the existing FTAs which Korea signed so far (including the Korea-EU, Korea-US, Korea-Australia FTA, Korea-Canada FTAs). In the nation’s TPP participation (Korea_TPP) scenario, TPP is assumed to take effect on January 1, 2016, and because TPP talks are in progress, predictable concessions are applied in the form of a scenario.
Table 6. Korea-US FTA & the highest level of the existing FTAs' concessions by comparing major products
Source: KITA
To examine the TPP’s effect on Korean agricultural production, the difference between the baseline scenario and the Korea_TPP scenario was defined by the change in the production value due to joining TPP, and we measured the effect values for 15 years from 2016 to 2030.Source: KITA
Table 7. Scenarios for the effect analysis of Korea’s participation in TPP
Note: The existing FTAs are assumed to be the Korea-US, Korea-EU, Korea-Australia and Korea-Canada FTAs. The expected TPP settlement is assumed to be the highest level of the existing FTAs’ concessions.
Results of analyzing the effect of joining TPP on Korean agriculture
General analysis
Due to an increase in imports of agricultural and livestock products after TPP participation, Korea’s agricultural production value is expected to decrease a certain degree according to our measurement. The decrease in the agricultural production value is 0.27% of the average gross agricultural production value for 15 years since effectuation (2016-2030).
Table 8. The effect of the decrease in the agricultural production value due to TPP participation compared to a baseline (2016-2030)
Unit: %
Note: 1) The proportion of the decreasing production value in the average production value by item for 15 years after effectuation. In other words, it means the ratio of annual average decrease in the agricultural production value for 15 years since effectuation (2016-2030), 2) The cultivation industry and the livestock industry’s proportion is their percentage of the total agricultural production value; the parentheses are that sub-products’ proportion is their percentage of each industry.
As for the estimates of the production decrease by category due to TPP participation compared to the baseline scenario, both the cultivation and livestock industries showed large decreases in the production value because of TPP participation. In the cultivation industry, fruit production is expected to drop most, followed by vegetable and grain production. The cultivation industry’s decreasing production value is 0.12% of the industry’s average gross production value for 15 years after effectuation (2016-2030). The livestock industry’s decreasing production value is 0.49% of the industry’s average gross production value for 15 years since effectuation (2016-2030).
Effect Analysis by Product
By item category, damage on dairy products is expected to be biggest, followed by damage on meat, fruits and vegetables. As for the proportion of the decreasing production value to the average baseline production value by item for 15 years after effectuation, dairy products’ proportion is estimated to be the highest (2.23%), followed by the proportion of grapes (1.60%), Korean beef (0.92%), pumpkin (0.65%) and tangerines (0.50%). As beef imports will grow due to price drops resulted from tariff reductions, 0.92% of the average Korean beef production value during 2016-2030 will decline. In case of dairy products, damage on production is expected due to the import increase because of TRQ provision on whole milk powder, powdered skim milk and cheese, and extra import increases due to butter tariff reductions. The damage is estimated to be 2.23% of dairy products’ average production value for 2016-2030. In addition, because TPP nations’ beef production capacity is big, the conclusion of TPP will considerably affect the Korean market. Domestic meat, fruit and fruit vegetables’ direct and indirect consumption replacement due to an increase in meat (beef, etc.) and fruit imports will lead to production reduction.
According to the analysis, imports of grapes, apples, etc. from the existing FTA partners will also increase, so indirect damage is expected including consumption replacement of Korean fruit vegetables and fruit and the change in kinds of crop.
As for the damage proportion by item of a decline in the annual average agricultural production value for the next 15 years according to the Korea TPP scenario compared to the baseline scenario, that of dairy products is the biggest (31.3%), followed by that of Korean beef (28.2%), pork(7.7%), grapes (5.9%), apples (5.4%) and broilers (4.1%).
Table 9. The effect of a decrease in the agricultural production value by major product compared to a baseline due to TPP participation (2016-2030)
Unit: %
Note 1) The proportion of the decreasing production value in the average production value by item for 15 years after effectuation, in other words, it means the ratio of annual average decrease in the agricultural production value for 15 years since effectuation (2016-2030)
2) The damage’s proportion by product is its percentage of the gross production value.
Conclusion
The Trans-Pacific Partnership (TPP) has pursued for a high level of liberalization to create new global trade order. Now 12 nations are participating in TPP talks, and these members account for 38% of world GDP and 28% of global trade.
The Korean government has formally expressed its intention to join in TPP since 2013. Currently, Korea made FTAs with 10 nations among the 12 TPP nations except Japan and Mexico. But, Korea’s agriculture with low international competitiveness is expected to be significantly affected. Therefore, Korea’s agricultural sector is concerned about the negative impacts due to participating in TPP talks.
In this regard, this study has analyzed the effects of Korea’s joining TPP on its agricultural sector. Particularly, the paper has estimated the influence of expanding agricultural market opening in terms of change in agricultural production.
According to the analytical result on the reduction rate of production value after Korea’s joining in TPP effectuation, dairy sector is estimated to be the highest(2.23%), followed by the grapes (1.60%), Korean beef (0.92%), pumpkin (0.65%) and tangerines (0.50%). In a sense of the damage proportion by item in the annual average agricultural production value, dairy products is the biggest (31.3%), followed by Korean beef (28.2%), pork(7.7%), grapes (5.9%), apples (5.4%) and broilers (4.1%). These will be the most sensitive products with Korea’s joining in TPP
In addition, TPP members seem to require the additional opening in Korean agricultural market. For example, there would be strong pressures on additional rice market opening from rice exporting countries such as USA and Australia through tariff rate quota with zero duty. It has already been shown in Japanese rice market in recent TPP negotiation. In case of livestock products, there are increasing pressures from TPP members excepts USA to open Korean market up to the level of Korea-USA FTA in refrigerated chicken, beef, pork, honey, milk powder, cheese and other dairy products.
In conclusion, benefits of Korea’s joining of TPP in agricultural sector will not be significant. However, losses from additional market opening for agricultural products will be visible and clear. Therefore, it needs to review and monitor thoroughly TPP negotiation results of main countries, particularly between Japan and USA, with assessing negative and positive impacts of additional market opening of agricultural and non-agricultural products.
Appendix: An overview of KREI-KASMO
KREI-KASMO 2013 is the Korean agricultural sector’s partial equilibrium model of mid- and long-term supply and demand, and treats the international market and the non-agricultural sector’s market exogenously in the model. The model’s target items consist of 54 products including 45 of the cultivation industry and 9 of the livestock industry. The items, included in the model, cover 96.7% of the Korean agricultural sector’s production value, 95.9% of the cultivation industry and 98.3% of livestock production as of 2012.
The increasing agricultural imports due to tariff elimination after TPP participation, and the damage value of the decreasing domestic agricultural production value are drawn mainly by using import demand functions. The functions are estimated by nation, item and use (for food or feed). In the functions’ form, rival nations’ import prices and import prices of the nation concerned, to which the domestic price, exchange rate and tariff rate are applied, determine expected agricultural imports by nation. Elasticity of substitution and price elasticity among exporting rivals in the Korean market are formed into a matrix by item, and Korea’s imports from many nations at the same time are measured. In case of TRQ, damage on production is expected due to the import increase because of extra TRQ provision on grain and dairy products. The KREI-KASMO model has assumed that the volume of extra TRQ would be replaced by domestic products directly.
References
Archibugi, Daniel. 2004. “A New Indicator of Technological Capabilities for Developed and Developing Countries,” World Development,32(4): 629-654.
Badri, Narayanan. G., 2014, “An Analysis of TPP: Implication for Indian Economy.” Center for Global Trade Analysis.
Choi, Sei-kyun et al., 2012, “Outlook for the Trans-Pacific Partnership (TPP) and Directions for Responses,” Korea Rural Economic Institute
Im, Jeong-Bin “Characteristics of Trans-Pacific Partnership and Korean Agriculture,” in Korean, Seoul National University, 2013.
Jeong, Min-jeong, 2013, “Major Nations’ Position on TPP Negotiations and Korea’s Response,” National Assembly Research Service
Lee, Byoung-hoon et al., 2013, “A Study of Developing Evaluation Index for Agricultural Competitiveness,” Korea Rural Economic Institute
Park, I., M. Plummer and F. Zhai. 2011. “The Trans-Pacific Partnership and Asia-Pacific Integration: A Quantitative Assessment,” East-West Center Working Paper No. 119, posted 24 October 2011
Peter, A. and Michael G. Plummer., 2012, “The Trans-Pacific Partnership and Asia-Pacific Integration: Policy Implications.” Peterson institute for international economics
KITA FTA portal <http://fta.kita.net>
KOTRA
The Trans-Pacific Partnership Digest < http://tppdigest.org>
Trade Map,
USTR <http://www.ustr.gov>
Date submitted: Oct. 6, 2015
Reviewed, edited and uploaded: Oct. 12, 2015