Introduction
The agricultural industry is highly risky. It is risky because the unpredictable weather conditions and recent climate changes cause unstable quality and quantity of agricultural production outputs. It is normal for a farmer to make a living highly dependent on weather conditions. If the weather is good, we live well and so are farmers. On the contrary, however, storms and heavy rains destroy agricultural production putting farmers into bad situations..
Since 1989,the government started to offer bailout loans to farmers who suffered from the loss of natural disaster damages. . Through the aid of loans, those farmers can then reconstruct the land and rehabilitate farming activities as soon as possible in order to remain a normal living standard. In 1990, the government added a 60th clause to the Agricultural Development Act: to authorize the local government to offer cash assistance, grants, or low-interest loans for farmers to resume agricultural productions from natural disaster damages as soon as possible; in the meantime, the central government announced the damage according to the level of impact by natural disasters, including area zones, crops, facilities, and bailout limits. In 1991, Council of Agriculture Executive Yuan (COA) issued Natural Disaster Damage Relief Act to regulate related aids and relief compensations and their finances from the dedicated funds.
Relief content
The main contents according to Natural Disaster Damage Relief Act can be summarized as the following items:
-
Relief aids include cash assistance, compensational grants, and low-interest loans;
-
Natural disasters, by definition, include damages caused by typhoons, heavy rains, frosts, earthquakes, droughts, hails, and/or Foehn winds;
-
Disaster damage owners who are qualified for relief aids include individuals working for productions in the agricultural, forestry, fishery, and animal husbandry sectors. However, those individuals who are not legally registered as land users or who are not consistent with the registered usage of water and facilities are exceptions to claim an aid of relief. The relevant laws should apply without registration or approval, as well as the use of land, water and facilities not inconsistent with the provisions of relevant laws relief;
-
Relief areas are graded into four levels according to regional agricultural output value. The first level areas include Taichung, Changwua, Nantou, Yunlin, Chaiyi County, Tainan, Kaohsiung, and Pingtung. The second level areas include Yilan, Taoyuan, Shinchu, Miaoli, Taitung, and Hualien. The third level area is New Taipei only. The fourth level areas include Lianjiang, Kinmen, Penghu, Keelung, Shinchu, Chiayi City, and Taipei;
-
The entry barrier for qualifying relief aids is different in each level. The barrier of the first level is set at NT$180 million. The second level is NT$100 million. The third level is NT$60 million, and the fourth level is NT$15 million. COA will be able to announce cash grants when the above entry barrier has been met;
-
The entry barrier for qualifying low-interest loans is also different at each level. The barrier of the first level is set at NT$90 million. The second level is NT$50 million. The third level is NT$30 million, and the fourth level is NT$7 million. COA will be able to announce the issuance of low-interest loans when the above entry barrier has been met. However, even if the above entry barrier is not met, when damage level caused by the natural disaster is recognized as serious conditions by the local government, the case can be reported to COA for a special approval of low-interest loans. The limit amount of low-interest loans depends specifically on the crop, with the annual rate of 1.25%;
-
Qualification for special-approved cash assistances: In addition to the above qualifications of claiming relief aids, there are some other contingencies which might be reported to the central related authorities for special approval of case assistances, including the case when single crops suffering from a non-harvest situation is above 30% of the local county or city farming area, or is above 20% of the local township farming area. Moreover, the case of individual farmers who suffer from severe disaster damages can also be reported and investigated by the central and local related authorities to select compensation items with 14 days after the disaster and apply the compensations for special approval from the central related authorities;
-
All applications of disaster relief aids should be proposed to the local township offices within 10 days since COA announces the relief areas. Any application after the deadline of 10 days will not be accepted;
-
For those damages of crops or facilities over 20% of farmland recognized by official investigators, the relief funds will be distributed at the standard amount;
-
The estimated loss of damages is distinguished by the nature of the crop. For short-term crops, if the current rehabilitation or rotation to another harvest crop is still possible, the loss will be calculated at 50% of the total production cost; otherwise, the loss will be calculated by the total production cost by a deduction of the harvest wage. On the other hand, for long-term crops, if the current harvest is entirely unavailable, the loss will be calculated by established expenditure. However, if there is still some harvest in the current period, the loss will be calculated by the total production cost by a deduction of the harvest wage; and
-
According to the production cost of various kinds of crops (e.g., rice, grains, grass, fruit trees, flowers, mushrooms, vegetables, and special crops), the quota of the cash assistance per hectare farmland is different based on the government relief funds. For examples, the cash assistance for rice farmland is NT$18,000 per hectare. However, if the loss damage is less than the entry barrier for the request of cash assistance, farmers can still apply for special approval of a NT$14,000 per hectare compensation if the rice farmland’s is loss above 20% of the total production size.
Analysis on disaster caused by damage loss of crops
Natural disasters might cause overall damage losses in the agricultural sector, which might include losses of the three major categories: agricultural outputs (e.g., crops, animal husbandry products, fishery products, and wood products), losses of privately investing facilities (e.g., farmlands, farming facilities, animal husbandry facilities, fishery facilities), and losses of publicly built facilities (woodland equipment, fishery facilities, water preservations, and irrigation and water conservation). The overall damage losses in the agricultural sector during 1991 and 2013 accumulated as much as NT$240.5 billion, while the major losses were agricultural outputs, accounting for 81% of the overall losses. In other words, the average damage loss of agricultural outputs caused by natural disaster was around NT$10.5 billion during the period.
According to disaster caused by damage loss of crops, there were as many as 11,253 crop disaster reports, with 1.4 million hectares of accumulated damage area (the real area was 380,917 hectares) at a total loss of NT$111.4 billion caused by typhoons and heavy rains all over the island during 1989 and 2013. The amount of loss had a wide range, which could be as low as NT$1 billion or as high as NT$18 billion, while the average was NT$7.4 billion per year, as demonstrated in Table 1.
Table 1. Annual loss statistics caused by natural disasters: year 1999~2013
|
Year
|
Damage area
(Hectare)
|
Damage degree
(%)
|
Actual damage size
(Hectare)
|
Estimated damage loss
(*1000 NTD)
|
|
1999
|
60,671
|
33
|
20,258
|
5,052,526
|
|
2000
|
123,614
|
26
|
31,885
|
9,893,857
|
|
2001
|
77,281
|
27
|
21,249
|
4,709,135
|
|
2002
|
12,252
|
21
|
2,589
|
1,081,348
|
|
2003
|
27,838
|
33
|
9,168
|
3,938,728
|
|
2004
|
79,195
|
27
|
21,582
|
5,134,036
|
|
2005
|
234,208
|
27
|
63,999
|
18,000,771
|
|
2006
|
44,776
|
20
|
9,157
|
3,137,993
|
|
2007
|
153,538
|
28
|
43,025
|
10,637,125
|
|
2008
|
189,871
|
26
|
50,006
|
12,559,055
|
|
2009
|
120,582
|
29
|
34,903
|
10,893,704
|
|
2010
|
78,074
|
30
|
23,215
|
8,069,760
|
|
2011
|
57,301
|
27
|
15,679
|
3,146,149
|
|
2012
|
63,659
|
21
|
13,111
|
5,545,099
|
|
2013
|
78,371
|
27
|
21,091
|
9,481,411
|
|
Total
|
1,401,231
|
-
|
380,917
|
111,450,777
|
|
Per Year Averaged
|
93,415
|
27
|
25,394
|
7,430,052
|
Source: 2013 Annual Report of Agricultural Statistics, Council of Agriculture, Executive Yuan, Taiwan.
Taiwan is located at the region with frequent influences by typhoons and heavy rains, which often cause agricultural damages. The natural disaster loss includes agricultural farming, forestry, fishery, and livestock husbandry, in addition to damages of farm fields, soil and water conservation, and damage of agricultural and fishery facilities. The major loss has been crop damages, accounting for nearly 90% of all damage categories. Table 2 shows that the total loss caused by natural disaster amounted to NT$112.8 billion during 1999 and 2013, in which the most, 75%, was caused by typhoons, while the next damage caused by heavy rains and frosts were 11% and 7%, respectively.
Table 2. Natural disasters and loss damages: year 1999~2013
|
Disaster category
|
Damage area
(Hectare)
|
Damage degree
(%)
|
Actual samage size
(Hectare)
|
Estimated damage loss
(*1000 NTD)
|
Category percentage
( % )
|
|
Typhoon
|
1,097,660
|
27
|
297,002
|
84,905,723
|
75
|
|
Heavy rain
|
204,229
|
25
|
51,266
|
12,065,040
|
11
|
|
Frost
|
79,935
|
33
|
25,987
|
8,121,180
|
7
|
|
Earthquake
|
8,267
|
34
|
2,846
|
1,305,683
|
1
|
|
Drought
|
2,341
|
42
|
972
|
632,267
|
1
|
|
Hail
|
4,422
|
6
|
264
|
108,165
|
0
|
|
Foehn Wind
|
15,679
|
31
|
4,895
|
4,579,309
|
4
|
|
Others *
|
11,360
|
31
|
3,526
|
1,156,963
|
1
|
|
Total
|
1,423,892
|
27
|
386,756
|
111,450,777
|
100
|
*: Others include damages caused by cold fronts, thunderstorms, pears grafting, pests, abnormal climate, tornadoes, weird wind conditions.
Source: 2013 Annual Report of Agricultural Statistics, Council of Agriculture, Executive Yuan, Taiwan
The open-air environment of agricultural production is highly dependent on the weather conditions, while the sudden change of weather is the major source of crop damages. Through the years, natural disasters which caused the most damage in crops, which might be correlated with the most commonly farming crop in Taiwan is rice. The next damage in plants includes pear, banana, papaya, and vegetables, and so on (Table 3).
Table 3. Damage of crops by natural disasters: year 1999~2013
|
Crops
|
Damage area
(Hectare)
|
Damage degree
(%)
|
Actual damage size
(Hectare)
|
Estimated damage loss
(*1000 NTD)
|
Crops percentage
( % )
|
|
Rice
|
441,067
|
25
|
109,072
|
11,671,944
|
10.34
|
|
Pear
|
40,654
|
34
|
13,672
|
8,532,635
|
7.56
|
|
Banana
|
73,174
|
29
|
20,864
|
7,387,086
|
6.54
|
|
Papaya
|
22,981
|
27
|
6,174
|
6,317,956
|
5.60
|
|
Vegetable
|
74,980
|
29
|
21,735
|
6,058,584
|
5.37
|
|
Annona squamosal
|
40,982
|
22
|
9,114
|
4,831,257
|
4.28
|
|
Watermelon
|
47,100
|
38
|
17,817
|
4,302,283
|
3.81
|
|
Diospyros
|
21,991
|
27
|
5,975
|
4,112,834
|
3.64
|
|
Grape
|
15,630
|
29
|
4,462
|
3,191,459
|
2.83
|
|
Wax apple
|
23,343
|
34
|
7,989
|
3,169,798
|
2.81
|
|
Bamboo shoot
|
50,773
|
21
|
10,520
|
2,839,792
|
2.52
|
|
Guava
|
27,807
|
21
|
5,787
|
2,639,950
|
2.34
|
|
Scallion
|
13,389
|
26
|
3,490
|
2,584,625
|
2.29
|
|
Mango
|
26,137
|
33
|
8,672
|
2,444,121
|
2.17
|
|
Chinese honey orange
|
20,658
|
23
|
4,764
|
2,020,105
|
1.79
|
|
Tea
|
15,600
|
23
|
3,517
|
1,975,230
|
1.75
|
|
Muskmelon
|
19,385
|
32
|
6,294
|
1,967,611
|
1.74
|
|
Other flowers
|
4,891
|
28
|
1,372
|
1,858,129
|
1.65
|
|
Jujube
|
9,853
|
26
|
2,572
|
1,635,655
|
1.45
|
|
Strawberry
|
2,417
|
35
|
853
|
1,619,541
|
1.43
|
|
Pomelo
|
14,111
|
31
|
4,444
|
1,617,509
|
1.43
|
|
Agricultural facilities
|
12,893
|
28
|
3,621
|
1,610,449
|
1.43
|
|
Tomato
|
6,409
|
33
|
2,113
|
1,489,650
|
1.32
|
|
Peach
|
4,606
|
33
|
1,513
|
1,433,153
|
1.27
|
|
Peanut
|
67,505
|
22
|
14,760
|
1,405,903
|
1.25
|
|
Corn
|
29,589
|
30
|
8,870
|
1,074,032
|
0.95
|
|
Orange
|
7,817
|
35
|
2,740
|
1,070,764
|
0.95
|
|
Cabbage
|
5,286
|
33
|
1,763
|
1,029,260
|
0.91
|
|
Other varieties of orange
|
9,711
|
25
|
2,438
|
1,028,205
|
0.91
|
|
Longan
|
20,258
|
29
|
5,836
|
1,026,454
|
0.91
|
|
Taro
|
8,568
|
27
|
2,353
|
1,000,291
|
0.89
|
|
Pineapple
|
6,006
|
24
|
1,465
|
985,398
|
0.87
|
|
Tankan
|
6,696
|
23
|
1,565
|
922,614
|
0.82
|
|
Shaddock
|
8,381
|
43
|
3,597
|
889,594
|
0.79
|
|
Cauliflower
|
4,085
|
35
|
1,439
|
792,594
|
0.70
|
|
Bitter melon
|
5,671
|
30
|
1,710
|
747,329
|
0.66
|
|
Litchi
|
12,521
|
29
|
3,576
|
725,317
|
0.64
|
|
Sweet potato
|
11,359
|
25
|
2,801
|
641,510
|
0.57
|
|
Sugarcane
|
2,473
|
27
|
671
|
587,328
|
0.52
|
|
Other special crops
|
7,280
|
25
|
1,790
|
545,996
|
0.48
|
|
Taiwanese orange
|
12,959
|
20
|
2,646
|
541,083
|
0.48
|
|
Onion
|
2,606
|
39
|
1,008
|
528,768
|
0.47
|
|
Other fruits
|
5,998
|
25
|
1,502
|
510,021
|
0.45
|
|
Cucumbers
|
5,882
|
74
|
4,336
|
482,925
|
0.43
|
|
Areca
|
13,703
|
15
|
2,115
|
460,277
|
0.41
|
|
Apple
|
1,014
|
40
|
402
|
422,956
|
0.37
|
|
Ginger
|
1,674
|
29
|
481
|
410,529
|
0.36
|
|
Radish
|
3,913
|
34
|
1,340
|
359,960
|
0.32
|
|
Carambole
|
3,735
|
24
|
901
|
358,467
|
0.32
|
|
Leek
|
3,584
|
24
|
843
|
357,155
|
0.32
|
|
Forage grass
|
5,859
|
29
|
1,688
|
345,014
|
0.31
|
|
Small beans
|
9,539
|
46
|
4,399
|
340,767
|
0.30
|
|
Rag gourds
|
4,885
|
22
|
1,096
|
339,232
|
0.30
|
|
Feed ( hard ) corn
|
21,549
|
26
|
5,598
|
301,858
|
0.27
|
|
Chinese cabbage
|
2,535
|
29
|
723
|
295,867
|
0.26
|
|
Muskmelons
|
3,335
|
32
|
1,069
|
265,164
|
0.23
|
|
Vacuum-packed Mushrooms
|
163
|
34
|
55
|
264,826
|
0.23
|
|
Sweet pepper
|
1,348
|
38
|
511
|
261,051
|
0.23
|
|
Rose
|
421
|
23
|
97
|
235,677
|
0.21
|
|
Edamame
|
6,964
|
27
|
1,866
|
234,279
|
0.21
|
|
Plum
|
2,646
|
30
|
805
|
229,349
|
0.20
|
|
Carrot
|
3,431
|
36
|
1,223
|
226,332
|
0.20
|
|
Garlic
|
3,772
|
22
|
820
|
224,723
|
0.20
|
|
Water bamboo
|
808
|
40
|
320
|
217,771
|
0.19
|
|
Chrysan-themum
|
1,025
|
33
|
337
|
216,011
|
0.19
|
|
Loquat
|
1,465
|
27
|
390
|
210,440
|
0.19
|
|
Chinese mustard
|
2,967
|
29
|
868
|
203,758
|
0.18
|
|
Sugar cane
|
7,081
|
32
|
2,283
|
197,436
|
0.17
|
|
Passion fruit
|
1,952
|
19
|
375
|
194,108
|
0.17
|
|
Other grains
|
6,191
|
36
|
2,235
|
172,320
|
0.15
|
|
Eggplant
|
2,228
|
23
|
505
|
156,997
|
0.14
|
|
Lemon
|
2,896
|
22
|
626
|
138,553
|
0.12
|
|
White gourds
|
1,276
|
37
|
467
|
137,523
|
0.12
|
|
Milo ( sorghum )
|
2,182
|
42
|
924
|
128,361
|
0.11
|
|
Day lily
|
2,129
|
37
|
781
|
121,758
|
0.11
|
|
Oriental sesame
|
4,260
|
44
|
1,876
|
106,974
|
0.09
|
|
Yam
|
338
|
33
|
110
|
102,671
|
0.09
|
|
Yard-long beans
|
1,539
|
25
|
388
|
97,210
|
0.09
|
|
Potato
|
914
|
34
|
308
|
96,636
|
0.09
|
|
Asparagus
|
1,823
|
26
|
472
|
87,674
|
0.08
|
|
Gladiolus
|
307
|
28
|
86
|
86,087
|
0.08
|
|
Peas ( peas )
|
628
|
45
|
285
|
85,454
|
0.08
|
|
Plum
|
1,876
|
38
|
719
|
77,675
|
0.07
|
|
Nursery
|
932
|
22
|
210
|
73,842
|
0.07
|
|
Coconut
|
2,137
|
30
|
643
|
67,147
|
0.06
|
|
Seedling
|
152
|
37
|
56
|
58,359
|
0.05
|
|
Tobacco
|
308
|
29
|
89
|
51,080
|
0.05
|
|
Lisianthus
|
16
|
31
|
5
|
9,143
|
0.01
|
|
Shiitake Mushrooms
|
15
|
53
|
8
|
7,200
|
0.01
|
|
Olives
|
13
|
31
|
4
|
875
|
0.00
|
|
Green beans
|
34
|
9
|
3
|
322
|
0.00
|
|
Mushrooms
|
0
|
20
|
0
|
38
|
0.00
|
Source: 2013 Annual Report of Agricultural Statistics, Council of Agriculture, Executive Yuan, Taiwan
The geographic distribution of natural disaster damage is varied because of the different weather conditions across areas. As Table 4 shows, Taichung was the area with the most damages during 1999 and 2013, probably because of the high value pears. The second most damaged area was Yunlin, probably because of the rice and vegetables. The top five major areas suffering from natural disasters were Taichung, Yunlin, Kaohsiung, Pingtung, and Changhua, accounting for more than half loss across all areas. On the one hand, the south and central regions are the major agricultural production areas. On the other hand, these regions might have the most probability in terms of typhoon routes.
Nevertheless, the amount of loss was generally not equal to the amount of relief aid because the damage loss should achieve a certain barrier of aid application. Moreover, the amount of relief aid was not distributed by the damage intensity but followed by the cash relief standard operation barrier. Therefore, the top five areas which received the most relief aid amount included Yunlin, Tainan, Pingtung, Taichung, and Chiayu. On the contrary, Kaohsiung and Changhua were among the top five areas with natural disaster loss while they were not among the top five areas which received relief aids. As a consequence, it is necessary to modify the standard procedure of natural disaster reviews regarding the natural disaster loss areas, application barrier of the relief aids, and the amount to compensate the losses.
Table 4. Natural disaster damage area and relief amount by: year 1999~2013
|
City/ county
|
Damage area
(Hectare)
|
Damage Degree
(%)
|
Real Damage area
( Hectare)
|
Estimated Damage losses
(*1000 NTD)
|
Loss Percentage
(%)
|
Amount of Aids
(*1000 NTD)
|
Aid Percentage
(%)
|
Taiwan |
1,423,892
|
27
|
386,756
|
112,874,329
|
100.00
|
26,748,833
|
100.00
|
Taichung |
107,942
|
28
|
30,283
|
15,598,477
|
13.82
|
2,776,764
|
10.38
|
Yunlin |
240,327
|
23
|
54,740
|
11,850,220
|
10.50
|
4,254,374
|
15.90
|
Kaohsiung |
93,566
|
30
|
28,004
|
11,598,538
|
10.28
|
1,691,007
|
6.32
|
Pingtung |
116,039
|
30
|
35,342
|
11,413,908
|
10.11
|
2,978,985
|
11.14
|
Changhua |
160,067
|
28
|
44,627
|
8,921,330
|
7.90
|
2,008,529
|
7.51
|
Miaoli |
61,625
|
27
|
16,389
|
8,810,066
|
7.81
|
1,559,072
|
5.83
|
Tainan |
154,928
|
27
|
41,709
|
8,228,850
|
7.29
|
3,154,248
|
11.79
|
Chiayi |
188,656
|
23
|
43,424
|
8,219,929
|
7.28
|
2,672,482
|
9.99
|
Nantou |
76,403
|
24
|
18,332
|
7,841,508
|
6.95
|
1,148,764
|
4.29
|
Taitung |
77,889
|
26
|
20,386
|
7,595,534
|
6.73
|
2,148,757
|
8.03
|
|
Hualien
|
65,294
|
39
|
25,578
|
4,881,174
|
4.32
|
1,278,821
|
4.78
|
|
Yilan
|
28,321
|
27
|
7,717
|
2,846,294
|
2.52
|
606,827
|
2.27
|
|
Hsinchu
|
18,080
|
39
|
7,084
|
2,629,559
|
2.33
|
316,724
|
1.18
|
|
Taoyuan
|
13,679
|
27
|
3,639
|
909,342
|
0.81
|
78,206
|
0.29
|
|
New Taipei City
|
8,204
|
29
|
2,404
|
751,396
|
0.67
|
16,035
|
0.06
|
|
Kinmen
|
3,786
|
52
|
1,955
|
282,039
|
0.25
|
18,364
|
0.07
|
|
Chiayi City
|
4,993
|
21
|
1,055
|
180,870
|
0.16
|
25,005
|
0.09
|
|
Taipei
|
2,249
|
34
|
768
|
170,816
|
0.15
|
205
|
0.00
|
|
Penghu
|
898
|
348
|
3,122
|
101,605
|
0.09
|
14,937
|
0.06
|
|
Keelung
|
254
|
18
|
46
|
21,745
|
0.02
|
186
|
0.00
|
|
Hsinchu
|
694
|
22
|
154
|
21,130
|
0.02
|
541
|
0.00
|
Source: 2013 Annual Report of Agricultural Statistics, Council of Agriculture, Executive Yuan, Taiwan
Relief analysis
The government aids to natural disaster damage losses mainly include cash relief and low-interest loans. The accumulated amount of cash relief was NT$32.3 billion during 1999 and 2013 period, averaging NT$2.156 billion per year. The low-interest loans achieved NT$7.1 billion in total in the same period years, and averaged NT$0.54 billion per year. Based on the basic interest rate of banks, the government in fact spent NT$0.145 billion for interest subsidization, or NT$11 million per year.
Table 5. Cash relief and low-interest loans for natural disaster damage loss: 1999-2013
Source: 2013 Annual Report of Agricultural Statistics, Council of Agriculture, Executive Yuan, Taiwan; 2013 Financial Statistics, Central Bank, Taiwan.
Because of unstable and unpredictable weather changes, the cash relief to agricultural damage losses caused by natural disasters are also varied. As Figure 1 shows, there seems to be no trend at all. However, the variations still go at the same direction between the natural disaster damage loss and cash relief. The amount of cash relief is averaged at 26% of the natural disaster damage loss, while the percentages changed often because of the areas and the damaged crops.
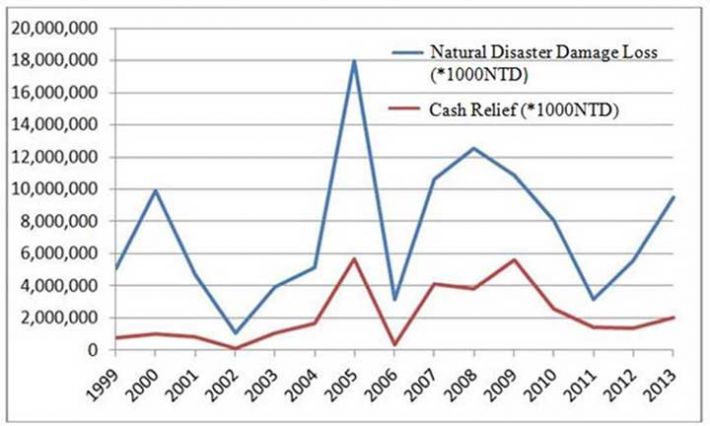
Fig. 1. Damage caused by agricultural natural disaster and cash relief: 1999~2013
Source: 2013 Annual Report of Agricultural Statistics, Council of Agriculture, Executive Yuan, Taiwan.
As Table 6 shows, among all agricultural disasters, the most severe damage has been caused by typhoons, which also claimed the most government aid funds, whereas damages caused by heavy rains and frosts ranked next to typhoons.
Table 6. Natural disaster damages and cash reliefs
|
Disaster type
|
Damage loss (*1000 NTD)
|
Percent
(%)
|
Amount of aid (*1000 NTD)
|
Percent
(%)
|
|
Typhoon
|
84,905,723
|
75
|
20,745,450
|
78
|
|
Heavy Rain
|
12,065,040
|
11
|
3,593,636
|
13
|
|
Frost / Cold Damage/ Low Temperature
|
8,121,180
|
7
|
1,567,476
|
6
|
|
Earthquake
|
1,305,683
|
1
|
233,896
|
1
|
|
Other*
|
1,156,963
|
1
|
214,076
|
1
|
|
Drought
|
632,267
|
1
|
40,426
|
0
|
|
Hail
|
108,165
|
0
|
0
|
0
|
|
Foehn Wind
|
4,579,309
|
4
|
353,872
|
1
|
|
Total
|
112,874,329
|
100
|
26,748,833
|
100
|
*: Others include damages caused by cold fronts, thunderstorms, pears grafting, pests, abnormal climate, tornadoes, weird conditions of the wind.
Source: 2013 Annual Report of Agricultural Statistics, Council of Agriculture, Executive Yuan, Taiwan.
Reviews and suggestions for natural disaster relief system
According to the above statistic data and practice, the current Natural Disaster Damage Relief Act still raised some problems regarding relief mechanisms, which demands a further review as follows.
1. The recognition of disaster Losses
a). The damage extent
The current Act regulates that the total damage loss caused by natural disasters should be qualified to the relief aid when it passes the required barrier of applications to cash relief or low-interest loans. Meanwhile, the damage loss of crops or agricultural facilities owned by an individual farmer should be over 20% to be qualified for the aid. The recognition of the damage loss is obviously a key issue. However, because neither crop productions nor agricultural facilities are registered, the government cannot access the post-disaster data by comparing this with the regular situation, which usually causes a lot of debates on the damage extent. If the damage loss does not pass the 20% barrier, it is possible to over-estimate the small scale of damage loss. On the other hand, the damage extent is irrelevant to the relief amount under the 20% barrier of damage recognition, so that it is also possible to under-estimate the big scale damage loss. In addition to the individual farmer, the damage extent is also correlated with the overall damage loss of the entire city/ county. Thus, the recognition of damage loss might adopt a loose standard in order to pass the barrier of relief aid.
b). Recognition of timing
The on-site survey of disaster damage loss should be done as soon as possible in order not to postpone rehabilitation. Within a short time period, the recognition process should go through the first-line officers to do the on-site survey and then report a confirmation to the local government, and further report a consolidated report to Agriculture and Food Agency (AFA). If the disaster relief barrier is met, the local Agricultural Research and Extension Center and the local branch of AFA will re-confirm the disaster extent by a further randomly selected sites of survey. These sequential processes will cost a lot of time and efforts, which might postpone the timing of re-covering or even cause a further damage loss.
2. The aid delivery
a) Inconsistent identification
As the city and county passed the relief barrier, the local natural disaster damage will get aids no matter the extent of loss. The extreme case might happen when some high-value crops in an area suffer from severe damages, while all other crops suffer from low extent of damages can also get the relief aid. The unfair issue might also occur when only individual farmers can get the relief aid, while agribusinesses cannot. The government also does not check the farmers’ identifications as tenants and landlords, which might be a hidden problem if the relief aid goes into the landlords’ pockets.
b) Amount of aid
The amount of cash relief aid is also a big issue. Because the cash relief aid only captures a partial loss caused by natural disaster, the income of farmers is not able to be secured, not mentioning whether the production cost can be covered. Ideally, the cash relief should be correlated to the extent of damage loss. However, the current relief barrier checks solely on whether 20% is met. It would be better to further classify the damage extent, such as 0~20%, 20%~50%, and 50% and above, which is more practical to deliver the purpose of government policy.
Conclusion
Since the beginning of natural disaster relief in 1991 in Taiwan, the government has approved and delivered the relief aid as much as NT$37.3 billion for damage losses of agricultural production, equal to NT$1.6 billion per year. Compared with the real damage loss total amount of NT$240.5 billion, or averaged NT$10.5 billion per year, caused by natural disasters in the same period, the relief aid was absolutely too short to aid farmers’ income losses. Under the current obvious trend of climate change, the agriculture sector has been more vulnerable and prone to production risks. Given that the government implements the natural disaster relief system, the relief aid has been able to offer assistance to rehabilitation rather than compensate to their income losses. Thus, the natural disaster relief is not an effective system to secure or support farmers’ incomes under potential disaster exposures.
The resolution to secure farmers’ incomes from disaster losses, therefore as should be delivered by agricultural insurances as proposed. This is not just for disaster damage loss coverage. Agricultural insurances, in fact, can be used as effective tool for risk management in the agricultural production sector. Compared with many other developing and developed countries which are already in agricultural insurances for crops, the trail of the crop insurance in Taiwan is right on its way in 2015. The late start of a more complete agricultural safety net, however, is still expected to stabilize farmers’ incomes and agricultural production in aligning with the existing natural disaster relief system operating in the recent decade.
|
Date submitted: July 3, 2015
Reviewed, edited and uploaded: July 6, 2015
|

Review and Analysis of Agricultural Natural Disaster Relief System
Introduction
Natural disasters might cause overall damage losses in the agricultural sector, which might include losses of the three major categories: agricultural outputs (e.g., crops, animal husbandry products, fishery products, and wood products), losses of privately investing facilities (e.g., farmlands, farming facilities, animal husbandry facilities, fishery facilities), and losses of publicly built facilities (woodland equipment, fishery facilities, water preservations, and irrigation and water conservation). The overall damage losses in the agricultural sector during 1991 and 2013 accumulated as much as NT$240.5 billion, while the major losses were agricultural outputs, accounting for 81% of the overall losses. In other words, the average damage loss of agricultural outputs caused by natural disaster was around NT$10.5 billion during the period.
According to disaster caused by damage loss of crops, there were as many as 11,253 crop disaster reports, with 1.4 million hectares of accumulated damage area (the real area was 380,917 hectares) at a total loss of NT$111.4 billion caused by typhoons and heavy rains all over the island during 1989 and 2013. The amount of loss had a wide range, which could be as low as NT$1 billion or as high as NT$18 billion, while the average was NT$7.4 billion per year, as demonstrated in Table 1.
Year
1999
60,671
33
20,258
5,052,526
2000
123,614
26
31,885
9,893,857
2001
77,281
27
21,249
4,709,135
2002
12,252
21
2,589
1,081,348
2003
27,838
33
9,168
3,938,728
2004
79,195
27
21,582
5,134,036
2005
234,208
27
63,999
18,000,771
2006
44,776
20
9,157
3,137,993
2007
153,538
28
43,025
10,637,125
2008
189,871
26
50,006
12,559,055
2009
120,582
29
34,903
10,893,704
2010
78,074
30
23,215
8,069,760
2011
57,301
27
15,679
3,146,149
2012
63,659
21
13,111
5,545,099
2013
78,371
27
21,091
9,481,411
Total
1,401,231
-
380,917
111,450,777
Per Year Averaged
93,415
27
25,394
7,430,052
Source: 2013 Annual Report of Agricultural Statistics, Council of Agriculture, Executive Yuan, Taiwan.
Taiwan is located at the region with frequent influences by typhoons and heavy rains, which often cause agricultural damages. The natural disaster loss includes agricultural farming, forestry, fishery, and livestock husbandry, in addition to damages of farm fields, soil and water conservation, and damage of agricultural and fishery facilities. The major loss has been crop damages, accounting for nearly 90% of all damage categories. Table 2 shows that the total loss caused by natural disaster amounted to NT$112.8 billion during 1999 and 2013, in which the most, 75%, was caused by typhoons, while the next damage caused by heavy rains and frosts were 11% and 7%, respectively.
Source: 2013 Annual Report of Agricultural Statistics, Council of Agriculture, Executive Yuan, Taiwan
The open-air environment of agricultural production is highly dependent on the weather conditions, while the sudden change of weather is the major source of crop damages. Through the years, natural disasters which caused the most damage in crops, which might be correlated with the most commonly farming crop in Taiwan is rice. The next damage in plants includes pear, banana, papaya, and vegetables, and so on (Table 3).
338
33
110
102,671
0.09
Olives
13
31
4
875
0.00
0
20
0
38
0.00
Source: 2013 Annual Report of Agricultural Statistics, Council of Agriculture, Executive Yuan, Taiwan
The geographic distribution of natural disaster damage is varied because of the different weather conditions across areas. As Table 4 shows, Taichung was the area with the most damages during 1999 and 2013, probably because of the high value pears. The second most damaged area was Yunlin, probably because of the rice and vegetables. The top five major areas suffering from natural disasters were Taichung, Yunlin, Kaohsiung, Pingtung, and Changhua, accounting for more than half loss across all areas. On the one hand, the south and central regions are the major agricultural production areas. On the other hand, these regions might have the most probability in terms of typhoon routes.
Nevertheless, the amount of loss was generally not equal to the amount of relief aid because the damage loss should achieve a certain barrier of aid application. Moreover, the amount of relief aid was not distributed by the damage intensity but followed by the cash relief standard operation barrier. Therefore, the top five areas which received the most relief aid amount included Yunlin, Tainan, Pingtung, Taichung, and Chiayu. On the contrary, Kaohsiung and Changhua were among the top five areas with natural disaster loss while they were not among the top five areas which received relief aids. As a consequence, it is necessary to modify the standard procedure of natural disaster reviews regarding the natural disaster loss areas, application barrier of the relief aids, and the amount to compensate the losses.
City/ county
Damage area
(Hectare)
Damage Degree
(%)
Real Damage area
( Hectare)
Estimated Damage losses
(*1000 NTD)
Loss Percentage
(%)
Amount of Aids
(*1000 NTD)
Aid Percentage
(%)
1,423,892
27
386,756
112,874,329
100.00
26,748,833
100.00
107,942
28
30,283
15,598,477
13.82
2,776,764
10.38
240,327
23
54,740
11,850,220
10.50
4,254,374
15.90
93,566
30
28,004
11,598,538
10.28
1,691,007
6.32
116,039
30
35,342
11,413,908
10.11
2,978,985
11.14
160,067
28
44,627
8,921,330
7.90
2,008,529
7.51
61,625
27
16,389
8,810,066
7.81
1,559,072
5.83
154,928
27
41,709
8,228,850
7.29
3,154,248
11.79
188,656
23
43,424
8,219,929
7.28
2,672,482
9.99
76,403
24
18,332
7,841,508
6.95
1,148,764
4.29
694
22
154
21,130
0.02
541
0.00
Source: 2013 Annual Report of Agricultural Statistics, Council of Agriculture, Executive Yuan, Taiwan
Relief analysis
The government aids to natural disaster damage losses mainly include cash relief and low-interest loans. The accumulated amount of cash relief was NT$32.3 billion during 1999 and 2013 period, averaging NT$2.156 billion per year. The low-interest loans achieved NT$7.1 billion in total in the same period years, and averaged NT$0.54 billion per year. Based on the basic interest rate of banks, the government in fact spent NT$0.145 billion for interest subsidization, or NT$11 million per year.
Because of unstable and unpredictable weather changes, the cash relief to agricultural damage losses caused by natural disasters are also varied. As Figure 1 shows, there seems to be no trend at all. However, the variations still go at the same direction between the natural disaster damage loss and cash relief. The amount of cash relief is averaged at 26% of the natural disaster damage loss, while the percentages changed often because of the areas and the damaged crops.
Source: 2013 Annual Report of Agricultural Statistics, Council of Agriculture, Executive Yuan, Taiwan.
As Table 6 shows, among all agricultural disasters, the most severe damage has been caused by typhoons, which also claimed the most government aid funds, whereas damages caused by heavy rains and frosts ranked next to typhoons.
Source: 2013 Annual Report of Agricultural Statistics, Council of Agriculture, Executive Yuan, Taiwan.
Reviews and suggestions for natural disaster relief system
According to the above statistic data and practice, the current Natural Disaster Damage Relief Act still raised some problems regarding relief mechanisms, which demands a further review as follows.
1. The recognition of disaster Losses
a). The damage extent
The current Act regulates that the total damage loss caused by natural disasters should be qualified to the relief aid when it passes the required barrier of applications to cash relief or low-interest loans. Meanwhile, the damage loss of crops or agricultural facilities owned by an individual farmer should be over 20% to be qualified for the aid. The recognition of the damage loss is obviously a key issue. However, because neither crop productions nor agricultural facilities are registered, the government cannot access the post-disaster data by comparing this with the regular situation, which usually causes a lot of debates on the damage extent. If the damage loss does not pass the 20% barrier, it is possible to over-estimate the small scale of damage loss. On the other hand, the damage extent is irrelevant to the relief amount under the 20% barrier of damage recognition, so that it is also possible to under-estimate the big scale damage loss. In addition to the individual farmer, the damage extent is also correlated with the overall damage loss of the entire city/ county. Thus, the recognition of damage loss might adopt a loose standard in order to pass the barrier of relief aid.
b). Recognition of timing
The on-site survey of disaster damage loss should be done as soon as possible in order not to postpone rehabilitation. Within a short time period, the recognition process should go through the first-line officers to do the on-site survey and then report a confirmation to the local government, and further report a consolidated report to Agriculture and Food Agency (AFA). If the disaster relief barrier is met, the local Agricultural Research and Extension Center and the local branch of AFA will re-confirm the disaster extent by a further randomly selected sites of survey. These sequential processes will cost a lot of time and efforts, which might postpone the timing of re-covering or even cause a further damage loss.
2. The aid delivery
a) Inconsistent identification
As the city and county passed the relief barrier, the local natural disaster damage will get aids no matter the extent of loss. The extreme case might happen when some high-value crops in an area suffer from severe damages, while all other crops suffer from low extent of damages can also get the relief aid. The unfair issue might also occur when only individual farmers can get the relief aid, while agribusinesses cannot. The government also does not check the farmers’ identifications as tenants and landlords, which might be a hidden problem if the relief aid goes into the landlords’ pockets.
b) Amount of aid
The amount of cash relief aid is also a big issue. Because the cash relief aid only captures a partial loss caused by natural disaster, the income of farmers is not able to be secured, not mentioning whether the production cost can be covered. Ideally, the cash relief should be correlated to the extent of damage loss. However, the current relief barrier checks solely on whether 20% is met. It would be better to further classify the damage extent, such as 0~20%, 20%~50%, and 50% and above, which is more practical to deliver the purpose of government policy.
Conclusion
Since the beginning of natural disaster relief in 1991 in Taiwan, the government has approved and delivered the relief aid as much as NT$37.3 billion for damage losses of agricultural production, equal to NT$1.6 billion per year. Compared with the real damage loss total amount of NT$240.5 billion, or averaged NT$10.5 billion per year, caused by natural disasters in the same period, the relief aid was absolutely too short to aid farmers’ income losses. Under the current obvious trend of climate change, the agriculture sector has been more vulnerable and prone to production risks. Given that the government implements the natural disaster relief system, the relief aid has been able to offer assistance to rehabilitation rather than compensate to their income losses. Thus, the natural disaster relief is not an effective system to secure or support farmers’ incomes under potential disaster exposures.
The resolution to secure farmers’ incomes from disaster losses, therefore as should be delivered by agricultural insurances as proposed. This is not just for disaster damage loss coverage. Agricultural insurances, in fact, can be used as effective tool for risk management in the agricultural production sector. Compared with many other developing and developed countries which are already in agricultural insurances for crops, the trail of the crop insurance in Taiwan is right on its way in 2015. The late start of a more complete agricultural safety net, however, is still expected to stabilize farmers’ incomes and agricultural production in aligning with the existing natural disaster relief system operating in the recent decade.
Date submitted: July 3, 2015
Reviewed, edited and uploaded: July 6, 2015