ABSTRACT
One of the biggest problems of Korean agriculture is the aging of farmers. Only 14.8% (173,622) of all farms (1,177,318) have operators whose age is less than 50. Although the government has tried to substitute younger farmers for older farmers, the result has been not so successful. The income instability of farm household has been supposed as one of the major causes that hinder the rejuvenation of the agriculture. So far, it is not so certain that a younger farmer’s household income is more unstable than an older farmer’s since a younger farmer can stabilize the household income by earning the better part of his(her) household income from non-farm activities. In the paper, using a panel survey data we show that a younger farmer’s household income is more unstable than older farmer’s.
Key Words: aging of agriculture, income instability, panel survey data
INTRODUCTION
According to the agricultural census in 2010 the average age of Korean farm operators is 62.3 and the largest age group stands at the interval of 70-75. The aging of agriculture causes serious problems such as the decrease of rural population, the reduction of farm size and farm income.
Although many policies have been used to encourage young people to participate in agricultural production, the number of farms operated by young farmers is decreasing every year. Income instability is one of the major causes that make young people turn away from agriculture. In this paper, we try to understand how the income instability causes the aging of Korean agriculture by examining the relationship between the income instability and farm operators’ age.
First, we look into the aging process of Korean agriculture by briefly going over the history of the economy. Second, we present some tables that show the current situation of farms operated by younger farmers such as the distribution of farms by operator’s age and the size of land, the distribution of farm households by farm revenues and crops. Third, using a panel survey data, we study the relationship between the income instability of the farms and the age of farm operators.
ECONOMIC GROWTH AND THE AGING OF KOREAN AGRICULTURE
Take-off of the Economy (1962-1976)[1]
The Korean economy recorded a rapid growth in 1960’s and 1970’s. GDP jumped from 2 billion dollars in 1961 to 25 billion dollars in 1976. The share of agricultural production in total GDP dropped from 40.2% to 24.8% and the share of agricultural employees dropped from 65% to 45% during the period. While the total population increased from 26 million in 1962 to 36 million in 1976, the farm household population decreased from 15 million to 13 million (Fig. 1.). During the period, farmland area stayed around 2.2 million ha and the agriculture still could support about 36% of the population (Fig 2.).
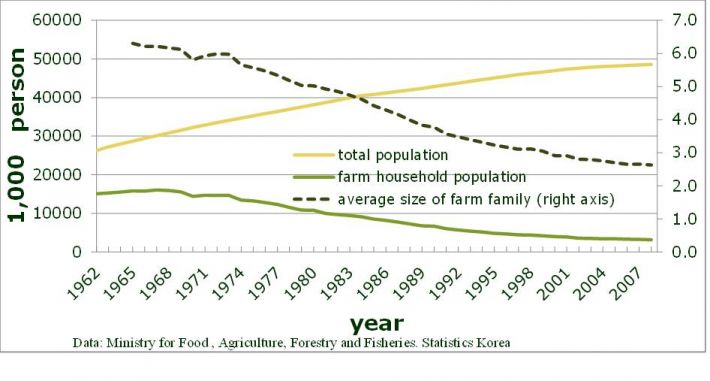
Fig. 1. Farm household population
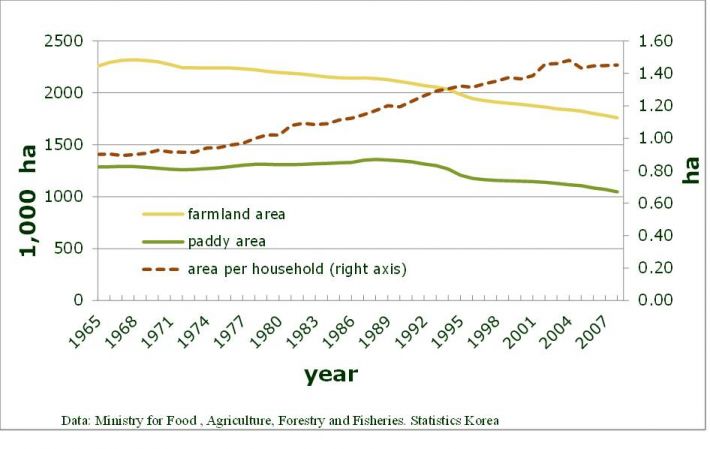
Fig. 2. Farmland area
Industrialization (1977-1994)
In this period, GNP grew 8.4% per year, but the growth of agricultural sector slowed down to 1% per year. At the end of the period the share of agricultural sector in total GDP was down to 5%. The rural/urban household income ratio stayed around 100%. The farmland area began to show decreasing tendency. However, the farmland size of a farm household increased from 0.97ha to 1.3ha since the number of farm households decreased faster than the farmland area.
The ratio of rural population decreased from 36% to 11%. The average of farm family size decreased from 5.3 to 3.3. The aging of agriculture accelerated. The ratio of farm household member over age of 49 exceeded 50% (Fig. 3). Due to the scarcity, labor productivity increased faster than land productivity (Fig. 4).
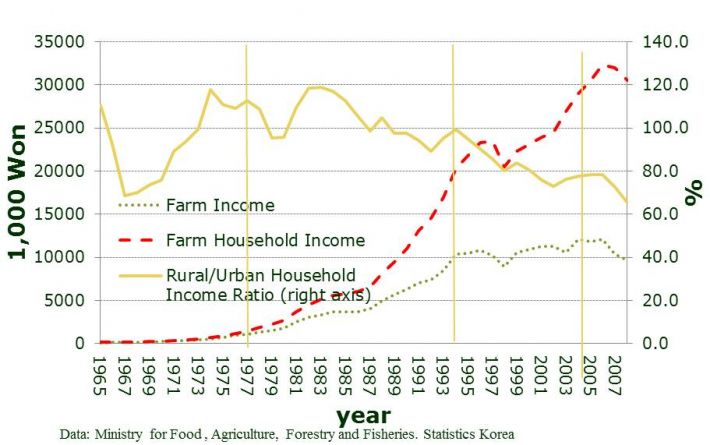
Fig. 3. Farm household income
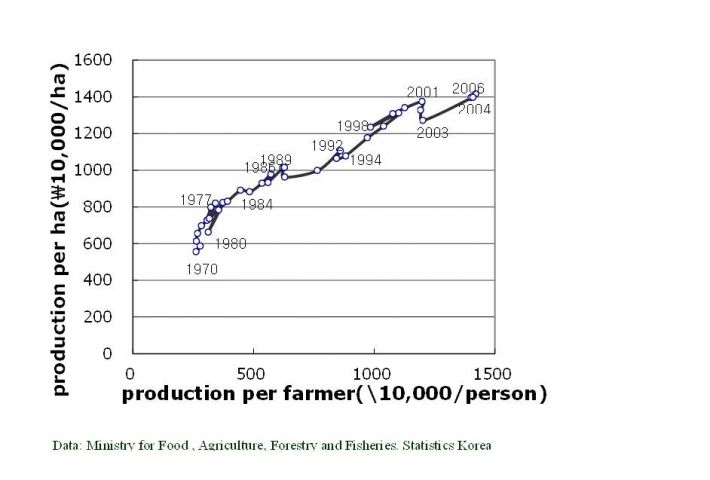
Fig. 4. Path of the growth of agricultural productivity
Globalization (1995- )
After the launch of WTO (World Trade Organization) in 1995 the import of agricultural products (including forestry and fishery products) increased from 10 billion dollars to 35 billion dollars (Fig. 5). Furthermore, Korea opened agricultural products market by signing FTA (Free Trade Agreement) with many major agricultural products producing countries such as ASEAN, Australia, Canada, China, EU, and US.
The market opening policy made the future of Korean agriculture very uncertain so that the younger generation turned away from the agriculture. To get the competitive power, the farmers tried to enlarge their farm size. Small farm operators who could not have chance to enlarge their farm size found new sources of income in sideline jobs and non-farm activities. Distribution of farms by revenue began to be bipolarized. The ratio of farms with agricultural revenue less then 5 million (≒$4,500) and the ratio of farms with agricultural revenue over 30 million (≒$27,000) began to increase. And the ratio of farms with agricultural revenue between 5 million and 30 million began to decrease (Table 1).
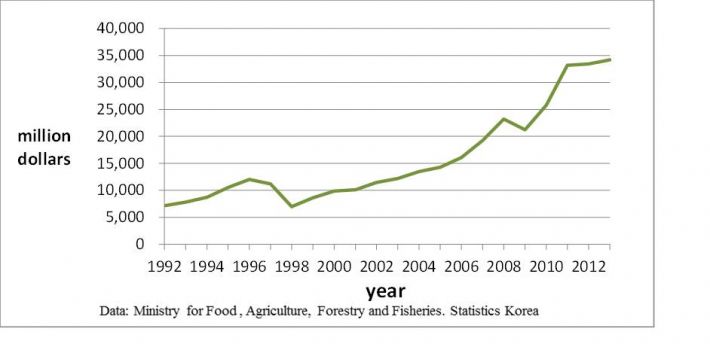
Fig. 5 The rise of the import of agricultural products (forestry and fishery products included)
Table 1. Bipolarization of farms by revenue (unit: %)
|
year
|
less than 1 mil.
|
1-5 mil.
|
5-10 mil.
|
10-20 mil.
|
20-30 mil.
|
30-50 mil.
|
50-100 mil.
|
100-200 mil.
|
over 200 mil.
|
Number of farms (1,000)
|
% of farms less than 5 mil.
|
% of farms over 30 mil.
|
|
| |
| |
| |
|
1995
|
20.50
|
26.79
|
23.56
|
17.53
|
7.16
|
3.58
|
0.71
|
0.14
|
0.04
|
1,501
|
47.29
|
4.46
|
|
|
2000
|
22.04
|
26.19
|
21.04
|
16.35
|
7.85
|
4.30
|
1.67
|
0.42
|
0.13
|
1,383
|
48.23
|
6.53
|
|
|
2005
|
23.69
|
27.99
|
16.61
|
13.61
|
7.83
|
5.75
|
3.23
|
0.88
|
0.41
|
1,273
|
51.68
|
10.27
|
|
|
2010
|
23.22*
|
29.90*
|
14.73
|
11.96
|
7.28
|
6.17
|
4.54
|
1.48
|
0.74
|
1,177
|
53.12
|
12.92
|
|
*In 2010, 1.2 million is used as the class boundary instead of 1 million.
Data: Ministry for Food , Agriculture, Forestry and Fisheries. Statistics Korea
The aging of agriculture
The aging of agriculture progressed rapidly. In 1970, less than 5% of the population was over 65. But in 2008, the ratio of farm household population over 65 approached 35% (Fig. 6). In 2010, the average of farm operator’s age reached 62. Fig.7 shows the distribution of farm by operator’s age in 2010. The mode of the age distribution belongs to the interval of 70-75. Farms with operators under the age of 40 are almost nonexistent (2.8% to be exact). Only 14.8% (173,622) of all farms (1,177,318) have operators whose age is less than 50. Now, in Korean agriculture, a ‘young’ farmer means a farmer under the age of 50.
.jpg)
Fig. 6 Ratio of farm household population over 49
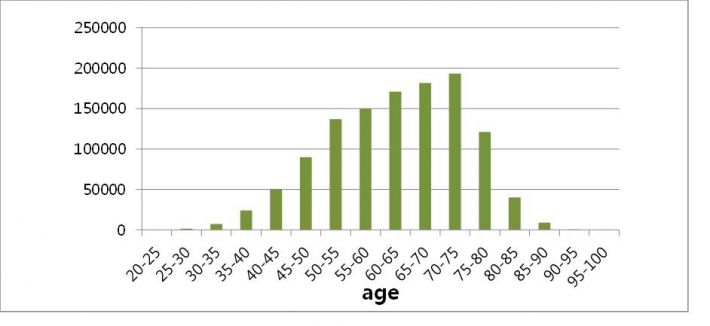
Fig. 7 The distribution of farms by operator’s age in 2010
Data: Agricultural Census, Statistics Korea, 2010
THE INCOME INSTABILITY OF YOUNG FARMERS
Table 2 shows the relationship between farm operator’s age and area of the farms. In the case of farms larger than 5.0 ha, the ratio of farms operated by young farmers (=25.4%) is much higher than the average (=14.7%).
Table 2. The distribution of farm households by operator’s age and farmland size: 2010
| |
< 0.5ha
|
0.5-1.0
|
1.0-2.0
|
2.0-5.0
|
5.0ha ≤
|
total
|
ratio(%)
|
|
20 - 24
|
55
|
23
|
20
|
11
|
6
|
115
|
0
|
|
25 - 29
|
813
|
282
|
211
|
189
|
86
|
1,581
|
0.1
|
|
30 - 34
|
3,761
|
1,454
|
1,007
|
750
|
382
|
7,354
|
0.6
|
|
35 - 39
|
11,799
|
5,086
|
3,515
|
2,492
|
1,201
|
24,093
|
2.1
|
|
40 - 44
|
23,072
|
10,782
|
7,850
|
5,885
|
2,765
|
50,354
|
4.3
|
|
45 - 49
|
37,833
|
19,290
|
15,217
|
12,164
|
5,621
|
90,125
|
7.7
|
|
50 - 54
|
52,774
|
28,623
|
24,988
|
21,377
|
9,174
|
136,936
|
11.6
|
|
55 - 59
|
56,151
|
33,077
|
29,570
|
23,439
|
7,966
|
150,203
|
12.8
|
|
60 - 64
|
62,519
|
39,810
|
37,208
|
25,267
|
6,005
|
170,809
|
14.5
|
|
65 - 69
|
69,284
|
46,901
|
40,899
|
21,131
|
3,403
|
181,618
|
15.4
|
|
70≤
|
168,152
|
102,367
|
68,055
|
22,574
|
2,982
|
364,130
|
30.9
|
|
total
|
486,213
|
287,695
|
228,540
|
135,279
|
39,591
|
1,177,318
|
100
|
|
ratio(%)
|
41.3
|
24.4
|
19.4
|
11.5
|
3.4
|
100
|
|
|
ratio of young farmers (%)
|
15.9
|
12.8
|
12.2
|
15.9
|
25.4
|
14.7
|
|
Data: Agricultural Census, Statistics Korea, 2010
As shown in Table 3, Korean agriculture is the agriculture of small farms. The annual farm revenue of 53.1% of farms are less than 5 million (≒$4,500). The ratio of farms that sell over 30 million (≒$27,000) of farm products in a year is only 12.9%. Greenhouse farms and livestock farms keep relatively larger sales amount than rice farms or outdoor crop farms. The ratios of greenhouse farms and livestock farms that sell over 30 million are 49.9% and 36.5% respectively.
Table 4 shows that most of the farms’ major crop is rice or outdoor crops. Not so many farms (155,532 out of 1,177,318) produce high revenue agricultural products such as greenhouse crops and livestock. Young farmers are taking the lead of high revenue crop production. 22.1% of greenhouse crop farms and 19.7% of livestock farms are operated by young farmers.
Table 3. The distribution of farm households by farm revenues and crops: 2010
| |
< ₩5 mil.
|
₩5-10 mil.
|
₩10-20 mil.
|
₩20-30 mil.
|
₩30-50 mil.
|
₩50-100 mil.
|
₩100 mil.≤
|
total
|
ratio of farms under ₩5 mil. (%)
|
ratio of farms over ₩30 mil. (%)
|
|
rice
|
324,445
|
87,508
|
56,490
|
25,598
|
16,831
|
9,617
|
2,664
|
523,153
|
62.0
|
5.6
|
|
outdoor crops other than rice
|
278,095
|
66,588
|
59,843
|
37,909
|
30,611
|
19,333
|
6,254
|
498,633
|
55.8
|
11.3
|
|
green -house crops
|
6,758
|
7,065
|
11,200
|
12,207
|
15,630
|
15,160
|
6,357
|
74,377
|
9.1
|
49.9
|
|
livestock
|
16,079
|
12,246
|
13,226
|
9,981
|
9,551
|
9,291
|
10,781
|
81,155
|
19.8
|
36.5
|
|
total
|
625,377
|
173,407
|
140,759
|
85,695
|
72,623
|
53,401
|
26,056
|
1,177,318
|
53.1
|
12.9
|
Data: Agricultural Census, Statistics Korea, 2010
Table 4. The distribution of farm households by operator’s age and crops: 2010
| |
< 30
|
30-40
|
40-50
|
50-60
|
60-65
|
65-70
|
70-80
|
80 ≤
|
total
|
ratio of young farm households
(%)
|
|
rice
|
607
|
12,577
|
54,527
|
110,298
|
72,471
|
84,711
|
162,698
|
25,264
|
523,153
|
12.9
|
|
outdoor crops other than rice
|
642
|
13,302
|
59,486
|
122,159
|
72,867
|
77,043
|
130,544
|
22,590
|
498,633
|
14.7
|
|
greenhouse crops
|
136
|
2,844
|
13,490
|
26,412
|
12,616
|
9,477
|
8,804
|
598
|
74,377
|
22.1
|
|
livestock
|
311
|
2,724
|
12,976
|
28,270
|
12,855
|
10,387
|
12,357
|
1,275
|
81,155
|
19.7
|
|
total
|
1,696
|
31,447
|
140,479
|
287,139
|
170,809
|
181,618
|
314,403
|
49,727
|
1,177,318
|
14.7
|
Data: Agricultural Census, Statistics Korea, 2010
Income structure of young farmers
Table 5 shows that younger farmers’ average household income is higher than older farmers’. And, according to Table 6, younger farmer’s ratio of farm income to household income is lower than older farmers. Therefore we could conclude that younger farmers depend on non-farm income more heavily than older farmers. Younger farmers could earn considerable amount of income from activities other than farming. Money from side line jobs such as lodging, yard selling, food processing and wage from part-time jobs are the better part of their household income.
From Table 5 and Table 6, we could know that a farm with larger land earns more farm income and has higher ratio of farm income to household income on average. However, in the case of farms operated by young farmers under age of 50, a larger farm size does not guarantee higher household income. For example, while the household income of farms in the land size interval 1.0-1.5 ha is 44.22 million, the household income of farms in the land size interval 2.0-3.0 ha is only 31.16 million. A young farmer under 50 could earn the better part of his (her) income from out-of-farm labor. For him (her), labor is more important income source than land.
Table 5. Average household income by operator’s age and land size
(unit: million won)
| |
<50
|
50-55
|
55-60
|
60-65
|
65-70
|
70-75
|
75-80
|
80≤
|
average
|
|
<0.5ha
|
28.15
|
28.36
|
22.66
|
23.70
|
14.65
|
14.58
|
7.70
|
5.48
|
18.70
|
|
0.5-1.0
|
27.55
|
31.50
|
25.25
|
18.82
|
17.15
|
12.28
|
9.03
|
7.25
|
17.86
|
|
1.0-1.5
|
44.22
|
30.89
|
24.65
|
24.89
|
18.35
|
21.29
|
10.57
|
8.66
|
21.65
|
|
1.5-2.0
|
43.36
|
29.87
|
36.06
|
25.42
|
18.52
|
24.69
|
13.71
|
14.68
|
24.77
|
|
2.0-3.0
|
31.16
|
29.69
|
28.51
|
25.09
|
21.49
|
19.68
|
16.30
|
14.35
|
23.13
|
|
3.0-5.0
|
36.02
|
35.69
|
48.42
|
28.52
|
29.45
|
23.64
|
20.55
|
16.58
|
31.49
|
|
5.0ha≤
|
45.81
|
47.94
|
53.17
|
57.94
|
44.34
|
31.17
|
28.01
|
22.20
|
46.95
|
|
average
|
32.05
|
31.19
|
28.78
|
25.37
|
19.30
|
17.47
|
10.69
|
8.07
|
22.40
|
Data: The Survey of Registered Farms, Ministry of Agriculture, Food and Rural Affairs, 2014
Table 6. The ratio of farm income to household income by operator’s age and land size
(unit: %)
| |
<50
|
50-55
|
55-60
|
60-65
|
65-70
|
70-75
|
75-80
|
80≤
|
average
|
|
<0.5ha
|
16.46
|
15.90
|
16.39
|
13.74
|
18.05
|
14.57
|
22.39
|
25.07
|
16.41
|
|
0.5-1.0
|
24.89
|
20.20
|
24.36
|
29.15
|
28.36
|
34.83
|
39.28
|
43.06
|
27.95
|
|
1.0-1.5
|
24.25
|
32.61
|
40.30
|
35.57
|
43.10
|
31.50
|
54.78
|
56.65
|
36.55
|
|
1.5-2.0
|
33.18
|
48.04
|
38.18
|
47.68
|
56.03
|
37.71
|
55.27
|
44.70
|
43.71
|
|
2.0-3.0
|
57.90
|
60.62
|
61.83
|
61.99
|
62.28
|
57.56
|
60.57
|
59.48
|
60.56
|
|
3.0-5.0
|
66.63
|
70.88
|
48.81
|
73.65
|
63.32
|
65.84
|
64.63
|
70.44
|
62.95
|
|
5.0ha≤
|
82.79
|
81.73
|
71.56
|
58.36
|
79.74
|
72.48
|
68.87
|
73.45
|
72.62
|
|
average
|
30.81
|
33.77
|
36.77
|
37.00
|
43.54
|
36.11
|
45.67
|
44.47
|
35.93
|
Data: The Survey of Registered Farms, Ministry of Agriculture, Food and Rural Affairs, 2014
Table 7. The ratio of transfer income to household income by operator’s age and land size
(unit: %)
| |
<50
|
50-55
|
55-60
|
60-65
|
65-70
|
70-75
|
75-80
|
80≤
|
average
|
|
<0.5ha
|
1.47
|
1.47
|
5.61
|
37.11
|
42.78
|
59.41
|
54.99
|
54.49
|
22.15
|
|
0.5-1.0
|
2.02
|
1.92
|
5.07
|
19.81
|
41.42
|
39.98
|
38.78
|
37.70
|
18.52
|
|
1.0-1.5
|
2.09
|
3.74
|
5.35
|
18.67
|
31.88
|
31.20
|
30.50
|
27.06
|
16.92
|
|
1.5-2.0
|
2.00
|
5.85
|
31.81
|
24.90
|
24.88
|
53.48
|
27.91
|
43.94
|
27.04
|
|
2.0-3.0
|
10.81
|
3.66
|
6.73
|
15.93
|
20.59
|
31.34
|
31.00
|
28.76
|
17.21
|
|
3.0-5.0
|
13.25
|
3.53
|
38.07
|
10.40
|
27.52
|
24.39
|
26.36
|
18.34
|
22.66
|
|
5.0ha≤
|
6.98
|
6.46
|
20.06
|
35.59
|
14.03
|
16.38
|
24.29
|
15.40
|
18.97
|
|
average
|
3.32
|
2.87
|
13.49
|
26.61
|
32.19
|
41.91
|
37.43
|
38.85
|
19.88
|
Data: The Survey of Registered Farms, Ministry of Agriculture, Food and Rural Affairs, 2014
Table 7 shows that the ratio of transfer income[2] to household income is higher for older farmers. The average ratio of transfer income to household income for young farmers under 50 is only 3.32%. On the other hand, the average ratio of transfer income to household income for older farmers over 65 exceeds 30%.
Income instability of young farmers
So far, we have discussed conflicting facts about younger farmers’ household income instability. Those are as follows. First, younger farmers tend to cultivate larger land than older farmers and farm income is more unstable than non-farm income. Second, younger farmers’ non-farm income ratio to household income is higher than older farmers’ and non-farm income is more stable than farm income. Since household income is a summation of farm income and non-farm income, we cannot determine whether younger farmers’ household income is more stable than old farmers’ or not.
By investigating the panel data of the ‘farm household economic survey’, we could determine which one is more stable. The numbers in Table 8 and Table 9 are the group averages of the CV (Coefficient of Variation) of farm income[3] and household income respectively. As we expected, the CV of household income in Table 9 is much smaller than the CV of farm income in Table 8. That is, non-farm income is much more stable than farm income.
Table 8. The farm income CV’s by operator’s age and land size (2008-2012)
| |
<50
|
50-55
|
55-60
|
60-65
|
65-70
|
70-75
|
75-80
|
80≤
|
average
|
|
<0.5ha
|
4.27
|
2.97
|
2.90
|
1.86
|
2.13
|
1.89
|
1.54
|
1.20
|
2.08
|
|
0.5-1.0
|
1.99
|
2.00
|
4.06
|
1.28
|
1.09
|
1.75
|
1.08
|
1.05
|
1.57
|
|
1.0-1.5
|
1.85
|
4.60
|
1.61
|
1.63
|
0.85
|
0.73
|
1.03
|
2.06
|
1.37
|
|
1.5-2.0
|
0.64
|
1.50
|
1.45
|
2.09
|
0.96
|
0.82
|
0.60
|
0.23
|
1.11
|
|
2.0-3.0
|
1.26
|
1.38
|
1.27
|
0.89
|
0.97
|
0.77
|
0.89
|
-
|
1.02
|
|
3.0-5.0
|
1.90
|
1.19
|
1.36
|
0.98
|
1.08
|
2.57
|
0.52
|
1.21
|
1.32
|
|
5.0ha≤
|
2.20
|
1.63
|
1.53
|
0.73
|
1.49
|
1.02
|
-
|
-
|
1.51
|
|
average
|
2.22
|
2.12
|
2.08
|
1.40
|
1.20
|
1.35
|
1.10
|
1.28
|
1.49
|
Data: Farm Household Economy Survey, Statistics Korea, 2013
In Table 8, we could see that the average farm income CV is very high (=2.08) for farms with farm land smaller than 0.5 ha. And the CV goes down as the size of farm grows larger. However, on average, once the size of farm gets bigger than 3.0 ha (or 2.0 ha for young farm operators under 50) the instability of farm income is beginning to grow again. When the size of farm grows over 3.0 ha the farm begins to be commercialized and exposed to many risk factors of the market. Hence, in terms of farm income, a mid-size farm whose size is between 1.5 ha and 3.0 ha is the most stable one.
Table 9. The household income CV’s by operator’s age and land size (2008-2012)
| |
<50
|
50-55
|
55-60
|
60-65
|
65-70
|
70-75
|
75-80
|
80≤
|
average
|
|
<0.5ha
|
0.55
|
0.39
|
0.66
|
0.77
|
0.43
|
0.42
|
0.40
|
0.36
|
0.49
|
|
0.5-1.0
|
0.65
|
0.64
|
0.48
|
0.47
|
0.43
|
0.36
|
0.44
|
0.37
|
0.45
|
|
1.0-1.5
|
0.47
|
0.45
|
0.47
|
0.49
|
0.47
|
0.42
|
0.46
|
0.29
|
0.45
|
|
1.5-2.0
|
0.56
|
0.53
|
0.47
|
0.63
|
0.48
|
0.41
|
0.34
|
0.26
|
0.47
|
|
2.0-3.0
|
0.56
|
0.60
|
0.58
|
0.71
|
0.51
|
0.43
|
0.58
|
-
|
0.56
|
|
3.0-5.0
|
0.67
|
0.69
|
0.67
|
0.71
|
0.49
|
0.45
|
0.38
|
0.43
|
0.62
|
|
5.0ha≤
|
0.62
|
0.74
|
0.73
|
0.50
|
0.45
|
0.34
|
-
|
-
|
0.61
|
|
average
|
0.59
|
0.58
|
0.57
|
0.61
|
0.46
|
0.40
|
0.43
|
0.35
|
0.49
|
Data: Farm Household Economy Survey, Statistics Korea, 2013
Table 9 clearly shows that younger farmers’ household income is more unstable than older farmers’. Younger farmers’ farm income is so much more unstable than older farmers’ that it makes their household income more unstable than older farmers’ even though their ratio of farm income to household income is lower than older farmers’. In Table 8, while the farm income CV of farmers under 60 is greater than 2.0, the farm income CV of farmers over 60 is less than 1.4. Why the farm income of younger farmers is far more unstable than older farmers’? We could think of at least three reasons as follows. First, many younger farmers cultivate high income but high risk crops such as livestock and greenhouse crops as we have seen in Table 4. Second, younger farmers like to try new, relatively risky technologies. Third, many younger farmers who do farming as a side line job do not care much about farming.
In Table 10 are the CV’s of household income calculated from the ‘farm household economy survey’ data (2003-2007). Table 10 shows almost the same results as in Table 9.
Table 10. The household income CV’s by operator’s age and land size (2003-2007)
| |
<50
|
50-55
|
55-60
|
60-65
|
65-70
|
70-75
|
75-80
|
80≤
|
average
|
|
<0.5ha
|
0.46
|
0.47
|
0.42
|
0.38
|
0.38
|
0.37
|
0.34
|
0.34
|
0.40
|
|
0.5-1.0
|
0.52
|
0.50
|
0.40
|
0.40
|
0.38
|
0.41
|
0.36
|
0.36
|
0.41
|
|
1.0-1.5
|
0.51
|
0.41
|
0.44
|
0.40
|
0.44
|
0.36
|
0.31
|
0.42
|
0.41
|
|
1.5-2.0
|
0.58
|
0.52
|
0.42
|
0.44
|
0.38
|
0.38
|
0.34
|
0.39
|
0.43
|
|
2.0-3.0
|
0.53
|
0.46
|
0.50
|
0.37
|
0.40
|
0.40
|
0.15
|
0.23
|
0.44
|
|
3.0-5.0
|
0.53
|
0.49
|
0.49
|
0.36
|
0.40
|
0.28
|
0.77
|
-
|
0.45
|
|
5.0ha≤
|
0.47
|
0.51
|
0.43
|
0.40
|
0.54
|
0.37
|
-
|
-
|
0.47
|
|
average
|
0.51
|
0.48
|
0.44
|
0.39
|
0.40
|
0.38
|
0.34
|
0.36
|
0.42
|
Data: Farm Household Economy Survey, Statistics Korea, 2008
CONCLUSION
As pointed out above, younger farmers’ household income is more unstable than older farmers’. This instability is one of the major causes that keep younger farmers from entering farming business.
Also we have learned that, in the case of younger farmers, the ratio of transfer income to household income is very low and mid-size (1.5-3.0 ha) farms’ household income is the most stable. Base on these, we could propose a couple of policy measures as follows.
First, we suggest a farmland plan through which the government supplies farmland for younger farmers so that they could build mid-size farms. For example, a land bank for younger farmers.
Second, we suggest an income transfer plan through which the government could subsidize younger farmers’ so that they could lower the ratio of farm income to household income. For example, a direct payment[4] scheme for younger farmers.
REFERENCES
Lee, Taeho. 2010. 50 Years of Korean Agriculture. 2010 Japan-Korea-Taiwan International Conference on Agricultural and Resource Economics Proceedings. Keynote Address.
Ministry of Agriculture, Food and Rural Affairs. 2014. The Survey of Registered Farms.
Statistics Korea. 1995 and 2010. Agricultural Census.
Statistics Korea, 2008 and 2013. Farm Household Economy Survey.
[2] The major part of transfer income is composed of public subsidies from the government and private subsidies from family members.
[3] The coefficient of variation is calculated from ‘Farm Household Economy Survey’ (Statistics Korea, 2013) which is a 5 year panel data from 2008 to 2012. The sample size of the survey is around 3,000 each year.
[4] We prefer a direct payment scheme that is inversely proportional to land size. The income stabilization effect of a direct payment proportional to land size is limited since a small farm gets only a small portion of direct payment.
| Submitted as a resource paper for the FFTC-MARDI International Seminar on Cultivating the Young Generation of Farmers with Farmland Policy Implications, May 25-29, MARDI, Serdang, Selangor, Malaysia |

The Aging of Agriculture and the Income Instability of Young Farmers in Korea
ABSTRACT
One of the biggest problems of Korean agriculture is the aging of farmers. Only 14.8% (173,622) of all farms (1,177,318) have operators whose age is less than 50. Although the government has tried to substitute younger farmers for older farmers, the result has been not so successful. The income instability of farm household has been supposed as one of the major causes that hinder the rejuvenation of the agriculture. So far, it is not so certain that a younger farmer’s household income is more unstable than an older farmer’s since a younger farmer can stabilize the household income by earning the better part of his(her) household income from non-farm activities. In the paper, using a panel survey data we show that a younger farmer’s household income is more unstable than older farmer’s.
Key Words: aging of agriculture, income instability, panel survey data
INTRODUCTION
According to the agricultural census in 2010 the average age of Korean farm operators is 62.3 and the largest age group stands at the interval of 70-75. The aging of agriculture causes serious problems such as the decrease of rural population, the reduction of farm size and farm income.
Although many policies have been used to encourage young people to participate in agricultural production, the number of farms operated by young farmers is decreasing every year. Income instability is one of the major causes that make young people turn away from agriculture. In this paper, we try to understand how the income instability causes the aging of Korean agriculture by examining the relationship between the income instability and farm operators’ age.
First, we look into the aging process of Korean agriculture by briefly going over the history of the economy. Second, we present some tables that show the current situation of farms operated by younger farmers such as the distribution of farms by operator’s age and the size of land, the distribution of farm households by farm revenues and crops. Third, using a panel survey data, we study the relationship between the income instability of the farms and the age of farm operators.
ECONOMIC GROWTH AND THE AGING OF KOREAN AGRICULTURE
Take-off of the Economy (1962-1976)[1]
The Korean economy recorded a rapid growth in 1960’s and 1970’s. GDP jumped from 2 billion dollars in 1961 to 25 billion dollars in 1976. The share of agricultural production in total GDP dropped from 40.2% to 24.8% and the share of agricultural employees dropped from 65% to 45% during the period. While the total population increased from 26 million in 1962 to 36 million in 1976, the farm household population decreased from 15 million to 13 million (Fig. 1.). During the period, farmland area stayed around 2.2 million ha and the agriculture still could support about 36% of the population (Fig 2.).
Fig. 1. Farm household population
Fig. 2. Farmland area
Industrialization (1977-1994)
In this period, GNP grew 8.4% per year, but the growth of agricultural sector slowed down to 1% per year. At the end of the period the share of agricultural sector in total GDP was down to 5%. The rural/urban household income ratio stayed around 100%. The farmland area began to show decreasing tendency. However, the farmland size of a farm household increased from 0.97ha to 1.3ha since the number of farm households decreased faster than the farmland area.
The ratio of rural population decreased from 36% to 11%. The average of farm family size decreased from 5.3 to 3.3. The aging of agriculture accelerated. The ratio of farm household member over age of 49 exceeded 50% (Fig. 3). Due to the scarcity, labor productivity increased faster than land productivity (Fig. 4).
Fig. 3. Farm household income
Fig. 4. Path of the growth of agricultural productivity
Globalization (1995- )
After the launch of WTO (World Trade Organization) in 1995 the import of agricultural products (including forestry and fishery products) increased from 10 billion dollars to 35 billion dollars (Fig. 5). Furthermore, Korea opened agricultural products market by signing FTA (Free Trade Agreement) with many major agricultural products producing countries such as ASEAN, Australia, Canada, China, EU, and US.
The market opening policy made the future of Korean agriculture very uncertain so that the younger generation turned away from the agriculture. To get the competitive power, the farmers tried to enlarge their farm size. Small farm operators who could not have chance to enlarge their farm size found new sources of income in sideline jobs and non-farm activities. Distribution of farms by revenue began to be bipolarized. The ratio of farms with agricultural revenue less then 5 million (≒$4,500) and the ratio of farms with agricultural revenue over 30 million (≒$27,000) began to increase. And the ratio of farms with agricultural revenue between 5 million and 30 million began to decrease (Table 1).
Fig. 5 The rise of the import of agricultural products (forestry and fishery products included)
Table 1. Bipolarization of farms by revenue (unit: %)
year
less than 1 mil.
1-5 mil.
5-10 mil.
10-20 mil.
20-30 mil.
30-50 mil.
50-100 mil.
100-200 mil.
over 200 mil.
Number of farms (1,000)
% of farms less than 5 mil.
% of farms over 30 mil.
1995
20.50
26.79
23.56
17.53
7.16
3.58
0.71
0.14
0.04
1,501
47.29
4.46
2000
22.04
26.19
21.04
16.35
7.85
4.30
1.67
0.42
0.13
1,383
48.23
6.53
2005
23.69
27.99
16.61
13.61
7.83
5.75
3.23
0.88
0.41
1,273
51.68
10.27
2010
23.22*
29.90*
14.73
11.96
7.28
6.17
4.54
1.48
0.74
1,177
53.12
12.92
*In 2010, 1.2 million is used as the class boundary instead of 1 million.
Data: Ministry for Food , Agriculture, Forestry and Fisheries. Statistics Korea
The aging of agriculture
The aging of agriculture progressed rapidly. In 1970, less than 5% of the population was over 65. But in 2008, the ratio of farm household population over 65 approached 35% (Fig. 6). In 2010, the average of farm operator’s age reached 62. Fig.7 shows the distribution of farm by operator’s age in 2010. The mode of the age distribution belongs to the interval of 70-75. Farms with operators under the age of 40 are almost nonexistent (2.8% to be exact). Only 14.8% (173,622) of all farms (1,177,318) have operators whose age is less than 50. Now, in Korean agriculture, a ‘young’ farmer means a farmer under the age of 50.
Fig. 6 Ratio of farm household population over 49
Fig. 7 The distribution of farms by operator’s age in 2010
Data: Agricultural Census, Statistics Korea, 2010
THE INCOME INSTABILITY OF YOUNG FARMERS
Table 2 shows the relationship between farm operator’s age and area of the farms. In the case of farms larger than 5.0 ha, the ratio of farms operated by young farmers (=25.4%) is much higher than the average (=14.7%).
Table 2. The distribution of farm households by operator’s age and farmland size: 2010
< 0.5ha
0.5-1.0
1.0-2.0
2.0-5.0
5.0ha ≤
total
ratio(%)
20 - 24
55
23
20
11
6
115
0
25 - 29
813
282
211
189
86
1,581
0.1
30 - 34
3,761
1,454
1,007
750
382
7,354
0.6
35 - 39
11,799
5,086
3,515
2,492
1,201
24,093
2.1
40 - 44
23,072
10,782
7,850
5,885
2,765
50,354
4.3
45 - 49
37,833
19,290
15,217
12,164
5,621
90,125
7.7
50 - 54
52,774
28,623
24,988
21,377
9,174
136,936
11.6
55 - 59
56,151
33,077
29,570
23,439
7,966
150,203
12.8
60 - 64
62,519
39,810
37,208
25,267
6,005
170,809
14.5
65 - 69
69,284
46,901
40,899
21,131
3,403
181,618
15.4
70≤
168,152
102,367
68,055
22,574
2,982
364,130
30.9
total
486,213
287,695
228,540
135,279
39,591
1,177,318
100
ratio(%)
41.3
24.4
19.4
11.5
3.4
100
ratio of young farmers (%)
15.9
12.8
12.2
15.9
25.4
14.7
Data: Agricultural Census, Statistics Korea, 2010
As shown in Table 3, Korean agriculture is the agriculture of small farms. The annual farm revenue of 53.1% of farms are less than 5 million (≒$4,500). The ratio of farms that sell over 30 million (≒$27,000) of farm products in a year is only 12.9%. Greenhouse farms and livestock farms keep relatively larger sales amount than rice farms or outdoor crop farms. The ratios of greenhouse farms and livestock farms that sell over 30 million are 49.9% and 36.5% respectively.
Table 4 shows that most of the farms’ major crop is rice or outdoor crops. Not so many farms (155,532 out of 1,177,318) produce high revenue agricultural products such as greenhouse crops and livestock. Young farmers are taking the lead of high revenue crop production. 22.1% of greenhouse crop farms and 19.7% of livestock farms are operated by young farmers.
Table 3. The distribution of farm households by farm revenues and crops: 2010
< ₩5 mil.
₩5-10 mil.
₩10-20 mil.
₩20-30 mil.
₩30-50 mil.
₩50-100 mil.
₩100 mil.≤
total
ratio of farms under ₩5 mil. (%)
ratio of farms over ₩30 mil. (%)
rice
324,445
87,508
56,490
25,598
16,831
9,617
2,664
523,153
62.0
5.6
outdoor crops other than rice
278,095
66,588
59,843
37,909
30,611
19,333
6,254
498,633
55.8
11.3
green -house crops
6,758
7,065
11,200
12,207
15,630
15,160
6,357
74,377
9.1
49.9
livestock
16,079
12,246
13,226
9,981
9,551
9,291
10,781
81,155
19.8
36.5
total
625,377
173,407
140,759
85,695
72,623
53,401
26,056
1,177,318
53.1
12.9
Data: Agricultural Census, Statistics Korea, 2010
Table 4. The distribution of farm households by operator’s age and crops: 2010
< 30
30-40
40-50
50-60
60-65
65-70
70-80
80 ≤
total
ratio of young farm households
(%)
rice
607
12,577
54,527
110,298
72,471
84,711
162,698
25,264
523,153
12.9
outdoor crops other than rice
642
13,302
59,486
122,159
72,867
77,043
130,544
22,590
498,633
14.7
greenhouse crops
136
2,844
13,490
26,412
12,616
9,477
8,804
598
74,377
22.1
livestock
311
2,724
12,976
28,270
12,855
10,387
12,357
1,275
81,155
19.7
total
1,696
31,447
140,479
287,139
170,809
181,618
314,403
49,727
1,177,318
14.7
Data: Agricultural Census, Statistics Korea, 2010
Income structure of young farmers
Table 5 shows that younger farmers’ average household income is higher than older farmers’. And, according to Table 6, younger farmer’s ratio of farm income to household income is lower than older farmers. Therefore we could conclude that younger farmers depend on non-farm income more heavily than older farmers. Younger farmers could earn considerable amount of income from activities other than farming. Money from side line jobs such as lodging, yard selling, food processing and wage from part-time jobs are the better part of their household income.
From Table 5 and Table 6, we could know that a farm with larger land earns more farm income and has higher ratio of farm income to household income on average. However, in the case of farms operated by young farmers under age of 50, a larger farm size does not guarantee higher household income. For example, while the household income of farms in the land size interval 1.0-1.5 ha is 44.22 million, the household income of farms in the land size interval 2.0-3.0 ha is only 31.16 million. A young farmer under 50 could earn the better part of his (her) income from out-of-farm labor. For him (her), labor is more important income source than land.
Table 5. Average household income by operator’s age and land size
(unit: million won)
<50
50-55
55-60
60-65
65-70
70-75
75-80
80≤
average
<0.5ha
28.15
28.36
22.66
23.70
14.65
14.58
7.70
5.48
18.70
0.5-1.0
27.55
31.50
25.25
18.82
17.15
12.28
9.03
7.25
17.86
1.0-1.5
44.22
30.89
24.65
24.89
18.35
21.29
10.57
8.66
21.65
1.5-2.0
43.36
29.87
36.06
25.42
18.52
24.69
13.71
14.68
24.77
2.0-3.0
31.16
29.69
28.51
25.09
21.49
19.68
16.30
14.35
23.13
3.0-5.0
36.02
35.69
48.42
28.52
29.45
23.64
20.55
16.58
31.49
5.0ha≤
45.81
47.94
53.17
57.94
44.34
31.17
28.01
22.20
46.95
average
32.05
31.19
28.78
25.37
19.30
17.47
10.69
8.07
22.40
Data: The Survey of Registered Farms, Ministry of Agriculture, Food and Rural Affairs, 2014
Table 6. The ratio of farm income to household income by operator’s age and land size
(unit: %)
<50
50-55
55-60
60-65
65-70
70-75
75-80
80≤
average
<0.5ha
16.46
15.90
16.39
13.74
18.05
14.57
22.39
25.07
16.41
0.5-1.0
24.89
20.20
24.36
29.15
28.36
34.83
39.28
43.06
27.95
1.0-1.5
24.25
32.61
40.30
35.57
43.10
31.50
54.78
56.65
36.55
1.5-2.0
33.18
48.04
38.18
47.68
56.03
37.71
55.27
44.70
43.71
2.0-3.0
57.90
60.62
61.83
61.99
62.28
57.56
60.57
59.48
60.56
3.0-5.0
66.63
70.88
48.81
73.65
63.32
65.84
64.63
70.44
62.95
5.0ha≤
82.79
81.73
71.56
58.36
79.74
72.48
68.87
73.45
72.62
average
30.81
33.77
36.77
37.00
43.54
36.11
45.67
44.47
35.93
Data: The Survey of Registered Farms, Ministry of Agriculture, Food and Rural Affairs, 2014
Table 7. The ratio of transfer income to household income by operator’s age and land size
(unit: %)
<50
50-55
55-60
60-65
65-70
70-75
75-80
80≤
average
<0.5ha
1.47
1.47
5.61
37.11
42.78
59.41
54.99
54.49
22.15
0.5-1.0
2.02
1.92
5.07
19.81
41.42
39.98
38.78
37.70
18.52
1.0-1.5
2.09
3.74
5.35
18.67
31.88
31.20
30.50
27.06
16.92
1.5-2.0
2.00
5.85
31.81
24.90
24.88
53.48
27.91
43.94
27.04
2.0-3.0
10.81
3.66
6.73
15.93
20.59
31.34
31.00
28.76
17.21
3.0-5.0
13.25
3.53
38.07
10.40
27.52
24.39
26.36
18.34
22.66
5.0ha≤
6.98
6.46
20.06
35.59
14.03
16.38
24.29
15.40
18.97
average
3.32
2.87
13.49
26.61
32.19
41.91
37.43
38.85
19.88
Data: The Survey of Registered Farms, Ministry of Agriculture, Food and Rural Affairs, 2014
Table 7 shows that the ratio of transfer income[2] to household income is higher for older farmers. The average ratio of transfer income to household income for young farmers under 50 is only 3.32%. On the other hand, the average ratio of transfer income to household income for older farmers over 65 exceeds 30%.
Income instability of young farmers
So far, we have discussed conflicting facts about younger farmers’ household income instability. Those are as follows. First, younger farmers tend to cultivate larger land than older farmers and farm income is more unstable than non-farm income. Second, younger farmers’ non-farm income ratio to household income is higher than older farmers’ and non-farm income is more stable than farm income. Since household income is a summation of farm income and non-farm income, we cannot determine whether younger farmers’ household income is more stable than old farmers’ or not.
By investigating the panel data of the ‘farm household economic survey’, we could determine which one is more stable. The numbers in Table 8 and Table 9 are the group averages of the CV (Coefficient of Variation) of farm income[3] and household income respectively. As we expected, the CV of household income in Table 9 is much smaller than the CV of farm income in Table 8. That is, non-farm income is much more stable than farm income.
Table 8. The farm income CV’s by operator’s age and land size (2008-2012)
<50
50-55
55-60
60-65
65-70
70-75
75-80
80≤
average
<0.5ha
4.27
2.97
2.90
1.86
2.13
1.89
1.54
1.20
2.08
0.5-1.0
1.99
2.00
4.06
1.28
1.09
1.75
1.08
1.05
1.57
1.0-1.5
1.85
4.60
1.61
1.63
0.85
0.73
1.03
2.06
1.37
1.5-2.0
0.64
1.50
1.45
2.09
0.96
0.82
0.60
0.23
1.11
2.0-3.0
1.26
1.38
1.27
0.89
0.97
0.77
0.89
-
1.02
3.0-5.0
1.90
1.19
1.36
0.98
1.08
2.57
0.52
1.21
1.32
5.0ha≤
2.20
1.63
1.53
0.73
1.49
1.02
-
-
1.51
average
2.22
2.12
2.08
1.40
1.20
1.35
1.10
1.28
1.49
Data: Farm Household Economy Survey, Statistics Korea, 2013
In Table 8, we could see that the average farm income CV is very high (=2.08) for farms with farm land smaller than 0.5 ha. And the CV goes down as the size of farm grows larger. However, on average, once the size of farm gets bigger than 3.0 ha (or 2.0 ha for young farm operators under 50) the instability of farm income is beginning to grow again. When the size of farm grows over 3.0 ha the farm begins to be commercialized and exposed to many risk factors of the market. Hence, in terms of farm income, a mid-size farm whose size is between 1.5 ha and 3.0 ha is the most stable one.
Table 9. The household income CV’s by operator’s age and land size (2008-2012)
<50
50-55
55-60
60-65
65-70
70-75
75-80
80≤
average
<0.5ha
0.55
0.39
0.66
0.77
0.43
0.42
0.40
0.36
0.49
0.5-1.0
0.65
0.64
0.48
0.47
0.43
0.36
0.44
0.37
0.45
1.0-1.5
0.47
0.45
0.47
0.49
0.47
0.42
0.46
0.29
0.45
1.5-2.0
0.56
0.53
0.47
0.63
0.48
0.41
0.34
0.26
0.47
2.0-3.0
0.56
0.60
0.58
0.71
0.51
0.43
0.58
-
0.56
3.0-5.0
0.67
0.69
0.67
0.71
0.49
0.45
0.38
0.43
0.62
5.0ha≤
0.62
0.74
0.73
0.50
0.45
0.34
-
-
0.61
average
0.59
0.58
0.57
0.61
0.46
0.40
0.43
0.35
0.49
Data: Farm Household Economy Survey, Statistics Korea, 2013
Table 9 clearly shows that younger farmers’ household income is more unstable than older farmers’. Younger farmers’ farm income is so much more unstable than older farmers’ that it makes their household income more unstable than older farmers’ even though their ratio of farm income to household income is lower than older farmers’. In Table 8, while the farm income CV of farmers under 60 is greater than 2.0, the farm income CV of farmers over 60 is less than 1.4. Why the farm income of younger farmers is far more unstable than older farmers’? We could think of at least three reasons as follows. First, many younger farmers cultivate high income but high risk crops such as livestock and greenhouse crops as we have seen in Table 4. Second, younger farmers like to try new, relatively risky technologies. Third, many younger farmers who do farming as a side line job do not care much about farming.
In Table 10 are the CV’s of household income calculated from the ‘farm household economy survey’ data (2003-2007). Table 10 shows almost the same results as in Table 9.
Table 10. The household income CV’s by operator’s age and land size (2003-2007)
<50
50-55
55-60
60-65
65-70
70-75
75-80
80≤
average
<0.5ha
0.46
0.47
0.42
0.38
0.38
0.37
0.34
0.34
0.40
0.5-1.0
0.52
0.50
0.40
0.40
0.38
0.41
0.36
0.36
0.41
1.0-1.5
0.51
0.41
0.44
0.40
0.44
0.36
0.31
0.42
0.41
1.5-2.0
0.58
0.52
0.42
0.44
0.38
0.38
0.34
0.39
0.43
2.0-3.0
0.53
0.46
0.50
0.37
0.40
0.40
0.15
0.23
0.44
3.0-5.0
0.53
0.49
0.49
0.36
0.40
0.28
0.77
-
0.45
5.0ha≤
0.47
0.51
0.43
0.40
0.54
0.37
-
-
0.47
average
0.51
0.48
0.44
0.39
0.40
0.38
0.34
0.36
0.42
Data: Farm Household Economy Survey, Statistics Korea, 2008
CONCLUSION
As pointed out above, younger farmers’ household income is more unstable than older farmers’. This instability is one of the major causes that keep younger farmers from entering farming business.
Also we have learned that, in the case of younger farmers, the ratio of transfer income to household income is very low and mid-size (1.5-3.0 ha) farms’ household income is the most stable. Base on these, we could propose a couple of policy measures as follows.
First, we suggest a farmland plan through which the government supplies farmland for younger farmers so that they could build mid-size farms. For example, a land bank for younger farmers.
Second, we suggest an income transfer plan through which the government could subsidize younger farmers’ so that they could lower the ratio of farm income to household income. For example, a direct payment[4] scheme for younger farmers.
REFERENCES
Lee, Taeho. 2010. 50 Years of Korean Agriculture. 2010 Japan-Korea-Taiwan International Conference on Agricultural and Resource Economics Proceedings. Keynote Address.
Ministry of Agriculture, Food and Rural Affairs. 2014. The Survey of Registered Farms.
Statistics Korea. 1995 and 2010. Agricultural Census.
Statistics Korea, 2008 and 2013. Farm Household Economy Survey.
[1] Lee(2010)
[2] The major part of transfer income is composed of public subsidies from the government and private subsidies from family members.
[3] The coefficient of variation is calculated from ‘Farm Household Economy Survey’ (Statistics Korea, 2013) which is a 5 year panel data from 2008 to 2012. The sample size of the survey is around 3,000 each year.
[4] We prefer a direct payment scheme that is inversely proportional to land size. The income stabilization effect of a direct payment proportional to land size is limited since a small farm gets only a small portion of direct payment.