Yoshihisa Godo
Professor, Meiji Gakuin University, Japan
Introduction
Japan’s unique system of agricultural cooperatives forms a nationwide network, called the JA Group. This mammoth economic body organizes almost all Japanese farmers and has played a key role in shaping the rural economy since the Agricultural Cooperative Law (ACL) was enacted in 19471. Evaluation of the JA Group differs among researchers. Some praise the group as protecting farmers’ benefits, while others criticize it as an “old guard” that is more concerned with its own vested interests than with improving agricultural productivity.
This debate has recently gained new relevance, as a full revision of the ACL and related laws is now placed atop Japan’s political agenda. Throughout the general election campaign in December 2014, Prime Minister Abe repeatedly asserted that the reform of the JA Group would be the centerpiece of his policy agenda’s “New Growth Strategy.” A fierce controversy is thus currently raging, both among policymakers and the general public, over how to reform the JA Group.
The purpose of this paper is not to voice any specific opinion on how the JA Group should be reformed. Instead, it aims to provide objective information on the economic position of agricultural cooperatives within inputs and outputs markets in Japan. It is hoped that this information can form a foundation upon which to consider what the JA Group should be. To this end, the next two sections offer a brief overview of the system and relevant data sources, after which Sections 4 and 5 analyze this data to describe cooperatives’ shares in Japan’s inputs and outputs markets. Section 6 concludes.
Japan’s system of agricultural cooperatives
Agricultural cooperatives in Japan provide not only agricultural services but also almost every other service required for daily life. In addition to farmers, non-farmers who have paid dues are allowed to use all the cooperatives’ services as associate members under the same conditions as farmers2.
Each agricultural cooperative has its own jurisdiction, and these do not overlap. As of April 1, 2014, there were 728 agricultural cooperatives in Japan3. The size and human resources available to any one agricultural cooperative are insufficient to enable it to compete with private businesses, such as supermarkets and trading companies. To conquer this weakness, agricultural cooperatives form federations at the prefectural and national levels. These federations are referred to as Keizairen and Zen-noh, respectively, and act as cooperatives’ agents in the buying and selling of agricultural and non-agricultural commodities.
Data sources
For information on cooperatives, the Ministry of Agriculture, Forestry and Fisheries (MAFF) provides two useful annual statistical books. One is called Nogyo Shokuryo Kanrensangyo no Keizaikeisan (hereafter abbreviated as Keizaikeisan) and provides the MAFF’s estimates for the total values of inputs and outputs in the agricultural sector for every fiscal year (starting on April 1 in one calendar year and ending on March 31 in the next).
The other is Statistics on Agricultural Cooperatives (SAC), which is based on the MAFF’s complete survey of the business records of agricultural cooperatives. The MAFF aggregates data on agricultural cooperatives’ business activities at the prefectural and national levels and publishes the results in SAC. One shortcoming of this data is that each agricultural cooperative reports its business activities based on its own accounting year, which is determined by the individual cooperative. Thus, strictly speaking, data in SAC are not comparable to the MAFF estimates in Keizaikeisan, which are reported on the basis of the standard Japanese fiscal year. However, more than half of the agricultural cooperatives use an accounting year identical to the Japanese fiscal year4. Thus, this paper ignores the difference between cooperatives’ accounting years and fiscal years.
While Keizaikeisan and SAC contain useful information on the agricultural sector and agricultural cooperatives, they are not user-friendly for foreign researchers. Keizaikeisan is written only in Japanese. While SAC includes both Japanese and English titles for surveyed items, it uses special, sometimes difficult-to-understand terminology for surveyed items without providing concrete definitions. Studying the MAFF’s relevant documentation (mostly written in Japanese), this paper also intends to provide an example of an optimal way to use SAC data.
Estimates of agricultural cooperatives’ share of the agricultural inputs market
Keizaikeisan provides the MAFF’s estimates of total expenditures on farming inputs. There are two main types of farming inputs: durable and nondurable. Expenditures on nondurable agricultural inputs include not only payments for tangible goods, such as fertilizers and pesticides, but also charges for intangible goods, such as contract farming and joint-use facilities. Durable agricultural inputs consist of three types of capital: farmland improvements, agricultural machinery, and agricultural buildings. Major farmland improvements, such as installing irrigation systems and reshaping land parcels, are mainly undertaken by the government as public construction projects. Thus, farmland improvements are not included in this paper’s estimates of agricultural cooperatives’ market shares.
Agricultural cooperatives sell various items, such as daily necessities, durable consumer goods, and farming materials. These activities are termed “Purchasing Business” in SAC, which groups such goods into two major categories: Production Materials and Livelihood Necessities. Production Materials consists of seven subcategories: fertilizer, agricultural chemicals, feed, agricultural machinery, oil products, automobiles (excluding two-wheeled vehicles), and others. Livelihood necessities consist of six subcategories: food, clothing, durable consumer goods, miscellaneous commodities for daily use and health maintenance, household fuel, and others. For each subcategory, SAC provides four types of data: value of current supplies procured, portion of this purchased though cooperative channels, value of current supplies handled, and purchasing profit (including commission). “Value of current supplies procured” indicates agricultural cooperatives’ total expenditure for acquiring new stocks from Keizairen, Zen-noh, and other wholesalers during a business year. Of this quantity, the payment from agricultural cooperatives to Keizairen or Zen-noh is calculated as “Portion of this marketed through cooperative channels.” “Value of current supplies handled” refers to the total value of commodities that agricultural cooperatives sold to farmers and non-farmers.
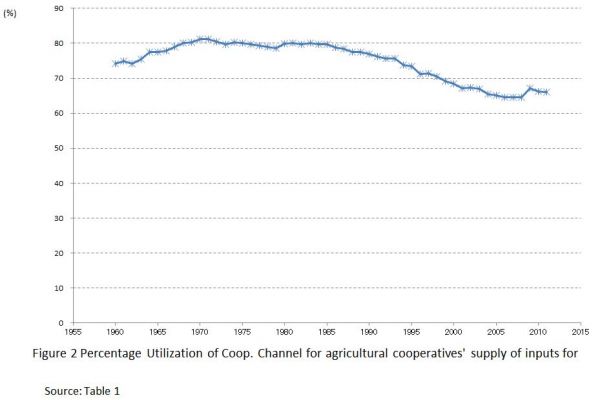
SAC defines the ratio of “Portion of this purchased through cooperative channels” to “Value of current supplies procured” as “Percentage utilization of cooperative channels.” This ratio can be sees as an indicator of the solidarity of the JA Group: the larger the ratio, the stronger the group’s business solidarity.
While SAC includes “Oil products” and “Automobiles (excluding two-wheeled vehicles)” in “production materials,” these two subcategories also contain goods acquired for non-agricultural purposes, as it is difficult to distinguish automobiles and oil used for farming from those used in daily life. Thus, this paper treats only the remaining five subcategories of “Production materials” as farming materials.
In addition to supplying farming materials, agricultural cooperatives provide joint agricultural facilities and contract farming services, referred to in SAC as “Warehousing business” and “Utilization business,” respectively. The total amounts paid by farmers to use these businesses, captured in SAC as “Earnings from warehousing businesses” and “earnings from utilization businesses,” also form part of the agricultural inputs.
Traditionally, “Purchasing business” was one of the main activities undertaken by agricultural cooperatives. Thus, we can use the following two ratios as indicators for agricultural cooperatives’ share of the agricultural input market:
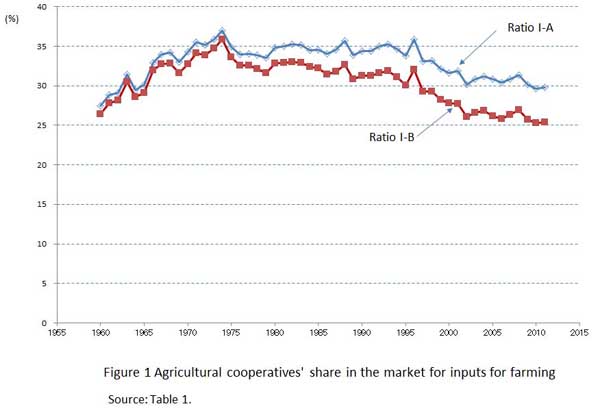
Ratio I-A = {(2) + (3)} / (1) (in percentage terms)
Ratio I-B = (2) / (1) (in percentage terms)
where:
(1) = the sum of expenditures on nondurable agricultural inputs, agricultural machinery, and agricultural building (data from Keizaikeisan).
(2) = the sum of “Value of current supplies handled” for “Fertilizers,” “Agricultural chemicals,” “Feeds,” “Agricultural machinery,” and “Others” in “Production materials” (data from SAC);
(3) = the sum of “Earnings from warehousing business” and “Earnings from utilization business” (data from SAC); and
This paper’s estimates of Ratios I-A, I-B, and “Percentage utilization of cooperative channels” are shown in Table 1 and Figures 1 and 2. As can be seen, both Ratios I-A and I-B increased until the early 1970s, fluctuated from the early 1970s to the mid-1990s, and have followed a declining trend since the mid-1990s. The gap between Ratios I-A and I-B is continually increasing, reflecting farmers’ increasing tendency to contract out portions of the farming process. “Percentage Utilization of Cooperative Channels” was also on an upward trend until the early 1970s. This nearly leveled off between the early 1970s and mid-1980s and has followed a downward trend ever since.
.jpg)
Estimates of agricultural cooperatives’ share of the agricultural outputs market
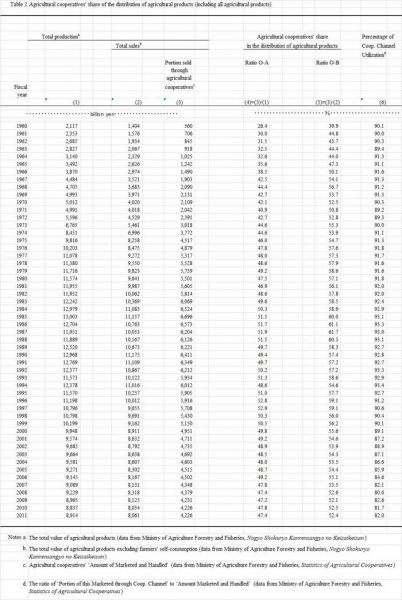
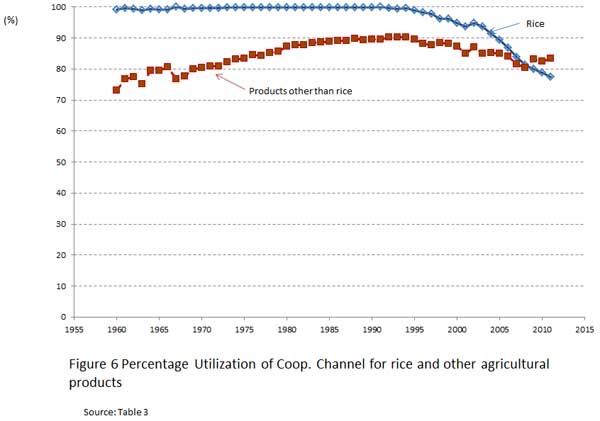
Keizaikeisan provides the MAFF’s estimates for the total value of agricultural products. The data are available not only for the aggregate agricultural products category but also for rice and 12 other categories of agricultural products. Keizaikeisan also provides the MAFF’s estimates for the total value of farmers’ self-consumption (only for all agricultural products combined). By subtracting the total value of self-consumption from that of agricultural products, we can obtain the total value of agricultural products sold.
Agricultural cooperatives’ joint shipments of agricultural products are referred to as “Marketing business” in SAC. SAC categorizes agricultural products into eight groups. For each, it provides three types of data: “Amount marketed and handled,” “Portion of this marketed through cooperative channels,” and “Marketing commissions (including marketing profit).” “Amount marketed and handled” refers to the total amount of money that agricultural cooperatives earned from their joint shipments of agricultural products. If the cooperatives used Keizairen or Zen-noh for these joint shipments, the resulting money is included within “Portion of this Marketed through Cooperative Channels.” SAC defines the ratio of “Portion of this marketed through cooperative channels” to “Amount Marketed and Handled” as “Percentage utilization of cooperative channels.” As was the case for “Purchasing business,” “Percentage utilization of cooperative channels” can be seen as an indicator for measuring the solidarity of the JA Group: the larger the ratio, the stronger its business solidarity.
This paper calculates the following two ratios as indicators of agricultural cooperatives’ shares of the agricultural output market.
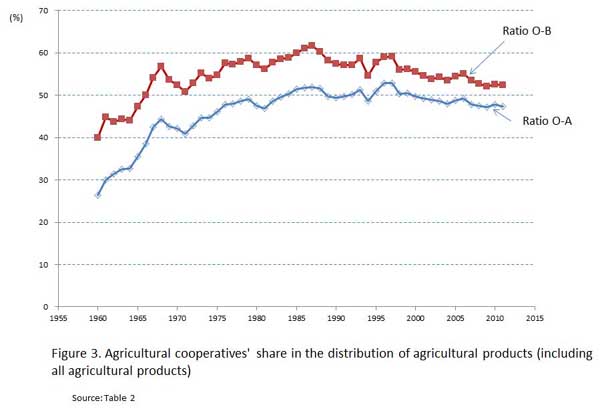
Ratio O-A = (1)/(2) (in percentage terms)
Ratio O-B = (1)/(3) (in percentage terms)
where:
(1) = the total “Amount marketed and handled” for all agricultural commodities (data from SAC);
(2) = the total value of agricultural products (data from Keizaikeisan); and
(3) = the total value of agricultural products sold (data from Keizaikeisan).
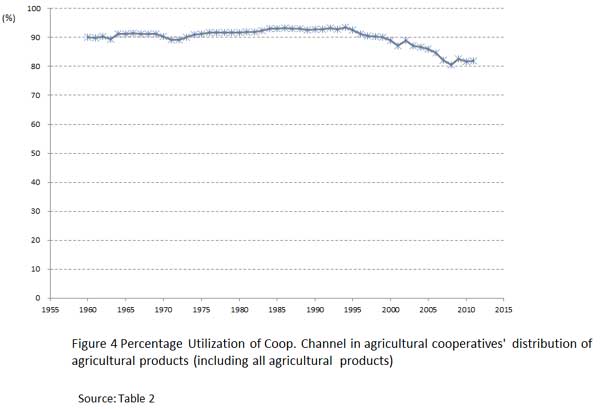
The results are shown in Table 2 and Fig. 3 and Fig 4. As can be seen, Ratio O-A followed an upward trend until the end of the 1980s and a downward trend ever since. Ratio O-B was on an upward trend until the end of the 1990s and a downward trend ever since. The gap between the two ratios narrowed over the estimation period. Similarly, “Percentage Utilization of Cooperative Channels” was on an upward trend until the mid-1990s and on a sharp downward trend ever since.
Rice is the staple food for Japanese consumers, and its distribution was formerly treated specially by the MAFF. Under the Food Control Law (FCL), which was effective until 1995, agricultural cooperatives were given the privilege of marketing rice at a stable margin guaranteed by the MAFF5.
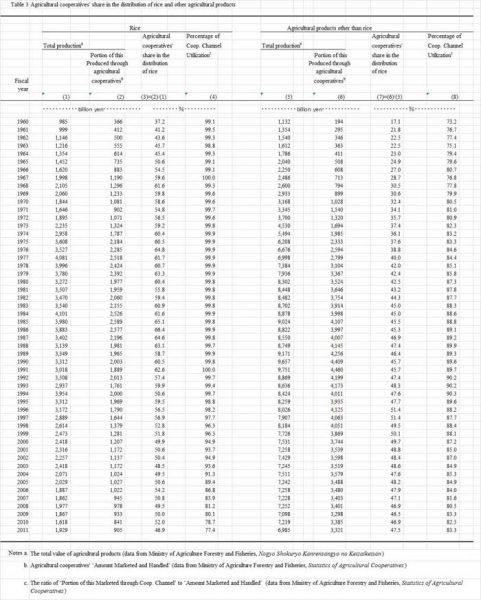
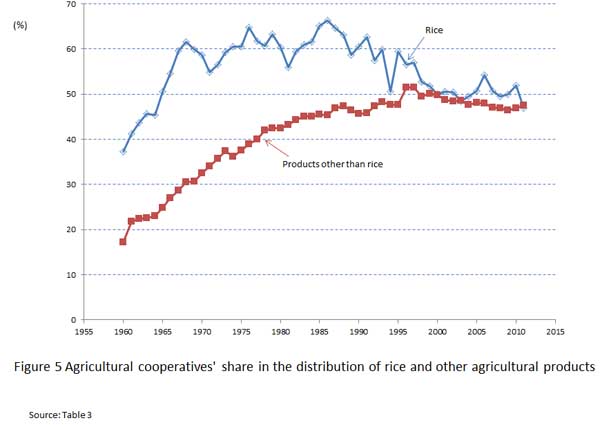
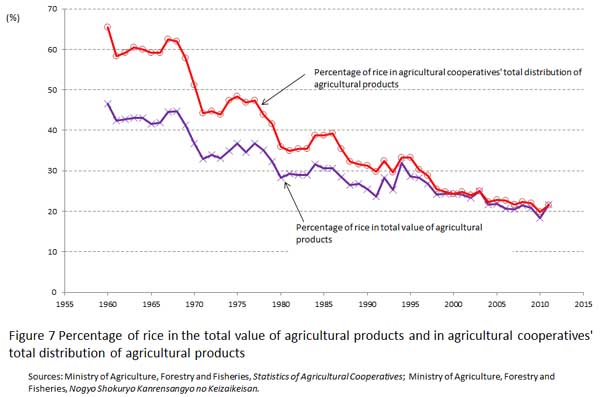
Keizaikeisan and SAC provide enough information to calculate Ratio O-A and “Percentage utilization of cooperative channels” for rice and others goods separately. The results are shown in Table 3 and Figures 5 and 6. The percentage of rice in the total value of agricultural products and in “Amount Marketed and Handled” (for all agricultural products together) declined over the period examined (Figure 7).
Table 3 and Figures 5, 6, and 7 imply that agricultural cooperatives had an advantage in distributing rice under the FCL: agricultural cooperatives showed especially strong solidarity and enjoyed a large market share for rice until 1995. However, this advantage has disappeared. In recent years, there has been no significant difference between rice and other commodities in terms of Ratio O-A or “Percentage Utilization of Cooperative Channels.”
Conclusion
This paper’s estimates imply that the JA Group enjoys strong market power as a unified economic group. Agricultural cooperatives’ share of the agricultural input market is now nearly as high as 30%. Agricultural cooperatives rely heavily on Keizairen and Zen-noh (nearly 70%) to obtain new stocks of agricultural materials. The cooperatives’ share in the agricultural output market (considering all agricultural products jointly) is currently nearly 80%, and nearly 80% of agricultural cooperatives’ joint shipments are routed through Keizairen or Zen-noh.
However, this paper’s estimates also show that the JA Group’s market share and solidarity have been gradually declining since the mid-1990s. Japanese markets have undergone various revolutions since this time, with market competition becoming fiercer for many types of commodities. This paper’s analysis has indicated that agricultural inputs and outputs markets are no exceptions to this general trend.
Footnotes
- An overview of Japanese agricultural cooperatives is given by http://ap.fftc.agnet.org/ap_db.php?id=248.
- There are two types of agricultural cooperative membership: regular membership for farmers and associate membership for non-farmers. Details of the difference between the two types are discussed in http://ap.fftc.agnet.org/ap_db.php?id=264.
- There are three types of agricultural cooperatives: multifunctional cooperative, special cooperative, and agricultural producers’ cooperative corporation. Among them, multifunctional cooperatives are the most common, with 728 nationwide. More information on special cooperatives and agricultural producers’ cooperative corporations are given at http://ap.fftc.agnet.org/ap_db.php?id=248 and http://ap.fftc.agnet.org/ap_db.php?id=380.
- The latest version of SAC reports that an accounting year is the same as a Japanese fiscal year for 54.0% of agricultural cooperatives (see http://www.e-stat.go.jp/SG1/estat/List.do?lid=000001119700 ).
- Details of the Food Control Law are given at http://ap.fftc.agnet.org/ap_db.php?id=107.
|
Date submitted: Feb. 27, 2015
Reviewed, edited and uploaded: March 2, 2015
|

Estimating Agricultural Cooperatives’ Share of Agricultural Input and Output Markets
Yoshihisa Godo
Professor, Meiji Gakuin University, Japan
Introduction
Japan’s unique system of agricultural cooperatives forms a nationwide network, called the JA Group. This mammoth economic body organizes almost all Japanese farmers and has played a key role in shaping the rural economy since the Agricultural Cooperative Law (ACL) was enacted in 19471. Evaluation of the JA Group differs among researchers. Some praise the group as protecting farmers’ benefits, while others criticize it as an “old guard” that is more concerned with its own vested interests than with improving agricultural productivity.
This debate has recently gained new relevance, as a full revision of the ACL and related laws is now placed atop Japan’s political agenda. Throughout the general election campaign in December 2014, Prime Minister Abe repeatedly asserted that the reform of the JA Group would be the centerpiece of his policy agenda’s “New Growth Strategy.” A fierce controversy is thus currently raging, both among policymakers and the general public, over how to reform the JA Group.
The purpose of this paper is not to voice any specific opinion on how the JA Group should be reformed. Instead, it aims to provide objective information on the economic position of agricultural cooperatives within inputs and outputs markets in Japan. It is hoped that this information can form a foundation upon which to consider what the JA Group should be. To this end, the next two sections offer a brief overview of the system and relevant data sources, after which Sections 4 and 5 analyze this data to describe cooperatives’ shares in Japan’s inputs and outputs markets. Section 6 concludes.
Japan’s system of agricultural cooperatives
Agricultural cooperatives in Japan provide not only agricultural services but also almost every other service required for daily life. In addition to farmers, non-farmers who have paid dues are allowed to use all the cooperatives’ services as associate members under the same conditions as farmers2.
Each agricultural cooperative has its own jurisdiction, and these do not overlap. As of April 1, 2014, there were 728 agricultural cooperatives in Japan3. The size and human resources available to any one agricultural cooperative are insufficient to enable it to compete with private businesses, such as supermarkets and trading companies. To conquer this weakness, agricultural cooperatives form federations at the prefectural and national levels. These federations are referred to as Keizairen and Zen-noh, respectively, and act as cooperatives’ agents in the buying and selling of agricultural and non-agricultural commodities.
Data sources
For information on cooperatives, the Ministry of Agriculture, Forestry and Fisheries (MAFF) provides two useful annual statistical books. One is called Nogyo Shokuryo Kanrensangyo no Keizaikeisan (hereafter abbreviated as Keizaikeisan) and provides the MAFF’s estimates for the total values of inputs and outputs in the agricultural sector for every fiscal year (starting on April 1 in one calendar year and ending on March 31 in the next).
The other is Statistics on Agricultural Cooperatives (SAC), which is based on the MAFF’s complete survey of the business records of agricultural cooperatives. The MAFF aggregates data on agricultural cooperatives’ business activities at the prefectural and national levels and publishes the results in SAC. One shortcoming of this data is that each agricultural cooperative reports its business activities based on its own accounting year, which is determined by the individual cooperative. Thus, strictly speaking, data in SAC are not comparable to the MAFF estimates in Keizaikeisan, which are reported on the basis of the standard Japanese fiscal year. However, more than half of the agricultural cooperatives use an accounting year identical to the Japanese fiscal year4. Thus, this paper ignores the difference between cooperatives’ accounting years and fiscal years.
While Keizaikeisan and SAC contain useful information on the agricultural sector and agricultural cooperatives, they are not user-friendly for foreign researchers. Keizaikeisan is written only in Japanese. While SAC includes both Japanese and English titles for surveyed items, it uses special, sometimes difficult-to-understand terminology for surveyed items without providing concrete definitions. Studying the MAFF’s relevant documentation (mostly written in Japanese), this paper also intends to provide an example of an optimal way to use SAC data.
Estimates of agricultural cooperatives’ share of the agricultural inputs market
Keizaikeisan provides the MAFF’s estimates of total expenditures on farming inputs. There are two main types of farming inputs: durable and nondurable. Expenditures on nondurable agricultural inputs include not only payments for tangible goods, such as fertilizers and pesticides, but also charges for intangible goods, such as contract farming and joint-use facilities. Durable agricultural inputs consist of three types of capital: farmland improvements, agricultural machinery, and agricultural buildings. Major farmland improvements, such as installing irrigation systems and reshaping land parcels, are mainly undertaken by the government as public construction projects. Thus, farmland improvements are not included in this paper’s estimates of agricultural cooperatives’ market shares.
Agricultural cooperatives sell various items, such as daily necessities, durable consumer goods, and farming materials. These activities are termed “Purchasing Business” in SAC, which groups such goods into two major categories: Production Materials and Livelihood Necessities. Production Materials consists of seven subcategories: fertilizer, agricultural chemicals, feed, agricultural machinery, oil products, automobiles (excluding two-wheeled vehicles), and others. Livelihood necessities consist of six subcategories: food, clothing, durable consumer goods, miscellaneous commodities for daily use and health maintenance, household fuel, and others. For each subcategory, SAC provides four types of data: value of current supplies procured, portion of this purchased though cooperative channels, value of current supplies handled, and purchasing profit (including commission). “Value of current supplies procured” indicates agricultural cooperatives’ total expenditure for acquiring new stocks from Keizairen, Zen-noh, and other wholesalers during a business year. Of this quantity, the payment from agricultural cooperatives to Keizairen or Zen-noh is calculated as “Portion of this marketed through cooperative channels.” “Value of current supplies handled” refers to the total value of commodities that agricultural cooperatives sold to farmers and non-farmers.
SAC defines the ratio of “Portion of this purchased through cooperative channels” to “Value of current supplies procured” as “Percentage utilization of cooperative channels.” This ratio can be sees as an indicator of the solidarity of the JA Group: the larger the ratio, the stronger the group’s business solidarity.
While SAC includes “Oil products” and “Automobiles (excluding two-wheeled vehicles)” in “production materials,” these two subcategories also contain goods acquired for non-agricultural purposes, as it is difficult to distinguish automobiles and oil used for farming from those used in daily life. Thus, this paper treats only the remaining five subcategories of “Production materials” as farming materials.
In addition to supplying farming materials, agricultural cooperatives provide joint agricultural facilities and contract farming services, referred to in SAC as “Warehousing business” and “Utilization business,” respectively. The total amounts paid by farmers to use these businesses, captured in SAC as “Earnings from warehousing businesses” and “earnings from utilization businesses,” also form part of the agricultural inputs.
Traditionally, “Purchasing business” was one of the main activities undertaken by agricultural cooperatives. Thus, we can use the following two ratios as indicators for agricultural cooperatives’ share of the agricultural input market:
Ratio I-A = {(2) + (3)} / (1) (in percentage terms)
Ratio I-B = (2) / (1) (in percentage terms)
where:
(1) = the sum of expenditures on nondurable agricultural inputs, agricultural machinery, and agricultural building (data from Keizaikeisan).
(2) = the sum of “Value of current supplies handled” for “Fertilizers,” “Agricultural chemicals,” “Feeds,” “Agricultural machinery,” and “Others” in “Production materials” (data from SAC);
(3) = the sum of “Earnings from warehousing business” and “Earnings from utilization business” (data from SAC); and
This paper’s estimates of Ratios I-A, I-B, and “Percentage utilization of cooperative channels” are shown in Table 1 and Figures 1 and 2. As can be seen, both Ratios I-A and I-B increased until the early 1970s, fluctuated from the early 1970s to the mid-1990s, and have followed a declining trend since the mid-1990s. The gap between Ratios I-A and I-B is continually increasing, reflecting farmers’ increasing tendency to contract out portions of the farming process. “Percentage Utilization of Cooperative Channels” was also on an upward trend until the early 1970s. This nearly leveled off between the early 1970s and mid-1980s and has followed a downward trend ever since.
Estimates of agricultural cooperatives’ share of the agricultural outputs market
Keizaikeisan provides the MAFF’s estimates for the total value of agricultural products. The data are available not only for the aggregate agricultural products category but also for rice and 12 other categories of agricultural products. Keizaikeisan also provides the MAFF’s estimates for the total value of farmers’ self-consumption (only for all agricultural products combined). By subtracting the total value of self-consumption from that of agricultural products, we can obtain the total value of agricultural products sold.
Agricultural cooperatives’ joint shipments of agricultural products are referred to as “Marketing business” in SAC. SAC categorizes agricultural products into eight groups. For each, it provides three types of data: “Amount marketed and handled,” “Portion of this marketed through cooperative channels,” and “Marketing commissions (including marketing profit).” “Amount marketed and handled” refers to the total amount of money that agricultural cooperatives earned from their joint shipments of agricultural products. If the cooperatives used Keizairen or Zen-noh for these joint shipments, the resulting money is included within “Portion of this Marketed through Cooperative Channels.” SAC defines the ratio of “Portion of this marketed through cooperative channels” to “Amount Marketed and Handled” as “Percentage utilization of cooperative channels.” As was the case for “Purchasing business,” “Percentage utilization of cooperative channels” can be seen as an indicator for measuring the solidarity of the JA Group: the larger the ratio, the stronger its business solidarity.
This paper calculates the following two ratios as indicators of agricultural cooperatives’ shares of the agricultural output market.
Ratio O-A = (1)/(2) (in percentage terms)
Ratio O-B = (1)/(3) (in percentage terms)
where:
(1) = the total “Amount marketed and handled” for all agricultural commodities (data from SAC);
(2) = the total value of agricultural products (data from Keizaikeisan); and
(3) = the total value of agricultural products sold (data from Keizaikeisan).
The results are shown in Table 2 and Fig. 3 and Fig 4. As can be seen, Ratio O-A followed an upward trend until the end of the 1980s and a downward trend ever since. Ratio O-B was on an upward trend until the end of the 1990s and a downward trend ever since. The gap between the two ratios narrowed over the estimation period. Similarly, “Percentage Utilization of Cooperative Channels” was on an upward trend until the mid-1990s and on a sharp downward trend ever since.
Rice is the staple food for Japanese consumers, and its distribution was formerly treated specially by the MAFF. Under the Food Control Law (FCL), which was effective until 1995, agricultural cooperatives were given the privilege of marketing rice at a stable margin guaranteed by the MAFF5.
Keizaikeisan and SAC provide enough information to calculate Ratio O-A and “Percentage utilization of cooperative channels” for rice and others goods separately. The results are shown in Table 3 and Figures 5 and 6. The percentage of rice in the total value of agricultural products and in “Amount Marketed and Handled” (for all agricultural products together) declined over the period examined (Figure 7).
Table 3 and Figures 5, 6, and 7 imply that agricultural cooperatives had an advantage in distributing rice under the FCL: agricultural cooperatives showed especially strong solidarity and enjoyed a large market share for rice until 1995. However, this advantage has disappeared. In recent years, there has been no significant difference between rice and other commodities in terms of Ratio O-A or “Percentage Utilization of Cooperative Channels.”
Conclusion
This paper’s estimates imply that the JA Group enjoys strong market power as a unified economic group. Agricultural cooperatives’ share of the agricultural input market is now nearly as high as 30%. Agricultural cooperatives rely heavily on Keizairen and Zen-noh (nearly 70%) to obtain new stocks of agricultural materials. The cooperatives’ share in the agricultural output market (considering all agricultural products jointly) is currently nearly 80%, and nearly 80% of agricultural cooperatives’ joint shipments are routed through Keizairen or Zen-noh.
However, this paper’s estimates also show that the JA Group’s market share and solidarity have been gradually declining since the mid-1990s. Japanese markets have undergone various revolutions since this time, with market competition becoming fiercer for many types of commodities. This paper’s analysis has indicated that agricultural inputs and outputs markets are no exceptions to this general trend.
Footnotes
Date submitted: Feb. 27, 2015
Reviewed, edited and uploaded: March 2, 2015