Richard B. Daite
Department of Economics
University of the Philippines Los Baños
email: rbdaite@gmail.com
ABSTRACT
The establishment of the ASEAN Economic Community 2015 is seen as a bold effort to promote regional cooperation among the ASEAN member states. It covers not only the usual trade policy prescriptions of lowering tariffs and other trade barriers, but other policy measures to create a single market for unhampered flow of goods, services, investments, labor and capital. With the ASEAN countries’ extensive intra- and extra-regional trade in agricultural products, the AEC can help further facilitate trade under its first pillar of economic integration. There also remains greater prospects for cooperation on technology transfer, facilitating regional investments in agricultural industries, strengthening agricultural cooperatives, trade in services allied with modern agricultural sectors, and food and nutrition security.
Key words: ASEAN, trade, agriculture, ASEAN Economic Community, regional integration
INTRODUCTION
The Southeast Asian region is fast progressing towards the full establishment of the ASEAN Economic Community (AEC), with country commitments already made to fully implement the AEC by 2015. These commitments include reducing tariffs and other barriers to trade, but the AEC envisions multiple policy responses that go beyond the usual trade policy instruments. How the foreseen regional integration affects sectors of the economies, specifically in agriculture, would be informative. With growing food security concerns in the region, international trade in agricultural products and cross-country cooperation to raise productivity remain among top national issues in the region.
This paper aims to provide an overview of trends in economy and trade in Southeast Asia, with focus on changes in trade patterns and the underlying factors driving those. It then reviews the major features of the AEC in 2015, and the possible elements that are likely to change in that context. Prospects for agriculture and allied sectors are offered, and further questions are raised on the possible implications of the AEC on the ASEAN Region.
A Brief Overview of the ASEAN Region
The 10-member ASEAN, encompassing 600 million people, is characterized by economies with varying economic profiles. The combined GDP of ASEAN reached US$ 2.3 trillion (in current prices) in 2012, with Indonesia being the largest economy in the region (Table 1). Over the last five years, the region’s real GDP growth posted quite impressive figures, even in the aftermath of the Asian Financial Crisis of 2007. In terms of contribution of agriculture to the national economy, transition economies in ASEAN still rely on agriculture as a main economic driver. Agricultural gross value added in Cambodia, Lao PDR, and Myanmar account for more than 30% of their respective GDP. Singapore and Brunei have the smallest agriculture sector, while Vietnam, Indonesia, the Philippines and Thailand have about 10-20% of their economies contributed by agriculture.
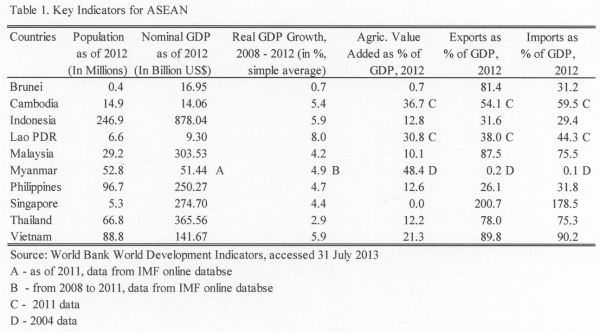
The region also shows indications of openness to trade. Total trade (exports plus imports) of Singapore, a world trading hub, accounted for around 380% of GDP. Brunei, Cambodia, Malaysia, Thailand, and Vietnam have total trade exceeding 100% of GDP.
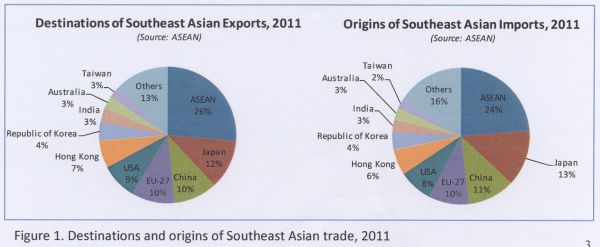
Still a good portion of international trade by ASEAN economies is intra-regional in nature. In 2011, destinations and origins of Southeast Asian exports and imports are mainly to and from the region itself (Figure 1). Other important trading partners are China, the European Union-27, and the United States.
ASEAN trade are mostly in manufactures, with imports and exports of this product group growing substantially from 2000 to 2012 (Figure 2). Trade in fuels and mining products also saw a significant increase, while agricultural products continue to be key imports and exports in ASEAN.
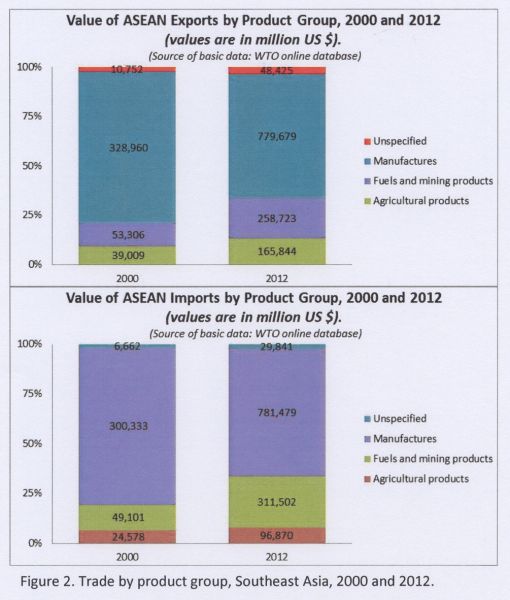
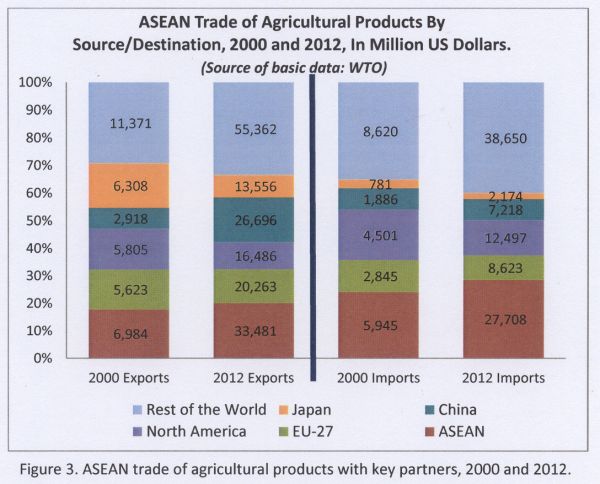
Figure 3 below shows the flow of agricultural trade to and from the region with important economic partners. The ASEAN region itself remains a key export destination, where about a fifth of total agricultural exports of the region have gone from 2000 to 2012. The shares of agricultural exports to traditional partners such as Japan, North America, and EU-27 have gone down, while that of China has grown considerably for the same period. In terms of imports, intra-ASEAN trade remains significant.
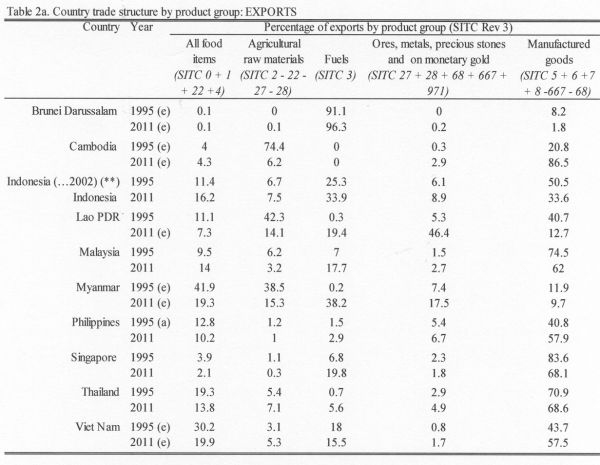
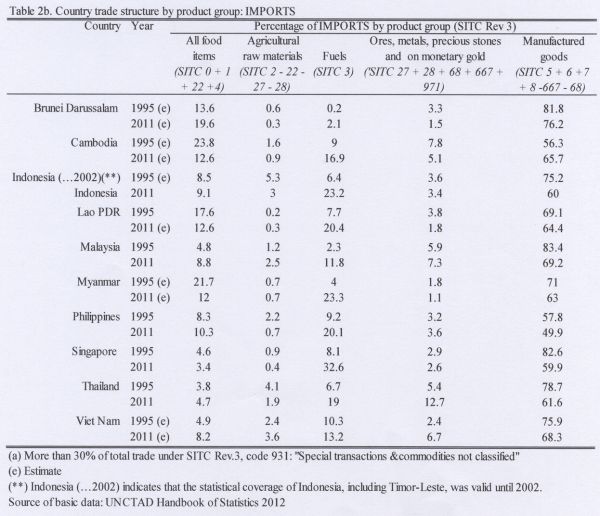
Tables 2a and 2b show the changes in country structure by product group from 1995 to 2011. In terms of exports, the percentage share of food and agricultural exports have gone down in countries such as Cambodia, Lao PDR, and Myanmar, favoring higher export shares for manufactured goods or ores, metals and precious stones. Trade in manufactures goods have dominated the trade patterns of most of the ASEAN countries, especially in imports of these goods.
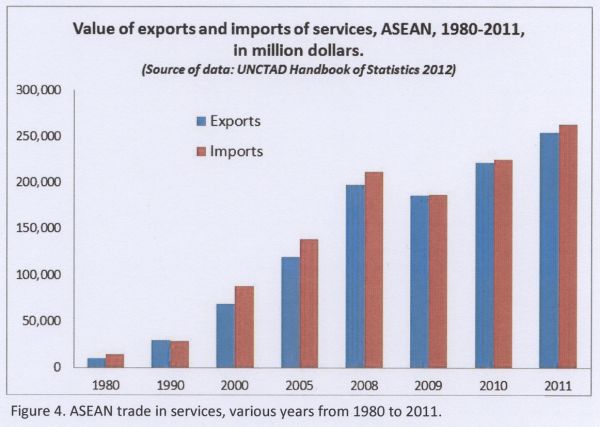
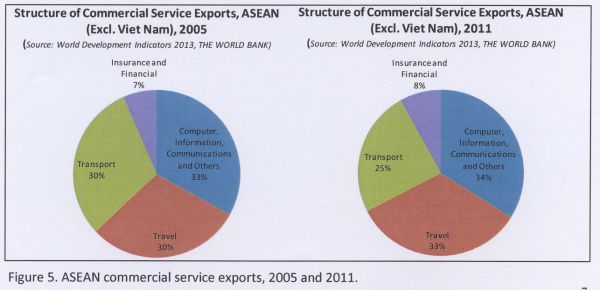
ASEAN trade in services have grown rapidly through the years. From about US$ 24 billion in trade (imports plus exports) of services, the value stood at US$ 518 billion in 2011 (Figure 4). Commercial services exports of ASEAN are mostly on computer, information, communications and others (Figure 5). Travel services constitute about a third of commercial service exports. From 2005 to 2011, the total value of commercial service exports grew from US$ 112 billion to US$ 245 billion, representing 4% and 6% of world total in the respective years.
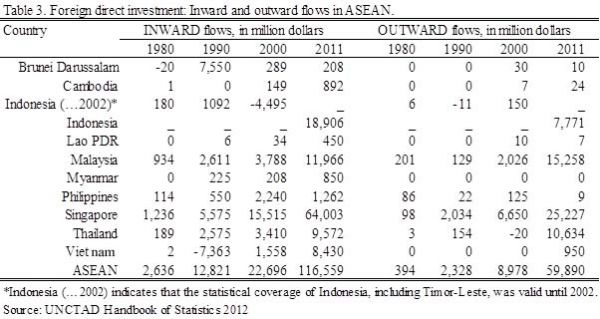
The SEA region saw net inflows of foreign direct investments in the past 30 years (Table 3). In 2011, net inflows of FDIs for the ASEAN stood at US$ 57 billion, most of this accounted for by Singapore and Indonesia. Other major destinations of FDIs in 2011 were Malaysia, Thailand and Vietnam.
The above profile shows the continued importance of trade and investments in the region, and the changing patterns in individual countries. Strengthening regional integration in ASEAN as envisioned by AEC could help further boost trade and investments, benefiting the different sectors of country-members.
ASEAN ECONOMIC COMMUNITY (AEC) BLUEPRINT: OVERVIEW AND KEY ACCOMPLISHMENTS[1]
As early as 2003, definitive steps were already undertaken to lay the groundwork for the institution of the AEC. In the 9th Summit of the Association of Southeast Asian Nations (ASEAN) in Bali, Indonesia (2003), the heads of ASEAN member-states passed the Declaration of ASEAN Concord II (or the Bali Concord II) which pronounced the establishment of an ASEAN Community by the year 2020. The vision was to promote greater political, security, and economic cooperation in the region. One of the three overarching frameworks in this accord is the ASEAN Economic Community (AEC)[2] which envisions economic integration in the region through the freer flow of goods, services, investments, capital and skilled labor. Subsequently, in the 12th ASEAN Summit in Cebu, the Philippines in January of 2007, the ASEAN Leaders agreed to accelerate the establishment of the ASEAN Community to 2015, which included the AEC. In the following Summit in Singapore in November 2007, the Leaders signed and adopted the AEC Blueprint which serves as the detailed master plan in establishing the AEC by 2015. The AEC Blueprint “will transform ASEAN into a single market and production base, a highly competitive economic region, a region of equitable economic development, and a region fully integrated into the global economy.” (AEC Blueprint, 2008, p. 2)
The AEC’s goal of regional economic integration rests on four pillars: 1) single market and production base; 2) competitive economic region; 3) equitable economic development; and 4) integration into the global economy. Under each pillar are core elements which require specific actions and strategic approaches to realize the intended outcomes (see Box 1). Implementation follows a clear schedule done in four phases: 2008-2009, 2010-2011, 2012-2013, and 2014- 2015. The Blueprint also spells out an implementation mechanism that identifies responsibility centers and provides for regular monitoring and evaluation. In fact, ASEAN came up with the AEC Scorecard which is a monitoring mechanism to track the progress of implementing the AEC measures. The latest scorecard (as of 2012) reports the accomplishment of the AEC implementation in the first two phases, from 2008 to 2011. Further, a report on the mid-term review of the implementation of the AEC Blueprint was completed in October 2012 based on the AEC Scorecards and other review mechanisms undertaken.
The mid-term review (MTR) reported substantial accomplishments in implementing the Blueprint. The most noteworthy is the reduction and elimination of tariffs in the region, with the CEPT[3] rates practically zero in the ASEAN 6 (Brunei, Indonesia, Malaysia, Philippines, Singapore, Thailand) and an average of only 2.6% for the CLMV countries (Cambodia, Lao PDR, Myanmar, Vietnam) in 2010 (MTR, 2012). There was also an important headway on trade facilitation, with five (5) ASEAN Member States (AMSs)-- Indonesia, Malaysia, Philippines, Singapore and Thailand--having live implementation of National Single Windows (NSW) and two (Brunei and Vietnam) are well on their way to full NSW development. Other key accomplishments were on investment liberalization, the Roadmap for Integration of Air Travel Sector (RIATS), the signing of the five ASEAN+1 FTAs that cover all of the ASEAN+6 partners, the signing of the Chiang Mai Initiative, and various regional cooperation initiatives in many areas (such as agriculture, competition policy and IPR).
There are, however, implementation areas that need further marked improvement. The issues on Non-Tariff Measures (NTMs) need to be further addressed, especially on the non-tariff barrier (NTB)[4] effects of NTMs that continue to be imposed for legitimate reasons. The determination of NTB effects is difficult, and data on NTBs are hard to obtain, thus the restrictiveness of NTMs that are continually in place cannot be ascertained. In terms of trade facilitation, full implementation of the ASEAN Single Window rests on well-functioning National Single Windows in all AMSs, which are difficult to come by due to the varying levels of customs performance among the individual AMSs in the region. In terms of liberalizing investment, liberalization in the agricultural sector and the oil/gas sector remains tricky due to political economy concerns in a number of AMSs (MTR, 2012).
Box 1. Pillars and core elements of the ASEAN Economic Community Blueprint
|
Pillars
|
Core Elements
|
Key Strategic Areas of Action
|
|
A. Single Market and Production Base
|
A1. Free Flows of Goods
|
- Tariffs Reduction / Elimination
|
|
- Elimination of Non- Tariff Barriers
|
|
- Rules of Origin
|
|
- Trade Facilitation
|
|
- Customs Integration (Customs Development, ASEAN Single Window, Standards and Conformance)
|
|
A2. Free Flows of Services
|
- Services Liberalisation under ASEAN Framework Agreement on Services (AFAS)
|
|
- Mutual Recognition Arrangements (MRAs)
|
|
- Financial Services Sector
|
|
A3. Free Flows of Investment
|
- ASEAN Investment Agreement (AIA)
|
|
- Liberalization / Facilitation / Promotion / Protection
|
|
A4. Freer Flows of Capital
|
- ASEAN Capital Market Development and Integration
|
|
- Capital mobility
|
|
- Foreign Direct Investment / Portfolio Investment
|
|
- Current Account Transactions
|
|
- Facilitation
|
|
A5. Free Flows of Skilled Labor
|
- Mutual Recognition Arrangements (MRAs)
|
|
- Core competency development
|
|
A6. Priority Integration Sectors
|
- M&E of Priority Integration Sector (PIS) roadmaps
|
|
- Sector-specific projects or initiatives
|
|
A7. Food, Agriculture and Forestry
|
- Harmonization and application of quality standards for food safety
|
|
- Cooperation and technology transfer with international organizations and private sector
|
|
- Market access through ASEAN agricultural cooperatives
|
|
B. Highly Competitive Economic Region
|
B1. Competition Policy
|
- Capacity building and adoption of best practices
|
|
B2. Consumer Protection
|
- Establishment of the ASEAN Coordinating Committee on Consumer Protection (ACCCP)
|
|
B3. Intellectual Property Rights
|
- Intellectual Property Rights Action Plan
|
|
B4. Infrastructure Development
|
- Transport Action Plan
|
|
- ASEAN Framework Agreement on Multimodal Transport
|
|
- ASEAN Framework Agreement on the Facilitation of Goods in Transit (AFAFGIT)
|
|
- ASEAN Framework Agreement on the Facilitation of Inter- State Transport (FAIST)
|
|
- Roadmaps for Integration of Air Travel Sector (RIATS)
|
|
- Roadmap towards an Integrated and Competitive Maritime Transport in ASEAN
|
|
- ASEAN Power Grid
|
|
- Trans-ASEAN Gas Pipeline
|
|
B5. Taxation
|
- Bilateral agreements on avoidance of double taxation
|
|
B6. E-Commerce
|
- E-commerce laws / capacity building
|
|
C. Equitable Economic Development
|
C1. SME Development
|
- ASEAN Policy Blueprint for SME Development
|
|
C2. Initiatives for ASEAN Integration (IAI)
|
- M&E / Capacity building
|
|
D. Full Integration into the Global Economy
|
D1. Coherent approach towards external economic relations
|
- “ASEAN Centrality” in negotiations for free trade (FTAs) and comprehensive economic partnership (CEPs) agreements.
|
|
D2. Enhanced participation in global supply networks
|
- International best practices and standards in production and distribution
|
IMPLICATIONS ON AGRICULTURAL TRADE IN THE REGION
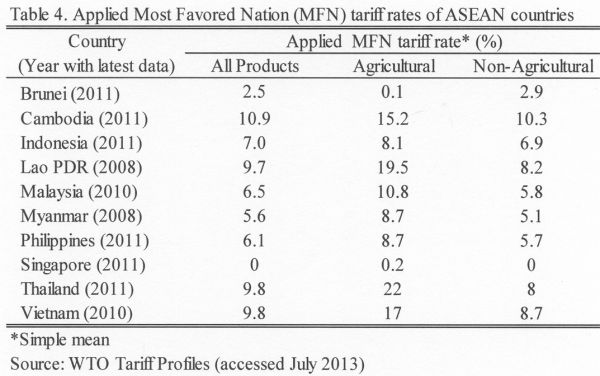
Under the Single Market and Production Base pillar of the AEC, food, agriculture and forestry are considered priority sectors. In fact, the AEC renews calls for the further lowering and removal of tariffs to boost intra- and extra-ASEAN agricultural trade and the adoption and harmonization of quality management systems for food safety. But even prior to the AEC, tariff elimination in many product lines has been steady, including in the agriculture sector. As of the latest figures, the applied Most Favoured Nation (MFN) tariff rates of ASEAN countries ranged from 0% to 11% in all products, with tariffs for agricultural products averaging from 0.1% to 22% (Table 4).
Intra-ASEAN Commitments via the CEPT-AFTA scheme and the ASEAN Trade in Goods Agreement (ATIGA) are even lower. Under the ATIGA, import duties on all products traded within ASEAN shall be eliminated by 2010 in the ASEAN 6 and by 2018 in the CLMV countries. Exceptions are given for products in the negative list under the Priority Integration Sectors, and for unprocessed agricultural products under Schedule E.
ASEAN as a group has also forged free trade agreements (FTAs) with other non-ASEAN countries in the Asia-Pacific Region. Specifically, ASEAN has existing individual FTAs with China, Japan, South Korea, India, and Australia and New Zealand which all called for freer trade with these countries mainly through tariffs reduction and trade facilitation. In terms of agricultural trade, the lowering of tariffs with these partners bodes well for the region which is a net importer of some agricultural product lines. The further expansion of FTAs to other regional and economic blocs that serve as ASEAN’s important trading partners in agricultural products, such as Europe and North America, can help further boost the flow of these goods in the region.
Given the steady decline in tariffs on agricultural products in the region, perhaps a more important trade issue is the imposition of non-tariff measures. While the AEC Blueprint MTR recognizes the efforts to eliminate NTBs and reduce the NTB effects of NTMs, the quantification of these effects are difficult. The MTR noted four major groups of NTMs that are of interest: 1) technical barriers to trade; 2) sanitary and phyto-sanitary standards (SPS); 3) customs related measures; and 4) the so-called “core NTMs”. Core NTMs as defined in the MTR are those pertaining to non-automatic licensing; quantitative restrictions; prohibitions; enterprise-specific; single channel for imports; and foreign exchange market restrictions. In terms of agricultural trade in the region, most of these NTMs were on technical regulations (labeling; quality standards; SPS; testing , inspection and quarantine measures;) and import licensing (import permit, certificate of approval) chiefly for SPS, health, and food safety reasons. How these NTMs serve as significant barriers to trade have yet to be quantified, even though varying legitimate reasons are cited by imposing countries (such as for religious and cultural purposes, health reasons, and public safety concerns).
On another related issue, the MTR reports notable progress in standardizing practices quality systems such as adoption of Good Agriculture Practices (GAPs), Good Aquaculture Practices (GAqPs), Good Animal Husbandry Practices (GAHPs), Good Hygiene Practices (GHPs), Good Manufacturing Practices (GMPs), and Hazard Analysis Critical Control Point (HACCP)-based systems. The harmonization of agricultural products would help ensure the free flow of safe and qualified products and raise competitiveness in international markets. But in addition, regional cooperation on these systems may also have an effect on addressing SPS-related issues embodied in the NTMs. Technical regulations from SPS and foods safety-related NTMs can be better hurdled through the continued improvement in standards and certifications of good quality. As mentioned earlier, NTMs related to agricultural products in the ASEAN region are dominated by technical regulations and import licenses chiefly for SPS, health, and food safety reasons.
Still a priority initiative of the AEC Blueprint is the enhancement of its third pillar (equitable economic development). Under this is the recognition of the strategic importance of small- and medium-sized enterprises (SME) for equitable growth in the region. The Blueprint has proposed measures for continued SME development in the region through facilitating access to finance, information, markets, and technology. The smallhold and medium-sized agricultural industries in the region may stand to gain from the AEC’s quest for SME development in the Region, as well as the promotion of ASEAN agricultural cooperatives to enhance market access of agricultural products.
Regional cooperation in services may not be as less progressive compared to other sectors such as in goods and investments. Given the priority given by AEC, this suggests huge potentials for growth and cooperation in the services sectors, which currently dominate the economic profile of many countries in the region.
The AEC efforts in liberalizing investments and facilitation of trade may augur well for the agricultural industry. The continued quest for modernizing agricultural enterprises comes with the requirement of more capital, better input use and technology packages. Furthermore, adequate support systems should also be in place to ensure their development. For example, poor roads and logistics often hamper the efficient functioning of agricultural markets in the region. In this light, the free flow of investments and capital in the region can help ASEAN countries prop up their agricultural industries. Also, as emphasized above, modernizing agricultural industries requires adequate facilities, highly-trained personnel, advanced technology, and efficient transportation systems, especially with the high perishability characteristic of food and agriculture products. Thus, the AEC Blueprint’s focus on improved logistics and transport systems, better trade facilitation, and free movement of skilled labor would be welcome developments for the ASEAN agricultural industry in this regard.
THE CASE OF THE PHILIPPINES
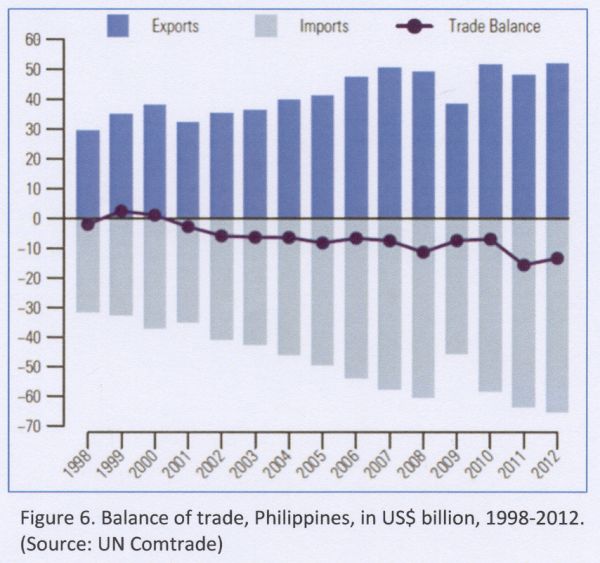
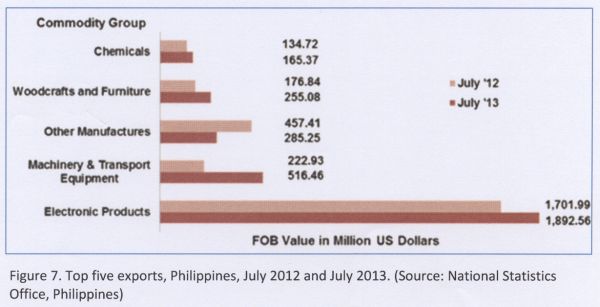
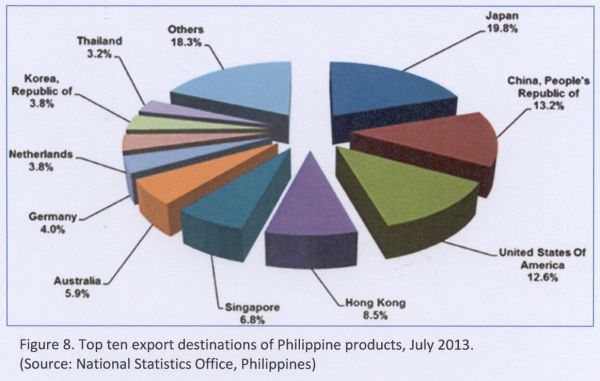
The Philippines is one of the pioneer ASEAN Member States. It is traditionally a net importer of internationally-trade products, with a trade balance deficit reaching US$ 13 Billion in 2012 (Figure 6). Its top exports are electronic products, accounting for 39% of export revenues in the month of July 2013 (Fig. 7), which are mostly shipments of semiconductor components and devices. The country’s major export destinations are Japan, China, The United States, Hong Kong and Singapore (Fig. 8).
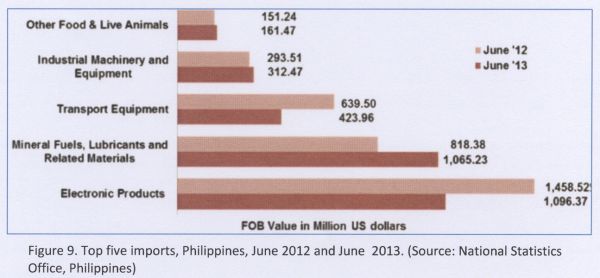
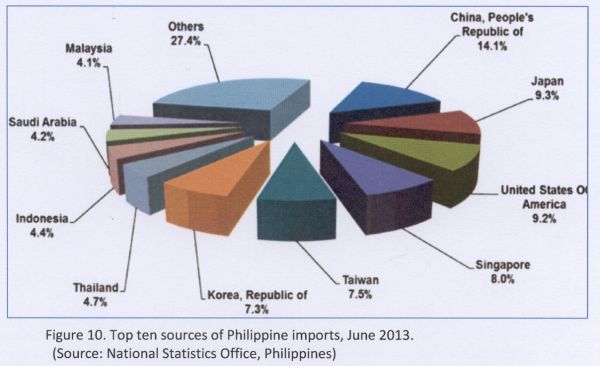
In terms of imports, Electronic Products still top the list (as of June 2013), followed by Mineral Fuels, Lubricants, and Related Materials (Fig. 9). Its top trading partners in terms of imports are China, Japan, the United States, Singapore, and Taiwan (Fig. 10).
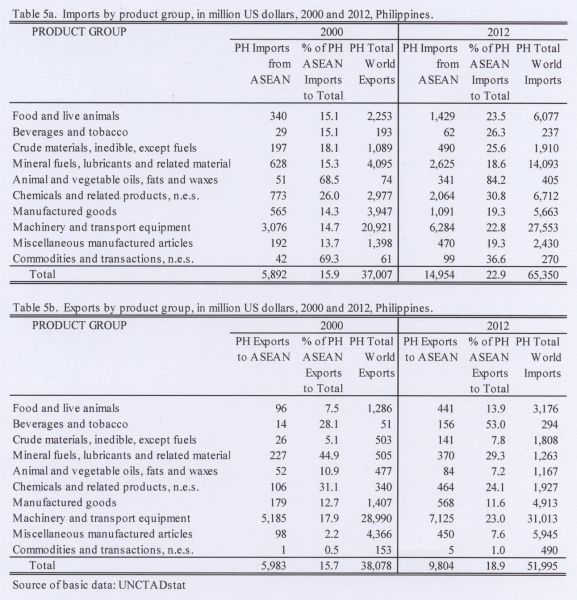
The Philippines treat ASEAN as an important economic trading bloc. In 2000, around 16% of its total imports and 16% of its total exports were with the ASEAN nations, rising to 23% and 19%, respectively by 2012 (Tables 5 and 5b). Among the major product groups, the products mostly traded by the Philippines with ASEAN include imports of Machinery and Transport Equipment and Mineral fuels, lubricants and related materials; and exports of Machinery and transport equipment.
In terms of agricultural products, the top exports (and top two major markets) of the Philippines are coconut oil (USA and Netherlands), fresh banana (Japan and China), tuna (USA and Germany), and pineapple and products (USA and Japan). Top agricultural imports (and top two major sources) are wheat and meslin (USA and Australia), soybean oil/cake meal (USA and Argentina), milk/cream and products (New Zealand and USA), and rice (Vietnam and India) [Source: Bureau of Agricultural Statistics].
With the AEC 2015, the Philippines hopes to further boost trade with its current trading partners, especially with ASEAN member states, for it to reap the benefits of a free-trade scenario. It has also been keen in further advancing cooperation not only within ASEAN, but with its extra-ASEAN partners as well.
CONCLUSION
The ASEAN countries have traditionally engaged in extensive intra- and extra-regional trade in agricultural products. With the AEC, trade can be further facilitated under the first pillar, particularly the core element on Free Flows of Goods. As mentioned earlier, tariffs reduction in the region has been steady even under previous ASEAN wide agreements and FTAs with non-ASEAN countries and regions. However, the dismantling of nontariff barriers remains an issue. The recent evidence shows however that intra-regional trade in agricultural products has been growing as a proportion, suggesting some progress (Figure 3). How the elimination of non-tariff measures as envisioned in the AEC could affect intra- and extra-ASEAN trade flows in agricultural, however, remains to be seen. As emphasized, the quantification of the NTB effects of NTMs is not always straightforward. A cursory review of NTMs shows the country positions invoking mostly health reasons, SPS requirements, and food safety. Furthermore, enhanced regional cooperation on trade-related harmonization of production systems through the GAP, GAHP, GHP, GMP and HACCP would address the potential NTB effects of SPS.
How greater technology transfer through the AEC can boost agricultural production and trade in the region is also worth looking into. As previously mentioned, modern agricultural farms make use of the latest technology and know-how in their production and processing systems. While ASEAN can aggressively pursue collaborative researches and technology transfer among its member-countries, the region can stand to benefit from pursuing a wider range of global networks in agricultural science and technology. The AEC can invite cooperation in R&D, technology transfer, and capacity building from countries with advanced know-how in to benefit the member-states.
Still another viable area is on facilitating regional investments in agricultural industries. Freer flow of capital and investments as envisioned in AEC should make the private sector exploit the opportunities presented by the perennial inadequacy of domestic supply to meet overall demand in many agricultural products. The benefits of expanding production and taking advantage of potential economies of scale would help attract new investments which the AEC can facilitate.
The AEC also envisions greater market access through the strengthening of ASEAN agricultural cooperatives. It would then be useful to understand the role of cooperatives especially in processing and marketing agricultural produce owing to their perishable nature. Cooperatives can establish their own facilities in order to preserve quality for marketing purposes. The need for an assured market can be met by agricultural cooperatives by facilitating supply contracts that oftentimes require strict volume and quality requirements. However, how the AEC can enhance bilateral, regional and multilateral linkages among agricultural cooperatives remains to be seen.
Trade in services which are allied with modern agricultural sectors is also a viable area for cooperation in the AEC. Information and transport services are important ancillaries to modernizing agricultural farms, and a freer flow of these services can promote efficiency and competitiveness. Furthermore, agricultural trade in the region stands to benefit from better trade facilitation which the AEC also highlights.
Finally, the issue of food and nutrition security has been top on the policy agenda of most economies. While some countries remain entirely dependent on agricultural imports, others are partially self-sufficient. Regional cooperation on ensuring food security can use the AEC platform for furthering this regional agenda.
REFERENCES
ASEAN Economic Blueprint 2015. http://www.asean.org/archive/5187-10.pdf
Association of Southeast Asian Nations (ASEAN) website. http://www.asean.org/
Bureau of Agricultural Statistic (Philippines). http://www.countrystat.bas.gov.ph
Daite, R.B., P.J.B. Ramirez, and S. Staal. 2013. “Dairy trade and regional integration in the Southeast Asian Region.” An Issues Paper prepared for the World Milk Day Celebration, June 1, 2013, Bangkok, Thailand.
Economic Research Institute for ASEAN and East Asia (ERIA). 2012. Mid-Term Review of the Implementation of AEC Blueprint: Executive Summary
International Monetary Fund online database. http://www.imf.org
National Statistics Office (Philippines). http://www.census.gov.ph
UNCTADStat Handbook of Statistics 2012. http://unctadstat.unctad.org/
World Bank. World Development Indicators, accessed 31 July 2013. http://data.worldbank.org/data-catalog/world-development-indicators
World Trade Organization (WTO) Tariff Profiles and Online Database. http://www.wto.org.
|
Submitted as a country paper for the FFTC-NACF International Seminar on Threats and Opportunities of the Free Trade Agreements in the Asian Region, Sept. 29 - Oct. 3, 2013, Seoul, Korea |
[1] This section is lifted heavily from Daite et al. 2013.
[3] The Common Effective Preferential Tariff (CEPT) is an effective tariff applied to goods originating from ASEAN, agreed upon among and between all ASEAN Member states. This was covered by the Agreement on Common Effective Preferential Tariff (CEPT) Scheme for the ASEAN Free Trade Area (AFTA) signed by authorized ASEAN Ministers in Singapore in January 1992.
[4] Conceptually, NTBs are those that restrict trade without the use of tariffs. They include import quotas and other less-defined barriers such as licensing requirements, restrictive product standards, and anti-dumping protection. For its purpose, ASEAN has identified the following measures as major NTBs affecting intra-regional trade: customs surcharges, technical measures and product characteristic requirements, and monopolistic measures.

The ASEAN Economic Community 2015 and Regional Trade: Some Prospects for Agriculture
Richard B. Daite
Department of Economics
University of the Philippines Los Baños
email: rbdaite@gmail.com
ABSTRACT
The establishment of the ASEAN Economic Community 2015 is seen as a bold effort to promote regional cooperation among the ASEAN member states. It covers not only the usual trade policy prescriptions of lowering tariffs and other trade barriers, but other policy measures to create a single market for unhampered flow of goods, services, investments, labor and capital. With the ASEAN countries’ extensive intra- and extra-regional trade in agricultural products, the AEC can help further facilitate trade under its first pillar of economic integration. There also remains greater prospects for cooperation on technology transfer, facilitating regional investments in agricultural industries, strengthening agricultural cooperatives, trade in services allied with modern agricultural sectors, and food and nutrition security.
Key words: ASEAN, trade, agriculture, ASEAN Economic Community, regional integration
INTRODUCTION
The Southeast Asian region is fast progressing towards the full establishment of the ASEAN Economic Community (AEC), with country commitments already made to fully implement the AEC by 2015. These commitments include reducing tariffs and other barriers to trade, but the AEC envisions multiple policy responses that go beyond the usual trade policy instruments. How the foreseen regional integration affects sectors of the economies, specifically in agriculture, would be informative. With growing food security concerns in the region, international trade in agricultural products and cross-country cooperation to raise productivity remain among top national issues in the region.
This paper aims to provide an overview of trends in economy and trade in Southeast Asia, with focus on changes in trade patterns and the underlying factors driving those. It then reviews the major features of the AEC in 2015, and the possible elements that are likely to change in that context. Prospects for agriculture and allied sectors are offered, and further questions are raised on the possible implications of the AEC on the ASEAN Region.
A Brief Overview of the ASEAN Region
The 10-member ASEAN, encompassing 600 million people, is characterized by economies with varying economic profiles. The combined GDP of ASEAN reached US$ 2.3 trillion (in current prices) in 2012, with Indonesia being the largest economy in the region (Table 1). Over the last five years, the region’s real GDP growth posted quite impressive figures, even in the aftermath of the Asian Financial Crisis of 2007. In terms of contribution of agriculture to the national economy, transition economies in ASEAN still rely on agriculture as a main economic driver. Agricultural gross value added in Cambodia, Lao PDR, and Myanmar account for more than 30% of their respective GDP. Singapore and Brunei have the smallest agriculture sector, while Vietnam, Indonesia, the Philippines and Thailand have about 10-20% of their economies contributed by agriculture.
The region also shows indications of openness to trade. Total trade (exports plus imports) of Singapore, a world trading hub, accounted for around 380% of GDP. Brunei, Cambodia, Malaysia, Thailand, and Vietnam have total trade exceeding 100% of GDP.
Still a good portion of international trade by ASEAN economies is intra-regional in nature. In 2011, destinations and origins of Southeast Asian exports and imports are mainly to and from the region itself (Figure 1). Other important trading partners are China, the European Union-27, and the United States.
ASEAN trade are mostly in manufactures, with imports and exports of this product group growing substantially from 2000 to 2012 (Figure 2). Trade in fuels and mining products also saw a significant increase, while agricultural products continue to be key imports and exports in ASEAN.
Figure 3 below shows the flow of agricultural trade to and from the region with important economic partners. The ASEAN region itself remains a key export destination, where about a fifth of total agricultural exports of the region have gone from 2000 to 2012. The shares of agricultural exports to traditional partners such as Japan, North America, and EU-27 have gone down, while that of China has grown considerably for the same period. In terms of imports, intra-ASEAN trade remains significant.
Tables 2a and 2b show the changes in country structure by product group from 1995 to 2011. In terms of exports, the percentage share of food and agricultural exports have gone down in countries such as Cambodia, Lao PDR, and Myanmar, favoring higher export shares for manufactured goods or ores, metals and precious stones. Trade in manufactures goods have dominated the trade patterns of most of the ASEAN countries, especially in imports of these goods.
ASEAN trade in services have grown rapidly through the years. From about US$ 24 billion in trade (imports plus exports) of services, the value stood at US$ 518 billion in 2011 (Figure 4). Commercial services exports of ASEAN are mostly on computer, information, communications and others (Figure 5). Travel services constitute about a third of commercial service exports. From 2005 to 2011, the total value of commercial service exports grew from US$ 112 billion to US$ 245 billion, representing 4% and 6% of world total in the respective years.
The SEA region saw net inflows of foreign direct investments in the past 30 years (Table 3). In 2011, net inflows of FDIs for the ASEAN stood at US$ 57 billion, most of this accounted for by Singapore and Indonesia. Other major destinations of FDIs in 2011 were Malaysia, Thailand and Vietnam.
The above profile shows the continued importance of trade and investments in the region, and the changing patterns in individual countries. Strengthening regional integration in ASEAN as envisioned by AEC could help further boost trade and investments, benefiting the different sectors of country-members.
ASEAN ECONOMIC COMMUNITY (AEC) BLUEPRINT: OVERVIEW AND KEY ACCOMPLISHMENTS[1]
As early as 2003, definitive steps were already undertaken to lay the groundwork for the institution of the AEC. In the 9th Summit of the Association of Southeast Asian Nations (ASEAN) in Bali, Indonesia (2003), the heads of ASEAN member-states passed the Declaration of ASEAN Concord II (or the Bali Concord II) which pronounced the establishment of an ASEAN Community by the year 2020. The vision was to promote greater political, security, and economic cooperation in the region. One of the three overarching frameworks in this accord is the ASEAN Economic Community (AEC)[2] which envisions economic integration in the region through the freer flow of goods, services, investments, capital and skilled labor. Subsequently, in the 12th ASEAN Summit in Cebu, the Philippines in January of 2007, the ASEAN Leaders agreed to accelerate the establishment of the ASEAN Community to 2015, which included the AEC. In the following Summit in Singapore in November 2007, the Leaders signed and adopted the AEC Blueprint which serves as the detailed master plan in establishing the AEC by 2015. The AEC Blueprint “will transform ASEAN into a single market and production base, a highly competitive economic region, a region of equitable economic development, and a region fully integrated into the global economy.” (AEC Blueprint, 2008, p. 2)
The AEC’s goal of regional economic integration rests on four pillars: 1) single market and production base; 2) competitive economic region; 3) equitable economic development; and 4) integration into the global economy. Under each pillar are core elements which require specific actions and strategic approaches to realize the intended outcomes (see Box 1). Implementation follows a clear schedule done in four phases: 2008-2009, 2010-2011, 2012-2013, and 2014- 2015. The Blueprint also spells out an implementation mechanism that identifies responsibility centers and provides for regular monitoring and evaluation. In fact, ASEAN came up with the AEC Scorecard which is a monitoring mechanism to track the progress of implementing the AEC measures. The latest scorecard (as of 2012) reports the accomplishment of the AEC implementation in the first two phases, from 2008 to 2011. Further, a report on the mid-term review of the implementation of the AEC Blueprint was completed in October 2012 based on the AEC Scorecards and other review mechanisms undertaken.
The mid-term review (MTR) reported substantial accomplishments in implementing the Blueprint. The most noteworthy is the reduction and elimination of tariffs in the region, with the CEPT[3] rates practically zero in the ASEAN 6 (Brunei, Indonesia, Malaysia, Philippines, Singapore, Thailand) and an average of only 2.6% for the CLMV countries (Cambodia, Lao PDR, Myanmar, Vietnam) in 2010 (MTR, 2012). There was also an important headway on trade facilitation, with five (5) ASEAN Member States (AMSs)-- Indonesia, Malaysia, Philippines, Singapore and Thailand--having live implementation of National Single Windows (NSW) and two (Brunei and Vietnam) are well on their way to full NSW development. Other key accomplishments were on investment liberalization, the Roadmap for Integration of Air Travel Sector (RIATS), the signing of the five ASEAN+1 FTAs that cover all of the ASEAN+6 partners, the signing of the Chiang Mai Initiative, and various regional cooperation initiatives in many areas (such as agriculture, competition policy and IPR).
There are, however, implementation areas that need further marked improvement. The issues on Non-Tariff Measures (NTMs) need to be further addressed, especially on the non-tariff barrier (NTB)[4] effects of NTMs that continue to be imposed for legitimate reasons. The determination of NTB effects is difficult, and data on NTBs are hard to obtain, thus the restrictiveness of NTMs that are continually in place cannot be ascertained. In terms of trade facilitation, full implementation of the ASEAN Single Window rests on well-functioning National Single Windows in all AMSs, which are difficult to come by due to the varying levels of customs performance among the individual AMSs in the region. In terms of liberalizing investment, liberalization in the agricultural sector and the oil/gas sector remains tricky due to political economy concerns in a number of AMSs (MTR, 2012).
Box 1. Pillars and core elements of the ASEAN Economic Community Blueprint
Pillars
Core Elements
Key Strategic Areas of Action
A. Single Market and Production Base
A1. Free Flows of Goods
- Tariffs Reduction / Elimination
- Elimination of Non- Tariff Barriers
- Rules of Origin
- Trade Facilitation
- Customs Integration (Customs Development, ASEAN Single Window, Standards and Conformance)
A2. Free Flows of Services
- Services Liberalisation under ASEAN Framework Agreement on Services (AFAS)
- Mutual Recognition Arrangements (MRAs)
- Financial Services Sector
A3. Free Flows of Investment
- ASEAN Investment Agreement (AIA)
- Liberalization / Facilitation / Promotion / Protection
A4. Freer Flows of Capital
- ASEAN Capital Market Development and Integration
- Capital mobility
- Foreign Direct Investment / Portfolio Investment
- Current Account Transactions
- Facilitation
A5. Free Flows of Skilled Labor
- Mutual Recognition Arrangements (MRAs)
- Core competency development
A6. Priority Integration Sectors
- M&E of Priority Integration Sector (PIS) roadmaps
- Sector-specific projects or initiatives
A7. Food, Agriculture and Forestry
- Harmonization and application of quality standards for food safety
- Cooperation and technology transfer with international organizations and private sector
- Market access through ASEAN agricultural cooperatives
B. Highly Competitive Economic Region
B1. Competition Policy
- Capacity building and adoption of best practices
B2. Consumer Protection
- Establishment of the ASEAN Coordinating Committee on Consumer Protection (ACCCP)
B3. Intellectual Property Rights
- Intellectual Property Rights Action Plan
B4. Infrastructure Development
- Transport Action Plan
- ASEAN Framework Agreement on Multimodal Transport
- ASEAN Framework Agreement on the Facilitation of Goods in Transit (AFAFGIT)
- ASEAN Framework Agreement on the Facilitation of Inter- State Transport (FAIST)
- Roadmaps for Integration of Air Travel Sector (RIATS)
- Roadmap towards an Integrated and Competitive Maritime Transport in ASEAN
- ASEAN Power Grid
- Trans-ASEAN Gas Pipeline
B5. Taxation
- Bilateral agreements on avoidance of double taxation
B6. E-Commerce
- E-commerce laws / capacity building
C. Equitable Economic Development
C1. SME Development
- ASEAN Policy Blueprint for SME Development
C2. Initiatives for ASEAN Integration (IAI)
- M&E / Capacity building
D. Full Integration into the Global Economy
D1. Coherent approach towards external economic relations
- “ASEAN Centrality” in negotiations for free trade (FTAs) and comprehensive economic partnership (CEPs) agreements.
D2. Enhanced participation in global supply networks
- International best practices and standards in production and distribution
IMPLICATIONS ON AGRICULTURAL TRADE IN THE REGION
Under the Single Market and Production Base pillar of the AEC, food, agriculture and forestry are considered priority sectors. In fact, the AEC renews calls for the further lowering and removal of tariffs to boost intra- and extra-ASEAN agricultural trade and the adoption and harmonization of quality management systems for food safety. But even prior to the AEC, tariff elimination in many product lines has been steady, including in the agriculture sector. As of the latest figures, the applied Most Favoured Nation (MFN) tariff rates of ASEAN countries ranged from 0% to 11% in all products, with tariffs for agricultural products averaging from 0.1% to 22% (Table 4).
Intra-ASEAN Commitments via the CEPT-AFTA scheme and the ASEAN Trade in Goods Agreement (ATIGA) are even lower. Under the ATIGA, import duties on all products traded within ASEAN shall be eliminated by 2010 in the ASEAN 6 and by 2018 in the CLMV countries. Exceptions are given for products in the negative list under the Priority Integration Sectors, and for unprocessed agricultural products under Schedule E.
ASEAN as a group has also forged free trade agreements (FTAs) with other non-ASEAN countries in the Asia-Pacific Region. Specifically, ASEAN has existing individual FTAs with China, Japan, South Korea, India, and Australia and New Zealand which all called for freer trade with these countries mainly through tariffs reduction and trade facilitation. In terms of agricultural trade, the lowering of tariffs with these partners bodes well for the region which is a net importer of some agricultural product lines. The further expansion of FTAs to other regional and economic blocs that serve as ASEAN’s important trading partners in agricultural products, such as Europe and North America, can help further boost the flow of these goods in the region.
Given the steady decline in tariffs on agricultural products in the region, perhaps a more important trade issue is the imposition of non-tariff measures. While the AEC Blueprint MTR recognizes the efforts to eliminate NTBs and reduce the NTB effects of NTMs, the quantification of these effects are difficult. The MTR noted four major groups of NTMs that are of interest: 1) technical barriers to trade; 2) sanitary and phyto-sanitary standards (SPS); 3) customs related measures; and 4) the so-called “core NTMs”. Core NTMs as defined in the MTR are those pertaining to non-automatic licensing; quantitative restrictions; prohibitions; enterprise-specific; single channel for imports; and foreign exchange market restrictions. In terms of agricultural trade in the region, most of these NTMs were on technical regulations (labeling; quality standards; SPS; testing , inspection and quarantine measures;) and import licensing (import permit, certificate of approval) chiefly for SPS, health, and food safety reasons. How these NTMs serve as significant barriers to trade have yet to be quantified, even though varying legitimate reasons are cited by imposing countries (such as for religious and cultural purposes, health reasons, and public safety concerns).
On another related issue, the MTR reports notable progress in standardizing practices quality systems such as adoption of Good Agriculture Practices (GAPs), Good Aquaculture Practices (GAqPs), Good Animal Husbandry Practices (GAHPs), Good Hygiene Practices (GHPs), Good Manufacturing Practices (GMPs), and Hazard Analysis Critical Control Point (HACCP)-based systems. The harmonization of agricultural products would help ensure the free flow of safe and qualified products and raise competitiveness in international markets. But in addition, regional cooperation on these systems may also have an effect on addressing SPS-related issues embodied in the NTMs. Technical regulations from SPS and foods safety-related NTMs can be better hurdled through the continued improvement in standards and certifications of good quality. As mentioned earlier, NTMs related to agricultural products in the ASEAN region are dominated by technical regulations and import licenses chiefly for SPS, health, and food safety reasons.
Still a priority initiative of the AEC Blueprint is the enhancement of its third pillar (equitable economic development). Under this is the recognition of the strategic importance of small- and medium-sized enterprises (SME) for equitable growth in the region. The Blueprint has proposed measures for continued SME development in the region through facilitating access to finance, information, markets, and technology. The smallhold and medium-sized agricultural industries in the region may stand to gain from the AEC’s quest for SME development in the Region, as well as the promotion of ASEAN agricultural cooperatives to enhance market access of agricultural products.
Regional cooperation in services may not be as less progressive compared to other sectors such as in goods and investments. Given the priority given by AEC, this suggests huge potentials for growth and cooperation in the services sectors, which currently dominate the economic profile of many countries in the region.
The AEC efforts in liberalizing investments and facilitation of trade may augur well for the agricultural industry. The continued quest for modernizing agricultural enterprises comes with the requirement of more capital, better input use and technology packages. Furthermore, adequate support systems should also be in place to ensure their development. For example, poor roads and logistics often hamper the efficient functioning of agricultural markets in the region. In this light, the free flow of investments and capital in the region can help ASEAN countries prop up their agricultural industries. Also, as emphasized above, modernizing agricultural industries requires adequate facilities, highly-trained personnel, advanced technology, and efficient transportation systems, especially with the high perishability characteristic of food and agriculture products. Thus, the AEC Blueprint’s focus on improved logistics and transport systems, better trade facilitation, and free movement of skilled labor would be welcome developments for the ASEAN agricultural industry in this regard.
THE CASE OF THE PHILIPPINES
The Philippines is one of the pioneer ASEAN Member States. It is traditionally a net importer of internationally-trade products, with a trade balance deficit reaching US$ 13 Billion in 2012 (Figure 6). Its top exports are electronic products, accounting for 39% of export revenues in the month of July 2013 (Fig. 7), which are mostly shipments of semiconductor components and devices. The country’s major export destinations are Japan, China, The United States, Hong Kong and Singapore (Fig. 8).
In terms of imports, Electronic Products still top the list (as of June 2013), followed by Mineral Fuels, Lubricants, and Related Materials (Fig. 9). Its top trading partners in terms of imports are China, Japan, the United States, Singapore, and Taiwan (Fig. 10).
The Philippines treat ASEAN as an important economic trading bloc. In 2000, around 16% of its total imports and 16% of its total exports were with the ASEAN nations, rising to 23% and 19%, respectively by 2012 (Tables 5 and 5b). Among the major product groups, the products mostly traded by the Philippines with ASEAN include imports of Machinery and Transport Equipment and Mineral fuels, lubricants and related materials; and exports of Machinery and transport equipment.
In terms of agricultural products, the top exports (and top two major markets) of the Philippines are coconut oil (USA and Netherlands), fresh banana (Japan and China), tuna (USA and Germany), and pineapple and products (USA and Japan). Top agricultural imports (and top two major sources) are wheat and meslin (USA and Australia), soybean oil/cake meal (USA and Argentina), milk/cream and products (New Zealand and USA), and rice (Vietnam and India) [Source: Bureau of Agricultural Statistics].
With the AEC 2015, the Philippines hopes to further boost trade with its current trading partners, especially with ASEAN member states, for it to reap the benefits of a free-trade scenario. It has also been keen in further advancing cooperation not only within ASEAN, but with its extra-ASEAN partners as well.
CONCLUSION
The ASEAN countries have traditionally engaged in extensive intra- and extra-regional trade in agricultural products. With the AEC, trade can be further facilitated under the first pillar, particularly the core element on Free Flows of Goods. As mentioned earlier, tariffs reduction in the region has been steady even under previous ASEAN wide agreements and FTAs with non-ASEAN countries and regions. However, the dismantling of nontariff barriers remains an issue. The recent evidence shows however that intra-regional trade in agricultural products has been growing as a proportion, suggesting some progress (Figure 3). How the elimination of non-tariff measures as envisioned in the AEC could affect intra- and extra-ASEAN trade flows in agricultural, however, remains to be seen. As emphasized, the quantification of the NTB effects of NTMs is not always straightforward. A cursory review of NTMs shows the country positions invoking mostly health reasons, SPS requirements, and food safety. Furthermore, enhanced regional cooperation on trade-related harmonization of production systems through the GAP, GAHP, GHP, GMP and HACCP would address the potential NTB effects of SPS.
How greater technology transfer through the AEC can boost agricultural production and trade in the region is also worth looking into. As previously mentioned, modern agricultural farms make use of the latest technology and know-how in their production and processing systems. While ASEAN can aggressively pursue collaborative researches and technology transfer among its member-countries, the region can stand to benefit from pursuing a wider range of global networks in agricultural science and technology. The AEC can invite cooperation in R&D, technology transfer, and capacity building from countries with advanced know-how in to benefit the member-states.
Still another viable area is on facilitating regional investments in agricultural industries. Freer flow of capital and investments as envisioned in AEC should make the private sector exploit the opportunities presented by the perennial inadequacy of domestic supply to meet overall demand in many agricultural products. The benefits of expanding production and taking advantage of potential economies of scale would help attract new investments which the AEC can facilitate.
The AEC also envisions greater market access through the strengthening of ASEAN agricultural cooperatives. It would then be useful to understand the role of cooperatives especially in processing and marketing agricultural produce owing to their perishable nature. Cooperatives can establish their own facilities in order to preserve quality for marketing purposes. The need for an assured market can be met by agricultural cooperatives by facilitating supply contracts that oftentimes require strict volume and quality requirements. However, how the AEC can enhance bilateral, regional and multilateral linkages among agricultural cooperatives remains to be seen.
Trade in services which are allied with modern agricultural sectors is also a viable area for cooperation in the AEC. Information and transport services are important ancillaries to modernizing agricultural farms, and a freer flow of these services can promote efficiency and competitiveness. Furthermore, agricultural trade in the region stands to benefit from better trade facilitation which the AEC also highlights.
Finally, the issue of food and nutrition security has been top on the policy agenda of most economies. While some countries remain entirely dependent on agricultural imports, others are partially self-sufficient. Regional cooperation on ensuring food security can use the AEC platform for furthering this regional agenda.
REFERENCES
ASEAN Economic Blueprint 2015. http://www.asean.org/archive/5187-10.pdf
Association of Southeast Asian Nations (ASEAN) website. http://www.asean.org/
Bureau of Agricultural Statistic (Philippines). http://www.countrystat.bas.gov.ph
Daite, R.B., P.J.B. Ramirez, and S. Staal. 2013. “Dairy trade and regional integration in the Southeast Asian Region.” An Issues Paper prepared for the World Milk Day Celebration, June 1, 2013, Bangkok, Thailand.
Economic Research Institute for ASEAN and East Asia (ERIA). 2012. Mid-Term Review of the Implementation of AEC Blueprint: Executive Summary
International Monetary Fund online database. http://www.imf.org
National Statistics Office (Philippines). http://www.census.gov.ph
UNCTADStat Handbook of Statistics 2012. http://unctadstat.unctad.org/
World Bank. World Development Indicators, accessed 31 July 2013. http://data.worldbank.org/data-catalog/world-development-indicators
World Trade Organization (WTO) Tariff Profiles and Online Database. http://www.wto.org.
[1] This section is lifted heavily from Daite et al. 2013.
[2] The others are the ASEAN Security Community (ASC) and the ASEAN Socio-Cultural Community (ASCC). For further details, visit www.asean.org/news/item/declaration-of-asean-concord-ii-bali-concord-ii.
[3] The Common Effective Preferential Tariff (CEPT) is an effective tariff applied to goods originating from ASEAN, agreed upon among and between all ASEAN Member states. This was covered by the Agreement on Common Effective Preferential Tariff (CEPT) Scheme for the ASEAN Free Trade Area (AFTA) signed by authorized ASEAN Ministers in Singapore in January 1992.
[4] Conceptually, NTBs are those that restrict trade without the use of tariffs. They include import quotas and other less-defined barriers such as licensing requirements, restrictive product standards, and anti-dumping protection. For its purpose, ASEAN has identified the following measures as major NTBs affecting intra-regional trade: customs surcharges, technical measures and product characteristic requirements, and monopolistic measures.