ABSTRACT
The livestock industry plays an important role in the Malaysian economy as the Compound Annual Growth Rates (CAGR) for both gross output and value added were recorded at 15.1% and 17.2%, respectively during 2010-2015 period with the largest contribution of the output stemming from the poultry industry. Despite having achieved full and even more than 100% of self-sufficiency level (SSL) for poultry meat and pork, Malaysia’s livestock sub-sector is struggling with ruminant industry as a large gap between local supply and demand continues to prolong due to a relatively low self-sufficiency level and thus, is highly dependent on imports. In 2017, the SSL for beef was recorded at 23.4% while lamb and mutton indicated a lower SSL rate of 11.4 %. As shortage in supply remains the major issue, the government has decided to liberalize import quotas for beef and lamb/mutton beginning in 2016. One of the major rationales of this policy changes is to address the inadequacy of local supply which affects consumer prices as well as food security through increasing consumer welfare. In this paper, secondary data on global and local meat industry and liberalization policy were compiled and analyzed using basic descriptive analysis. Furthermore, the primary data on the impact of import quota liberalization were also qualitatively analyzed. This study revealed that most of the meat importers in Malaysia agreed on the implementation of import quota liberalization. The import quota liberalization opens new opportunity for importers to explore a new source of beef and lamb/mutton and provide benefits through a better supply of produce with lower price.
Keywords: livestock, meat industry, import quota liberalization, importers, impact
INTRODUCTION
Meat is one of very important industries in Malaysia as it supplies source of protein for people, and raw materials for processing food industries. For many years, beef and lamb/mutton indicated an increasing consumption trend, while stagnant in the domestic production. In fact, the domestic productions of those products are declining in recent years, thus, affected the supply in the market. Further, it negatively affected market equilibrium while punishing consumers with incredibly higher market prices. To overcome this, Malaysia has moved towards a liberalization import policy since 2016, thus, opening its import quotas for several agricultural commodities, including meat and meat-based products.
Livestock is one of the major concerns due to not only having a relatively lower self-sufficient rate (SSR), but it also promotes value-added products in both domestic and export markets, hence contributing to the national economic growth. This article aims to give an in-depth understanding of the meat industry at both global and national levels. Furthermore, it can also explain the import quota liberalization in Malaysia, and also presents the impact of this policy implementation to the industry. As Malaysia is highly relying on imported meat products from several major livestock producers to meet the shortfall in domestic production, a market diversification of imported livestock could also be a policy strategy to protect both industry players and consumers.
WORLD SCENARIO OF MEAT INDUSTRY
World production trend
Globally, livestock production contributes around 40% of the total value of agricultural production. The increase in livestock production is due to the increasing trend in world population, income, changing lifestyle and nutrition intake (FAO, 2018). The increase in the world livestock production is contributed mainly by increasing in farm productivity and economies of scale. Meat consumption has also increased in line with dietary changes by people who are no longer dependent on staple foods, such as rice, bread and cereals. On average, meat consumption in developed countries is double as high as the world consumption. These changes are also due to increasing population, increasing income and increasing urbanization and demand for meat and meat products in developing countries.
Some developed countries have achieved high levels of productivity in livestock and have a comparative advantage in the global meat trade (Ucak, 2007). Developing countries are also working to change the level of livestock production. However, productivity levels in developing countries are still low compared to developed countries. In the 1960s, Europe and North America were the major producers of meat in the world, which contributed to around 42% and 25% of the production, respectively. However, after almost 50 years, in 2013, the Asian region accounted for 45% of the world's total meat production (Ritchie and Roser, 2018).
Generally, meat is divided into two types: white and red. White meat consists of poultry and fish. Whereas red meat comes from livestock such as cattle, buffaloes, pigs, goats and sheep. Although the trend for meat production is increasing, there are different trends for each type of meats. For example, in 1961 poultry production accounted for 12% of the world meat production and tripled by 35% in 2013. During the same period, the world production of beef, lamb and mutton shows decreasing trends to 28% in 2013 compared with 50% in 1961. However, the global pork production is constant at 35-40% throughout the year (Ritchie and Roser, 2018).
In this study, data related to trends for production, consumption, trade and market prices were collected from the FAO, based on the HS Code in (Table 1).
Table 1. HS code used in this study
|
Beef and lamb/mutton product
|
HS code
|
|
Meat of bovine animals, fresh or chilled
|
0201
|
|
Meat of bovine animals, frozen
|
0202
|
|
Meat of sheep or goats, fresh, chilled or frozen
|
0204
|
Source: Global Trade Information System (GTIS, 2018)
The production of beef (meat of bovine animals) and lamb/mutton in the world shows an increase to 68 million MT in 2016, from 28 million MT in 2014.
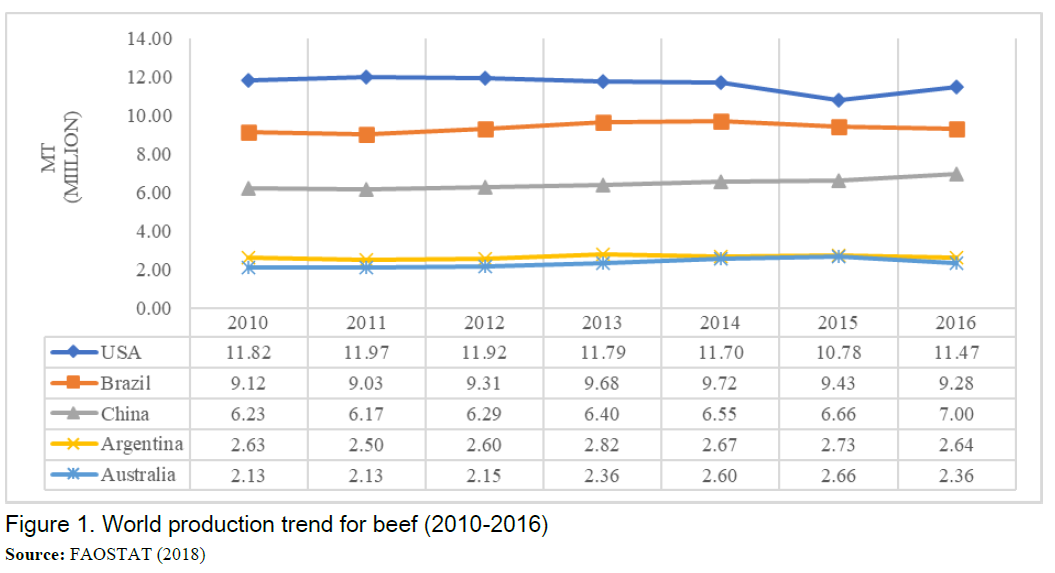
According to Figure 1, the United States of America is the largest producer of beef with production of 10 - 11 million MT during 2010 - 2016. The other major producers are Brazil and China with annual production of nine million MT and six million MT. This is followed by Argentina and Australia that producing 2 - 3 million MT a year. During these seven years (2010-2016), the production trends for these five countries showed constant figures with no significant changes recorded.
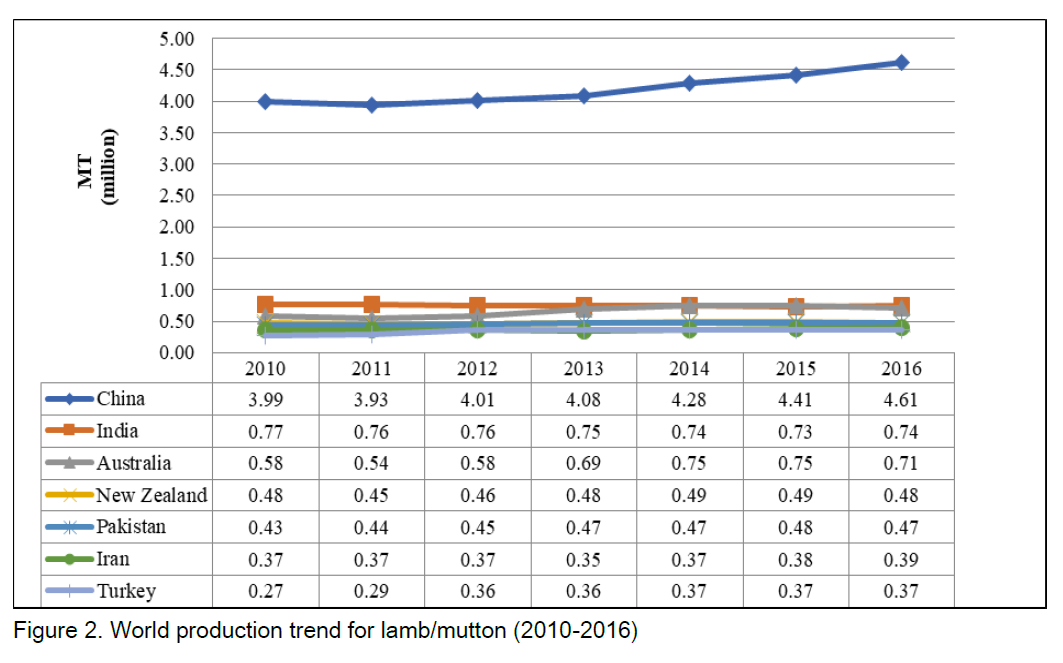
Figure 2 shows the major producing countries of lamb/mutton. In 2010 - 2016, China dominated the lamb/mutton production with a total production of 3-4 million MT a year, followed by India with a total production of 0.7 million MT a year. There was an increase in total production for Australia by 0.13 million MT from 0.58 million MT (2010) to 0.71 million MT (2016). For New Zealand and Pakistan, each country has an average annual production of 0.48 million MT and 0.46 million MT. Western Asian countries such as Iran and Turkey are also the world's largest producers of lamb/mutton with an average annual production of 0.37 million MT and 0.34 million MT, respectively.
World Trade Trend
According to the FAO, the world meat trade has risen to US$ 52 billion in 2017. This trend is expected to continue due to the liberalization of international trade by the World Trade Organization (WTO). Since 1985, the increase in the value of world meat trade has been attributed to trade openness policies mainly practiced by Japan and South Korea as well as trade agreements by North American countries (NAFTA). The opening of new farms such as in China and Russia has also played a role in increasing meat trade worldwide. In addition, the increasing income of the developing countries is also the contributing factor to the increasing value of world meat trade (Ucak, 2007).
Most countries that import beef is from developed countries such as the United States of America, China, Japan and South Korea (Table 2). According to this table, Malaysia was ranked number eleven in the list of major importing countries for beef in the world. This indicated that Malaysia is very much dependent on imported beef. It is also suggested that although Malaysia’s population is smaller, the consumption is high meaning that meat is very important food to Malaysians.
Table 2. Major importing country for beef (2014-2017)
|
Country
|
2014
|
2015
|
2016
|
2017
|
Total
|
|
(‘000) MT
|
|
|
United States of America
|
1,337
|
1,529
|
1,367
|
1,358
|
5,591
|
|
China
|
417
|
663
|
812
|
974
|
2,866
|
|
Japan
|
739
|
707
|
719
|
817
|
2,982
|
|
Hong Kong
|
646
|
339
|
453
|
543
|
1,981
|
|
South Korea
|
392
|
414
|
513
|
531
|
1,850
|
|
Russia
|
932
|
621
|
522
|
509
|
2,584
|
|
European United (E.U)
|
372
|
363
|
368
|
338
|
1,441
|
|
Egypt
|
270
|
360
|
340
|
250
|
1,220
|
|
Chile
|
241
|
245
|
298
|
281
|
1,065
|
|
Canada
|
272
|
269
|
243
|
229
|
1,013
|
|
Malaysia
|
205
|
237
|
218
|
211
|
871
|
Source: United States Department of Agriculture (USDA, 2018).
While, the major exporting countries based on the total volume in four years (2014-2017) are countries that have the advantage of increasing economies of scale such as Brazil, India, Australia and New Zealand where they have large-scale livestock farms (Table 3). However, the export value of these countries shows a declining trend for four years. In the case of Brazil, for example, the decrease in export value is in line with the decline in production. The production of beef in Brazil has decreased from 9.72 million MT in 2014 to 9.28 million MT in 2016. Consequently, the export also declined from 1.909 million MT to 1.7 million MT in 2016.
Table 3. Major exporting countries for beef (2014-2017)
|
Country
|
2014
|
2015
|
2016
|
2017
|
Total
|
|
(‘000) MT
|
|
Brazil
|
1,909
|
1,705
|
1,698
|
1,856
|
7,168
|
|
India
|
2,082
|
1,806
|
1,764
|
1,849
|
7,501
|
|
Australia
|
1,851
|
1,854
|
1,480
|
1,486
|
6,671
|
|
United States of America
|
1,167
|
1,028
|
1,159
|
1,298
|
4,652
|
|
New Zealand
|
579
|
639
|
587
|
593
|
2,398
|
|
Canada
|
378
|
397
|
441
|
469
|
1,685
|
|
Uruguay
|
350
|
373
|
421
|
435
|
1,579
|
|
Paraguay
|
389
|
381
|
389
|
378
|
1,537
|
|
European United (E.U)
|
301
|
303
|
344
|
367
|
1,315
|
|
Argentina
|
197
|
186
|
216
|
293
|
892
|
|
Mexico
|
194
|
228
|
258
|
280
|
960
|
Source: United States Department of Agriculture (USDA, 2018).
Other issues affecting the world meat trade include urbanization as well as dietary changes and consumer tastes by type of meat. In addition, the abolition of tariff barriers in the international meat trade has also contributed to changes in world imports and exports. The issues of food security and climate change are also factors in the changing of world beef trade.
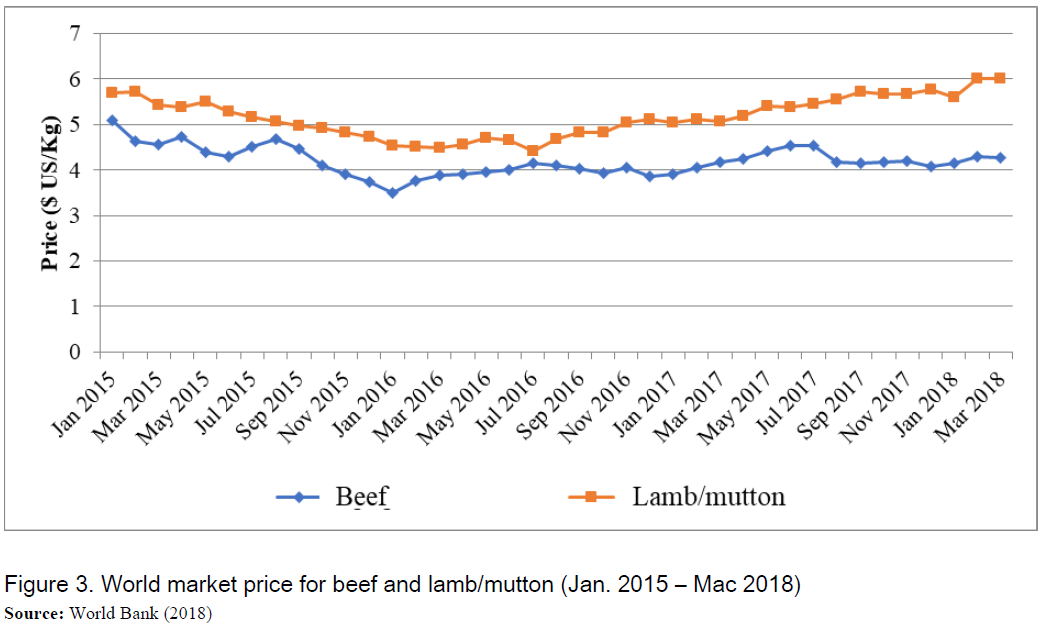
Growth in world lamb/mutton trade quantity is relatively small compared to beef trade (FAO, 2018). However, the trade value of lamb/mutton is higher than beef. This is due to the higher price of lamb/mutton (Figure 3).
According to Table 4, the main importing countries are China, United States of America, United Kingdom and Germany. Even though these countries have reached a level of self-sufficiency but still rely on imported lamb/mutton such as the United States of America and China to support the population growth. There are also Asian countries that recorded an increasing demand for lamb/mutton likes Malaysia (5th place) and Japan.
Table 4. Major importing country for lamb/mutton (2014 – 2017)
|
Country
|
2014
|
2015
|
2016
|
2017
|
Total
|
|
(‘000) MT
|
|
China
|
282.9
|
222.9
|
220.1
|
n.a
|
725.9
|
|
United States of America
|
92.9
|
103.5
|
116.5
|
138.3
|
451.2
|
|
United Kingdom
|
57.7
|
93.5
|
90.0
|
80.3
|
321.5
|
|
German
|
34.4
|
38.5
|
39.2
|
41.3
|
153.4
|
|
Malaysia
|
31.2
|
34.2
|
33.4
|
38.6
|
137.4
|
|
Italy
|
25.0
|
24.8
|
29.4
|
25.1
|
104.3
|
|
Jordan
|
24.4
|
28.0
|
24.0
|
24.5
|
100.9
|
|
Japan
|
20.7
|
18.5
|
20.0
|
22.2
|
81.4
|
|
Kuwait
|
11.4
|
13.5
|
10.2
|
13.7
|
48.8
|
Source: Comtrade (2018).
On the other hand, the list of major exporters for the period 2014 - 2017 was dominated by the Asia Pacific countries like Australia and New Zealand, followed by the United Kingdom (Table 5). The high productivity of lamb/mutton in Australia and New Zealand with lower prices has been an import factor for Asian countries, including Malaysia (Vink, 2009). Australia and New Zealand have been the source of supply of lamb/mutton for Malaysia because they offer cheaper price and convenient logistic.
Table 5. Major exporting countries for lamb/mutton (2014 – 2017)
|
Country
|
2014
|
2015
|
2016
|
2017
|
Total
|
|
(‘000) MT
|
|
Australia
|
498.5
|
458.1
|
442.1
|
454.7
|
1853.4
|
|
New Zealand
|
415.7
|
418.3
|
387.4
|
395.4
|
1616.8
|
|
United Kingdom
|
102.3
|
79.5
|
78.3
|
90.0
|
350.1
|
|
Ireland
|
39.4
|
42.5
|
48.6
|
56.1
|
186.6
|
|
Spain
|
33.5
|
31.8
|
34.8
|
37.2
|
137.3
|
|
Romania
|
3.6
|
6.8
|
5.4
|
8.2
|
24.0
|
|
German
|
6.5
|
6.5
|
6.1
|
6.9
|
26.0
|
|
Chile
|
6.2
|
5.0
|
4.9
|
5.4
|
21.5
|
|
Italy
|
2.5
|
3.0
|
2.7
|
3.9
|
12.1
|
Source: Comtrade (2018).
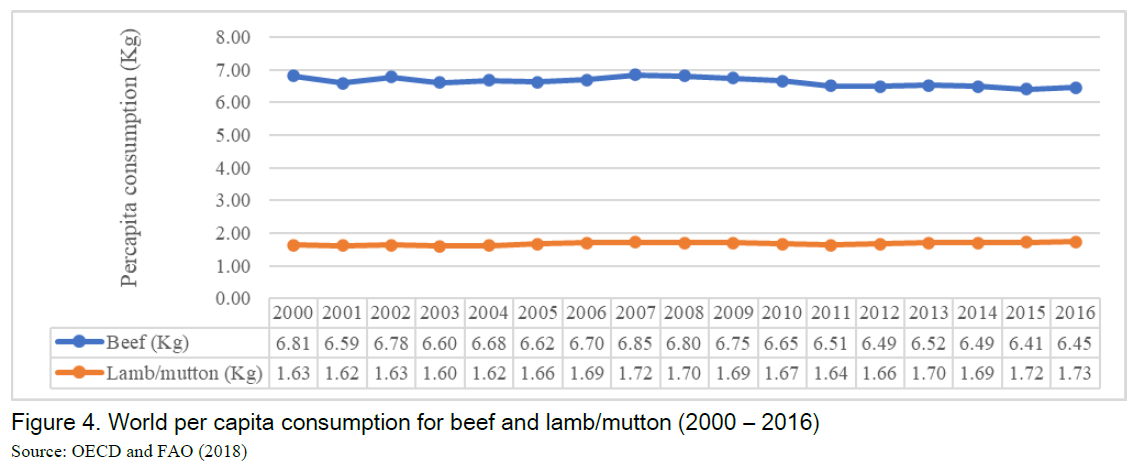
Figure 4 shows a comparison of the per-capita consumption of beef and lamb/mutton in the world. The per-capita consumption of beef is 6 - 7 kg, which is three times the per- capita consumption of lamb/mutton, which is 1-2 Kg a year. This is in line with higher lamb/mutton market prices with increasing trend of lamb/mutton ranging from US $ 5 / kg - US $ 6 / kg compared to US $ 2 / kg - US $ 3 / kg for beef (Figure 3).
SCENARIO OF MEAT INDUSTRY IN MALAYSIA
Beef industry
There has been a significant increase in the economic value of the beef industry in Malaysia, from RM0.697 billion (US$ 2.44 billion) in 2008 to RM 2.51 billion (US$ 8 billion) in 2013 due to the domestic production value and import value of livestock (Ariff et al., 2015). Figure 5 shows Malaysia has a high dependence on imported beef with a low self-sufficiency level (SSL) of 24.2% in 2007 decreasing to 23.4% in 2017. According to the study by Ariff et al., in order to increase 1% of the SSL, the industry needs to increase the number of slaughtered cattle to around 14,000 animals a year. The industry is targeted to increase the SSL to 32.7% by 2020 (MOA, 2015) which could be translated into 450,000 slaughtered cattle per annum.
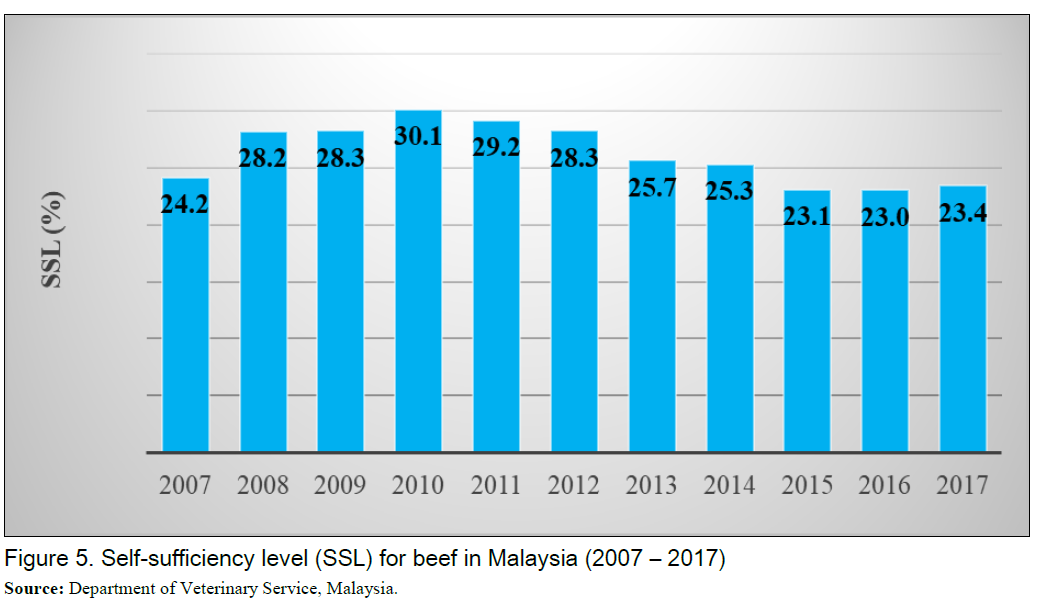
Figure 5 indicates that Malaysia has a low capability to produce beef for domestic consumption. Despite its rich flora and fauna, Malaysia still does not have the competitive advantage to produce beef. The lack of land suitable for cattle rearing is the main factor that hindered the industry to expand.
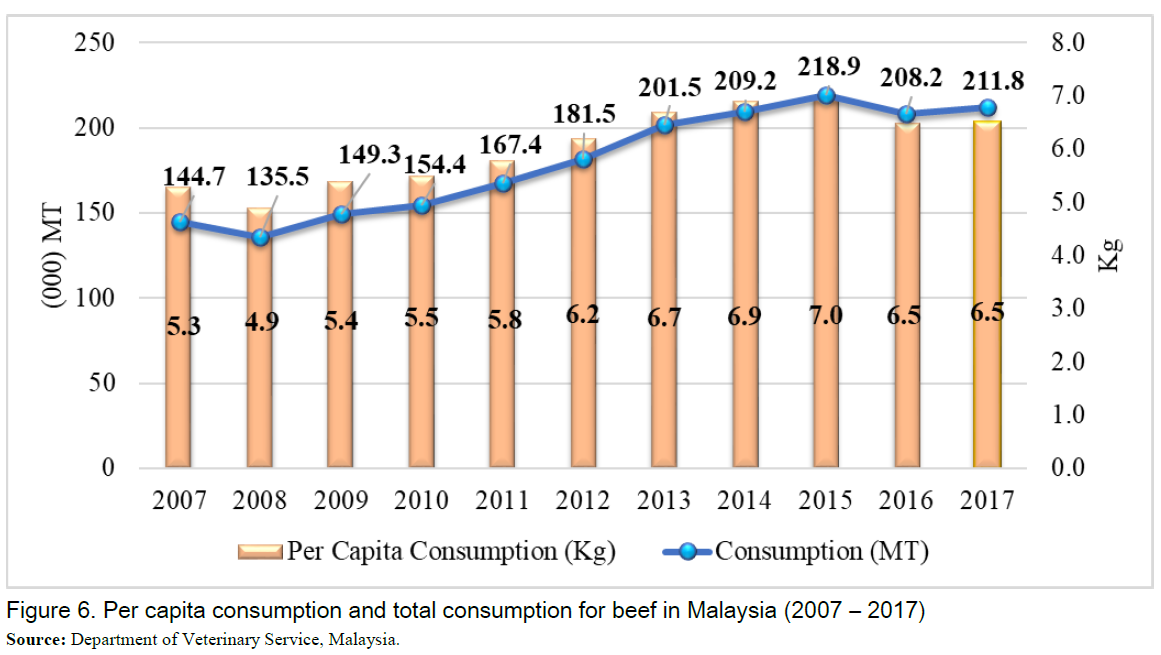
Beef is one of the main sources of protein consumed by most people in the country. Based on Figure 6, the total consumption of beef has shown an increase of 67.1 thousand MT over the past ten years. Per-capita consumption also showed an increase from 5.3 Kg in 2007 to 6.5 Kg in 2017.
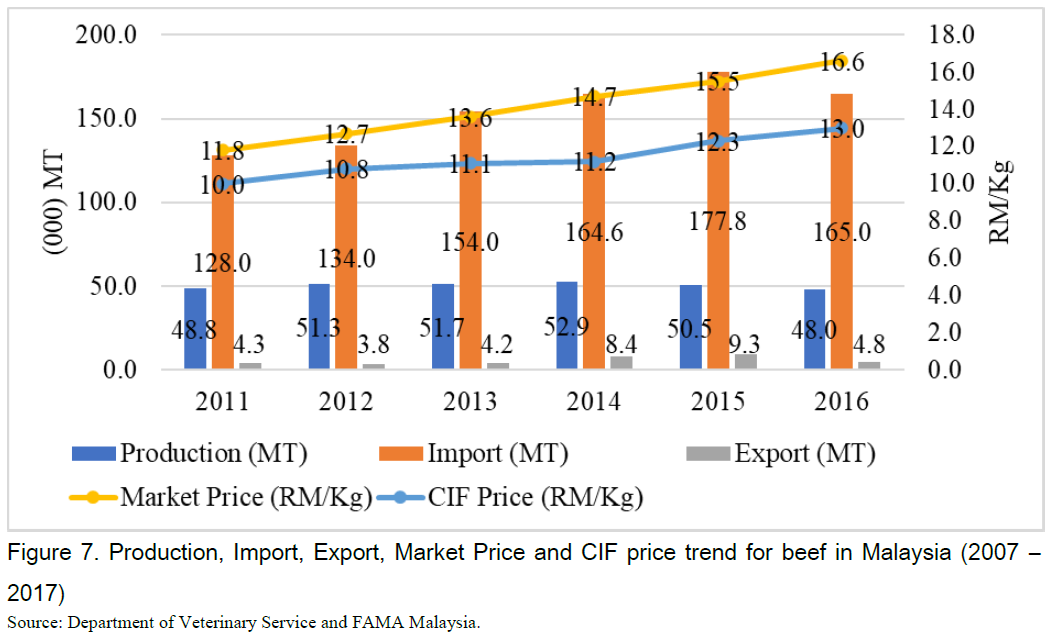
Local beef production volume showed a slight increase in 2011 - 2014, but started to decrease in 2015-2016. The domestic production can only cover around 30% of the total consumption, causing Malaysia to import beef. Consequently, the import trends shows an increase by 5.46% during the period 2011 - 2016. Malaysia relied heavily on beef from Australia and New Zealand. On the other hand, Malaysia imports buffalo meat from India because it is cheaper and more accessible than the beef from Australia and New Zealand, which expose to climate variability (Ariff et al., 2015). Import price for beef has increased from RM10/kg (US$ 2.47 / kg) in 2011 to RM 13/kg (US$3.20/kg) in 2016. The same trend was recorded for retail prices where the price has increased from RM11.80/kg (US$2.90) in 2011 to RM16.60/kg (US$4.10) in 2017 and this trend is expected to continue (Figure 7).
Lamb/mutton Industry
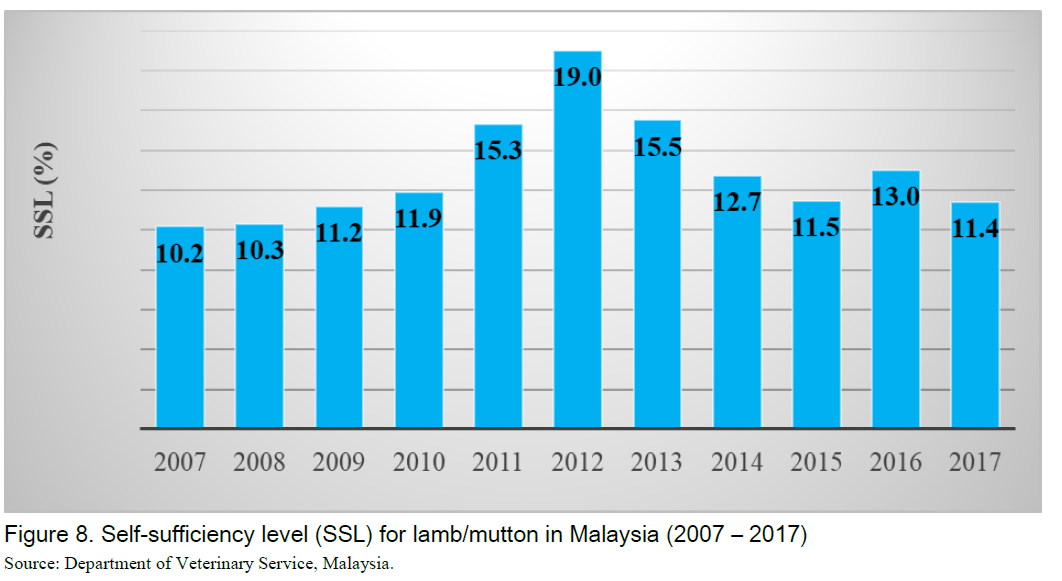
The lamb/mutton industry in Malaysia has shown a promising growth in recent years. However, it is still not sufficient for local demand. Malaysia relies heavily on lamb/mutton from Australia and New Zealand to cater for local shortages. This is clearly seen in Figure 8 where the SSL for lamb/mutton is at a low level of between 10.2% and 19.0%.
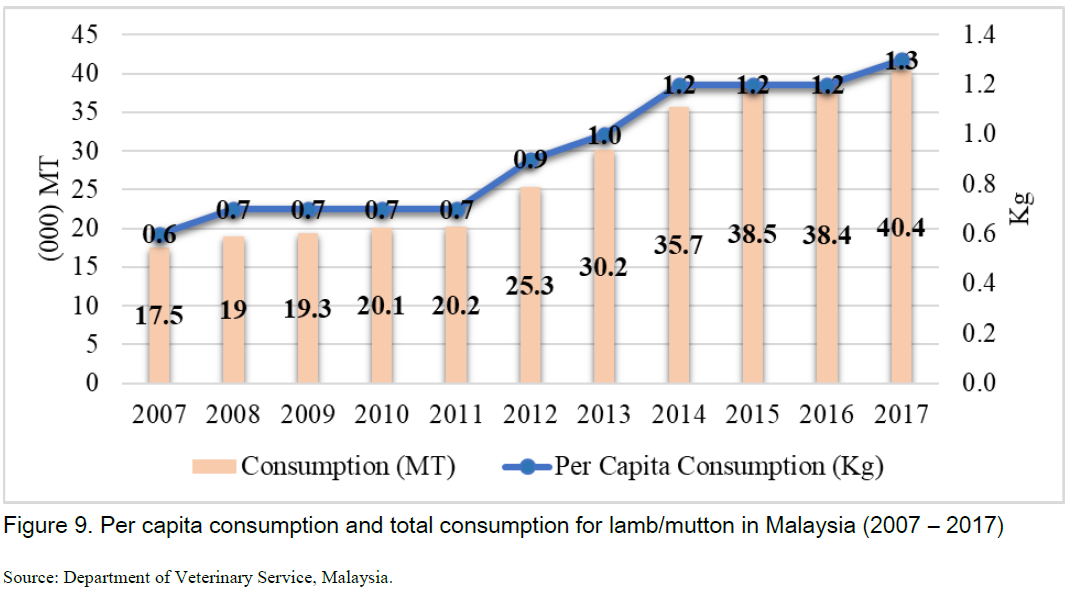
The lamb/mutton industry is relatively small if compared with other meat industries such as beef, chicken and pork, and the gap between production and consumption is expected to be higher. This is evidenced by the significant increase in the consumption of lamb/mutton while local production trends are still showing no improvement. Figure 9 shows the local consumption is increased from 17.5 thousand MT in 2007 to 40.4 thousand MT in 2017. This increase was due to the changing consumer preferences to lamb/mutton from beef. A few decades ago, the consumption of lamb/mutton was around one kilogram per year. The scent of lamb/mutton and the perception that it has high-fat content and cholesterol causes less consumption of this produce (Kaur, 2010). However, many studies have rejected this negative perception by showing the benefits of using lamb/mutton, which has led to increase in the consumption at the consumer level.
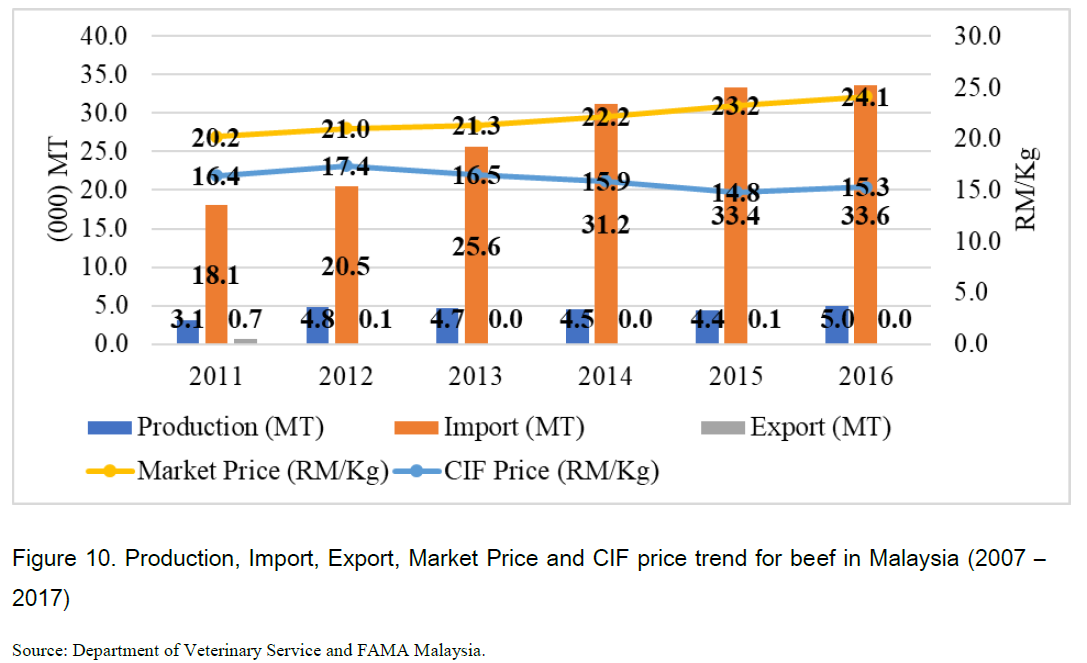
Based on Figure 10, the increase of consumption despite smaller production volume has led to higher demand of imported lamb/mutton. The quantity of imported lamb/mutton has increased around 15.5 thousand MT, from 18.1 thousand MT in 2011 to 33.6 thousand MT in 2016. It can be concluded that importing lamb/mutton meat is only to meet local demand.
On average, the lamb/mutton prices were higher than chicken (RM 6.70 / kg or US$ 1.65/kg) and beef (RM 18.70/kg or US$ 4.60/kg) in 2008 (Kaur, 2010). In average, the market price of imported lamb/mutton is in the range of RM20.20 to RM24.10 per kilogram (US$5.00 - US$5.95) as compared to the local produce, which is between RM30.00 and RM35.00 (US$7.40 - US$8.65) per kilogram. Import prices showed a slight decrease of RM 1.10 / kg (US$ 0.25/kg) for the period 2011 - 2017. However, the market price of lamb/mutton has increased every year due to the depreciation of the Malaysian Ringgit currency.
Lamb/mutton is gaining popular among the general population of Malaysia. A study by Kaur (2010) found that lamb/mutton was consumed by over 72% of the people in Malaysia, and the consumption level is expected to increase to more than 80% in 2020. The per capita consumption has also increased from 0.6 kg in 2007 to 1.3 (2017), indicating that there is a lot of upside potential.
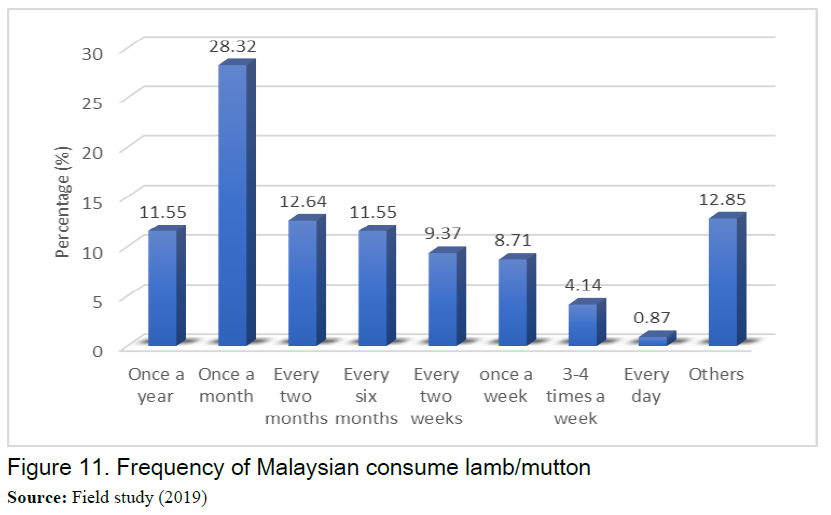
Further to this, a research was carried out by MARDI in 2019 that aims to understand more about consumers’ preference toward lamb/mutton in their daily diet. The study revealed that around 30% of consumers partake lamb/mutton on monthly basis, while around 4% of respondents consume lamb/mutton at least three to four times in a week. The price of lamb/mutton is relatively very expensive for majority of consumers and thus, prevent them to buy this produce more frequent.
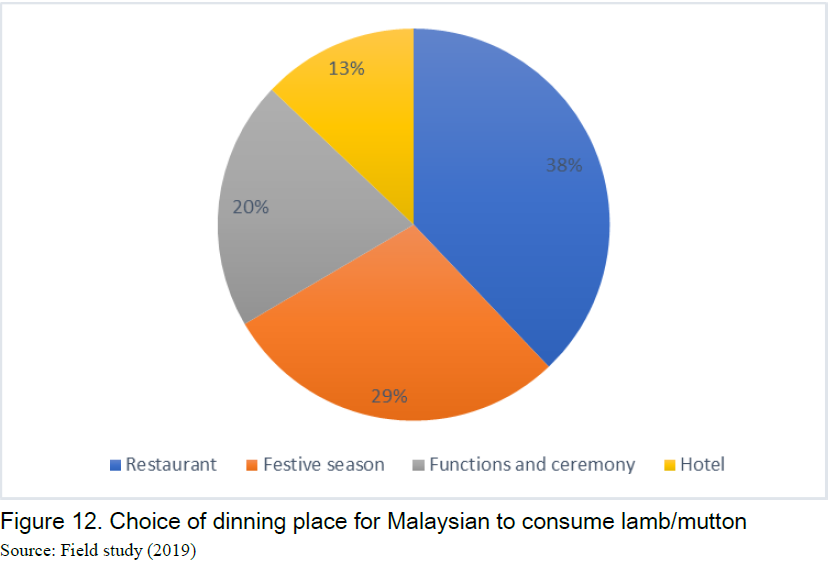
Almost 90% of consumers in Malaysia eat fresh meat (cooked as a dish such as mutton curry and grilled as BBQ). Less than 10% of the meat is processed such as burger, sausage, meat ball or canned. Apart from enjoying lamb/mutton at their home, respondents also tended to eat outside including at the restaurants (37.90%), Festive seasons (28.64%), Functions and other ceremony (20.56%) and hotels (12.90%). This shows that consumers have several options for eating lamb/mutton other than at home.
The youngsters also prefer western food style such as lamb chop and grilled lamb. The higher preference toward eating outside the house has been reflected by an increasing number of restaurants that serving lamb/mutton menu, especially in the urban and sub-urban areas.
Import quota liberalization in Malaysia
As a member of the World Trade Organization (WTO), the Asia-Pacific Economic Cooperation (APEC) and the ASEAN, Malaysia in general, follows the trade liberalization policy imposed by those organizations. This is because Malaysia has signed the trade agreement and supported the implementation of trade liberalization and bilateral/multilateral trading agreements with countries within and outside the region. Malaysia’s trade policy aims to enhance its global position as a trading nation and towards more liberalized and fair international trading environment. Even though it is a free-trade agreement, tariff is still one of the main trade policy instrument and gain revenues. For agricultural product entering Malaysia, the tariff will be between zero and 15% depending on the categories (Dardak, 2019).
Some measures were also introduced to protect the domestic industry as a trade barrier for the foreign products to enter the Malaysian market and subject to import licensing requirements. This measure will determine the quantity of agricultural produce that can enter the market at one time. However, starting from January 2016, Malaysia has introduced import quota liberalization policy. It includes eight agricultural products as follows:
- Live animals (cattle and buffalo)
- Live animals (goat and sheep)
- Beef (cattle and buffalo meat)
- Lamb and Mutton
- Pork
- Sucking pig
- Raw coffee bean
Import quota liberalization policy means that no more quotas were imposed on imported commodities. This is in line with the open economic system's practice that is expected to achieve faster and more stable economic growth in the global economy while also addressing the shortage of beef and lamb/mutton in this country. However, all importers are required to obtain an import permit from the Department of Veterinary Services (DVS) before they could import meat from any country in the world. In order to obtain an official import permit, they have to fulfil the standard of procedure or SOP. The DVS, the Department of Islamic Development, Malaysia (JAKIM) and the Ministry of Health, Malaysia (MOH) will conduct accreditation checks at the exporting countries. Only product that complies with the Sanitary and phytosanitary (SPS), Halal requirements and follows the standards will be given the permit. This is to ensure that the importation of meat will not create any risk of spreading disease to Malaysia, it is clean and safe to eat.
Impact of import quota liberalization on the beef and lamb/mutton industry
Trade liberalization opened a great opportunity for producing countries to export their beef and lamb/mutton to Malaysia. For many years, Malaysia is dependent on its source to several countries such as Australia and New Zealand. At the same time, the quota limits the entrance of the commodities and as a result, stabilizes the price of meat in local markets. The trade liberalization also provides the opportunity to breeders in bringing good breeds from other countries such as Wagyu cattle from Japan and Boer Goat from South Africa.
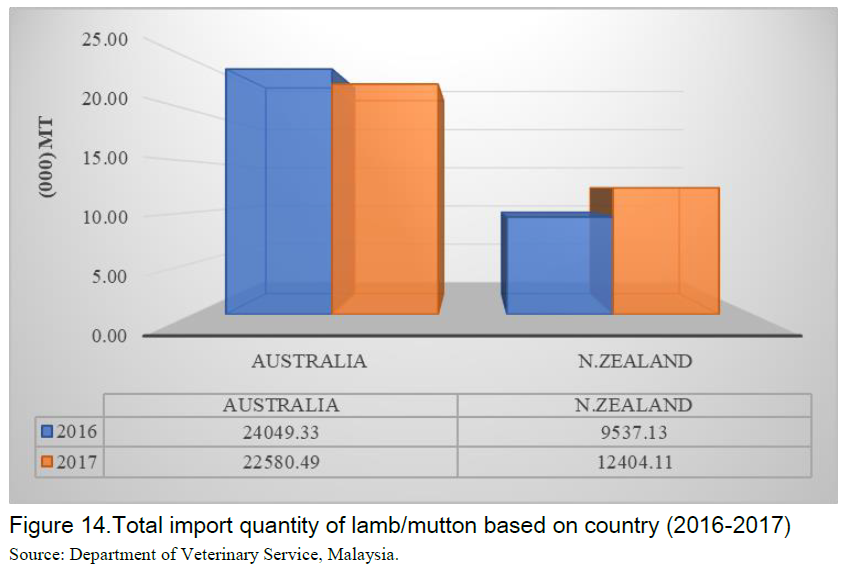
After Malaysia liberalized its import quota, importers started to find other sources of beef and lamb/mutton. The dependence toward meat from Australia and New Zealand is declining and products from Brazil, Pakistan, USA and Japan started to enter the Malaysian markets. Figure 13 and 14 below show the total import volume recorded by DVS for beef and lamb/mutton.
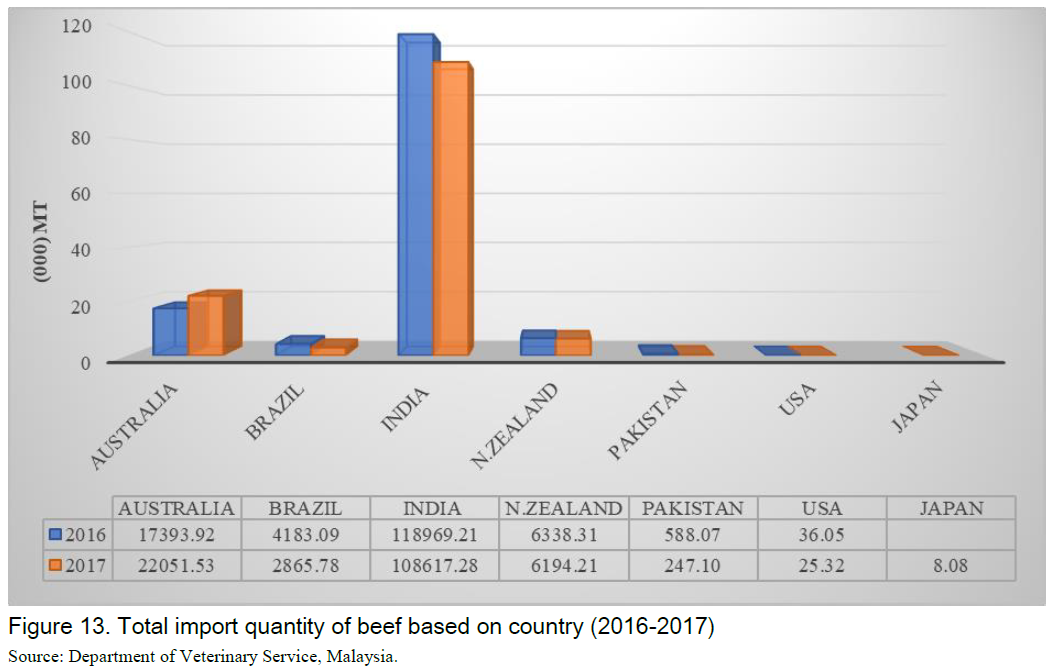
However, the main import of lamb and mutton still comes from Australia and New Zealand. The importers are seeking other cheaper sources, such as from India and South Africa. However, the main issue that needs to be solved is logistic or transportation cost.
The authors also study the impact of quota import liberalization from the importers in Malaysia. Primary data were collected through face-to-face surveys, and interviews were conducted with beef and lamb/mutton importers in Malaysia. The respondents were selected from active importers based on market share.
Table 6. Market share of respondents for beef and lamb/mutton importers (2016-2017)
|
Respondent
|
Beef
|
Lamb/mutton
|
|
Import quantity (MT)
|
Market share (%)
|
Import quantity (MT)
|
Market share (%)
|
|
1
|
1,158.62
|
0.80
|
890.61
|
2.50
|
|
2
|
9,693.65
|
6.68
|
2,970.60
|
8.33
|
|
3
|
19,882.44
|
13.69
|
6,006.10
|
16.85
|
|
4
|
2,553.31
|
1.76
|
1,053.38
|
2.95
|
|
5
|
7,612.80
|
5.24
|
221.74
|
0.62
|
|
6
|
9,143.63
|
6.30
|
795.68
|
2.23
|
|
7
|
5,057.49
|
3.48
|
n.a
|
n.a
|
|
8
|
5,581.32
|
3.84
|
1,709.23
|
4.79
|
|
9
|
1,157.96
|
0.80
|
1,080.06
|
3.03
|
|
10
|
40,899.75
|
28.17
|
8,882.07
|
24.90
|
Source: Field Survey (2018).
A total of ten importers were involved in the survey where they were randomly selected from the database provided by the DVS, in 2017. This primary data was analyzed using qualitative and descriptive methods. Nine out of ten companies are importing both beef and lamb/mutton, and only one company is importing beef.
Table 7. The impact of import quota liberalization towards industry
|
Impact
|
Mean
|
Standard Deviation
|
|
The implementation of liberalization facilitates business
|
4.10
|
0.994
|
|
Systematic and seamless management
|
4.10
|
0.994
|
|
The size of the business is increasing
|
3.50
|
1.179
|
|
Knowledge and skills in the import process become easier
|
3.80
|
0.919
|
|
Demand for meat supply is increasing
|
3.60
|
1.075
|
|
Revenue is growing
|
3.20
|
1.135
|
Likert scale: 1= strongly disagree; 2 = disagree; 3= not sure; 4=agree; 5=strongly agree
Table 7 shows the impact on the implementation of import quota liberalization on beef and lamb/mutton to importers. Respondents offered their opinions on a scale from 1 = strongly disagree to 5 = strongly agree. Based on the results of the descriptive analysis, the majority of respondents agree that the existence of liberalization can facilitate their business and that the company can deal systematically and smoothly. Other impacts were the increasing demand for meat supply (mean = 3.60) as well as knowledge and skills in the import process (mean = 3.80). However, increasing business size (mean = 3.50) and increasing income (mean = 3.20) could not be identified.
Table 8. Issues and challenges after implementation of import quota liberalization
|
Issues
|
Mean
|
Standard deviation
|
|
Operating costs are increasing
|
2.40
|
0.699
|
|
Raw material
|
|
|
- Difficult to obtain when needed
|
2.40
|
0.699
|
- Price is high and unstable
|
2.80
|
0.919
|
|
Workers
|
|
|
- High labor costs
|
2.00
|
0.000
|
- It's hard to find a worker
|
2.00
|
0.000
|
- Workers lack training / skills
|
2.00
|
0.000
|
- Workers often quit
|
2.00
|
0.000
|
|
Marketing
|
|
|
- Limited promotion
|
2.10
|
0.316
|
- Too much competition
|
3.10
|
1.197
|
- No / difficult to obtain market information
|
2.00
|
0.000
|
- There is not much market and has to go through bureaucratic
|
2.00
|
0.000
|
|
Services from Departments / Agencies
|
|
|
- Service is difficult to obtain
|
2.70
|
0.949
|
- No monitoring
|
2.40
|
0.699
|
Likert scale: 1= strongly disagree; 2 = disagree; 3= not sure; 4=agree; 5=strongly agree
In general, the change in policy does not affect the business operations of the local importers (Table 8). Since the price of imported beef and lamb/mutton is controlled by the government, the importers who have strong connection with the exporters will have the competitive advantage. The importers will buy at the cheaper price and sell the meat at the price determined by the government. These companies are seen to dominate the market share as they can offer cheaper price. At the same time, the government also provides supports and facilitates the process of importation of beef and lamb/mutton, especially from the new source of supply. For example, the government recognizes the Halal Certificate produce by the Muslim Authority in the non-Muslim countries. This will reduce the bureaucratic process and speed up the importation of the commodities. As a result, the supply of beef and lamb/mutton is always sufficient and secured.
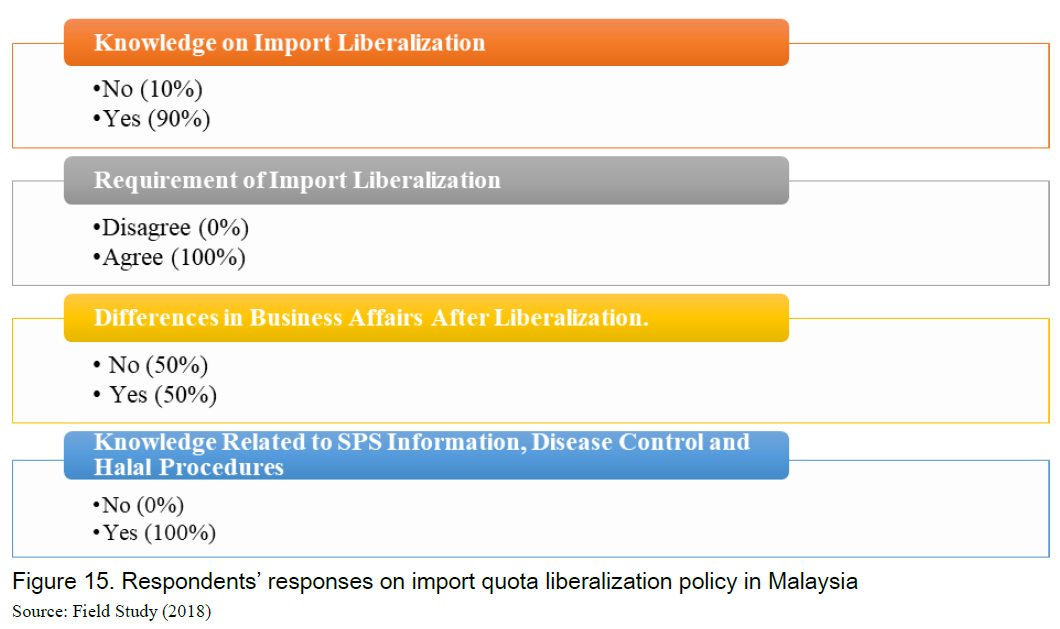
Figure 15 represents the response on the implementation of import liberalization on meat products in Malaysia. In general, importers are aware about the liberalization of beef and lamb/mutton procedure introduced by the DVS, and the majority of them support this import liberalization policy. The implementation of liberalization was found to have no negative effect on business operations at the meat industry level for 50% of the respondent.
Although there is no quota for importing the meat products, all of importers aware that import permit applications are still being pursued and subject to certain conditions, especially halal, sanitary and phytosanitary (SPS) procedures and disease control. The majority of respondents had this information.
The importers get their beef and lamb/mutton directly from the exporter or they are 100% self-imported companies. In other words, they are not buying through agents or other parties. As the government is very concern about food safety, all produce entering this country is strictly check at the port of entrance by the Malaysian Quarantine and Inspection Services (MAQIS). The MAQIS has the authority to confiscate any item deemed as a threat to the safety of the Malaysian consumers.
Around 80% of the importers sell their products as frozen and cold meat products directly to their customers consisting of wholesalers, retailers and some directly to consumers. Meanwhile, only 20% of the importing companies add-value by producing downstream products such as burgers, sausages, nuggets and meat-based products. Seventy percent of these products are produced mainly for local market and 30% for export markets. The traditional markets of Malaysian meat-based products are Singapore, Indonesia, Thailand and Brunei.
The open quota import system is also seen as having the negative impacts on local entrepreneurs. For example, after the implementation of this policy, the CIF price has increased, and consequently, affected the local processing industries. The rising prices of imported meat after liberalization were due to external factors such as the value of the currency and the selling price at the exporting countries. One way to mitigate this high-price impact is not to only rely on existing exporting countries. Malaysia must diversify the sources from other countries. From the positive side, the policy change helped the local industry to grow. The local production has been seen to increase significantly, and the quality of meat products also increases tremendously. The Processing industries have a better source of raw materials and can produce better end products, especially for export markets.
CONCLUSION
Liberalization should continue as Malaysia still has a high dependence on imported meat as domestic meat production is unable to meet the high demand every year. The low SSL for beef and lamb/mutton, indicating that import quota liberalization was crucial to ensuring availability of meat supply in Malaysia. Trade liberalization policy is one that the government must continue as it can guarantee the country's food supply. However, the enforcement of import policies and conditions needs to be strengthened to avoid internal issues such as the monopoly by big companies and to ensure that the local beef industry continues to strive to increase its production.
REFERENCES
Ariff, O.M. , Sharifah, N.Y. and Hafidz, A.W. (2015). Status of Beef Industry of Malaysia. Malaysian Journal of Animal Science. Vol 18(2): 1-21.
Dardak, R.A. (2019). Overview of Agriculture Trade in Malaysia. FFTC Agricultural Policy Platform. Retrived from “http://ap.fftc.agnet.org/ap_db.php?id=1021.
Department of Veterinary Service, DVS (2018). Livestock Statistics, 2017.
FAO (2017). Meat and Meat Products: Price and Trade Update. Food and Agriculture Organization of the United Nations.
Kaur, B. (2010). Consumer Preference for Goat Meat in Malaysia: Market Opportunities and Potential. Journal of Agribusiness Marketing. Vol. 3: 40-55.
Kendall. M.G. (1975). Rank Correlation Methods,.4th edition. Charles Griffin, London.
Kutner, M.H., Nachtsheim,C.J. and Neter,J. (2008). Applied Linear Regression Models. The McGrow-Hill Companies,Inc. 4th Edition.
Mann.H.B. (1945). Non-parametric tests against trend, Econometrica 13:163-171.
Meat and Livestock Australia (MLA). (2017). Market and Prices Report.
Ritcie, H and Roser, M. (2018). Meat and Seafood Production and Consumption. Retrieved from: “https:// ourworldindata.org/meat-and-seafood-production-conumption”.
Ucak, H. (2007). Trend in Meat Industry – Production, Consumption and Trade. Oeconomia. 6 (4):125 -131.
Vink, N. (2009). The Global Sheep Industry. Merino Science. 28-32.


Impact of Import Quota Liberalization Policy towards Malaysia’s Meat Industry
ABSTRACT
The livestock industry plays an important role in the Malaysian economy as the Compound Annual Growth Rates (CAGR) for both gross output and value added were recorded at 15.1% and 17.2%, respectively during 2010-2015 period with the largest contribution of the output stemming from the poultry industry. Despite having achieved full and even more than 100% of self-sufficiency level (SSL) for poultry meat and pork, Malaysia’s livestock sub-sector is struggling with ruminant industry as a large gap between local supply and demand continues to prolong due to a relatively low self-sufficiency level and thus, is highly dependent on imports. In 2017, the SSL for beef was recorded at 23.4% while lamb and mutton indicated a lower SSL rate of 11.4 %. As shortage in supply remains the major issue, the government has decided to liberalize import quotas for beef and lamb/mutton beginning in 2016. One of the major rationales of this policy changes is to address the inadequacy of local supply which affects consumer prices as well as food security through increasing consumer welfare. In this paper, secondary data on global and local meat industry and liberalization policy were compiled and analyzed using basic descriptive analysis. Furthermore, the primary data on the impact of import quota liberalization were also qualitatively analyzed. This study revealed that most of the meat importers in Malaysia agreed on the implementation of import quota liberalization. The import quota liberalization opens new opportunity for importers to explore a new source of beef and lamb/mutton and provide benefits through a better supply of produce with lower price.
Keywords: livestock, meat industry, import quota liberalization, importers, impact
INTRODUCTION
Meat is one of very important industries in Malaysia as it supplies source of protein for people, and raw materials for processing food industries. For many years, beef and lamb/mutton indicated an increasing consumption trend, while stagnant in the domestic production. In fact, the domestic productions of those products are declining in recent years, thus, affected the supply in the market. Further, it negatively affected market equilibrium while punishing consumers with incredibly higher market prices. To overcome this, Malaysia has moved towards a liberalization import policy since 2016, thus, opening its import quotas for several agricultural commodities, including meat and meat-based products.
Livestock is one of the major concerns due to not only having a relatively lower self-sufficient rate (SSR), but it also promotes value-added products in both domestic and export markets, hence contributing to the national economic growth. This article aims to give an in-depth understanding of the meat industry at both global and national levels. Furthermore, it can also explain the import quota liberalization in Malaysia, and also presents the impact of this policy implementation to the industry. As Malaysia is highly relying on imported meat products from several major livestock producers to meet the shortfall in domestic production, a market diversification of imported livestock could also be a policy strategy to protect both industry players and consumers.
WORLD SCENARIO OF MEAT INDUSTRY
World production trend
Globally, livestock production contributes around 40% of the total value of agricultural production. The increase in livestock production is due to the increasing trend in world population, income, changing lifestyle and nutrition intake (FAO, 2018). The increase in the world livestock production is contributed mainly by increasing in farm productivity and economies of scale. Meat consumption has also increased in line with dietary changes by people who are no longer dependent on staple foods, such as rice, bread and cereals. On average, meat consumption in developed countries is double as high as the world consumption. These changes are also due to increasing population, increasing income and increasing urbanization and demand for meat and meat products in developing countries.
Some developed countries have achieved high levels of productivity in livestock and have a comparative advantage in the global meat trade (Ucak, 2007). Developing countries are also working to change the level of livestock production. However, productivity levels in developing countries are still low compared to developed countries. In the 1960s, Europe and North America were the major producers of meat in the world, which contributed to around 42% and 25% of the production, respectively. However, after almost 50 years, in 2013, the Asian region accounted for 45% of the world's total meat production (Ritchie and Roser, 2018).
Generally, meat is divided into two types: white and red. White meat consists of poultry and fish. Whereas red meat comes from livestock such as cattle, buffaloes, pigs, goats and sheep. Although the trend for meat production is increasing, there are different trends for each type of meats. For example, in 1961 poultry production accounted for 12% of the world meat production and tripled by 35% in 2013. During the same period, the world production of beef, lamb and mutton shows decreasing trends to 28% in 2013 compared with 50% in 1961. However, the global pork production is constant at 35-40% throughout the year (Ritchie and Roser, 2018).
In this study, data related to trends for production, consumption, trade and market prices were collected from the FAO, based on the HS Code in (Table 1).
Table 1. HS code used in this study
Beef and lamb/mutton product
HS code
Meat of bovine animals, fresh or chilled
0201
Meat of bovine animals, frozen
0202
Meat of sheep or goats, fresh, chilled or frozen
0204
Source: Global Trade Information System (GTIS, 2018)
The production of beef (meat of bovine animals) and lamb/mutton in the world shows an increase to 68 million MT in 2016, from 28 million MT in 2014.
According to Figure 1, the United States of America is the largest producer of beef with production of 10 - 11 million MT during 2010 - 2016. The other major producers are Brazil and China with annual production of nine million MT and six million MT. This is followed by Argentina and Australia that producing 2 - 3 million MT a year. During these seven years (2010-2016), the production trends for these five countries showed constant figures with no significant changes recorded.
Figure 2 shows the major producing countries of lamb/mutton. In 2010 - 2016, China dominated the lamb/mutton production with a total production of 3-4 million MT a year, followed by India with a total production of 0.7 million MT a year. There was an increase in total production for Australia by 0.13 million MT from 0.58 million MT (2010) to 0.71 million MT (2016). For New Zealand and Pakistan, each country has an average annual production of 0.48 million MT and 0.46 million MT. Western Asian countries such as Iran and Turkey are also the world's largest producers of lamb/mutton with an average annual production of 0.37 million MT and 0.34 million MT, respectively.
World Trade Trend
According to the FAO, the world meat trade has risen to US$ 52 billion in 2017. This trend is expected to continue due to the liberalization of international trade by the World Trade Organization (WTO). Since 1985, the increase in the value of world meat trade has been attributed to trade openness policies mainly practiced by Japan and South Korea as well as trade agreements by North American countries (NAFTA). The opening of new farms such as in China and Russia has also played a role in increasing meat trade worldwide. In addition, the increasing income of the developing countries is also the contributing factor to the increasing value of world meat trade (Ucak, 2007).
Most countries that import beef is from developed countries such as the United States of America, China, Japan and South Korea (Table 2). According to this table, Malaysia was ranked number eleven in the list of major importing countries for beef in the world. This indicated that Malaysia is very much dependent on imported beef. It is also suggested that although Malaysia’s population is smaller, the consumption is high meaning that meat is very important food to Malaysians.
Table 2. Major importing country for beef (2014-2017)
Country
2014
2015
2016
2017
Total
(‘000) MT
United States of America
1,337
1,529
1,367
1,358
5,591
China
417
663
812
974
2,866
Japan
739
707
719
817
2,982
Hong Kong
646
339
453
543
1,981
South Korea
392
414
513
531
1,850
Russia
932
621
522
509
2,584
European United (E.U)
372
363
368
338
1,441
Egypt
270
360
340
250
1,220
Chile
241
245
298
281
1,065
Canada
272
269
243
229
1,013
Malaysia
205
237
218
211
871
Source: United States Department of Agriculture (USDA, 2018).
While, the major exporting countries based on the total volume in four years (2014-2017) are countries that have the advantage of increasing economies of scale such as Brazil, India, Australia and New Zealand where they have large-scale livestock farms (Table 3). However, the export value of these countries shows a declining trend for four years. In the case of Brazil, for example, the decrease in export value is in line with the decline in production. The production of beef in Brazil has decreased from 9.72 million MT in 2014 to 9.28 million MT in 2016. Consequently, the export also declined from 1.909 million MT to 1.7 million MT in 2016.
Table 3. Major exporting countries for beef (2014-2017)
Country
2014
2015
2016
2017
Total
(‘000) MT
Brazil
1,909
1,705
1,698
1,856
7,168
India
2,082
1,806
1,764
1,849
7,501
Australia
1,851
1,854
1,480
1,486
6,671
United States of America
1,167
1,028
1,159
1,298
4,652
New Zealand
579
639
587
593
2,398
Canada
378
397
441
469
1,685
Uruguay
350
373
421
435
1,579
Paraguay
389
381
389
378
1,537
European United (E.U)
301
303
344
367
1,315
Argentina
197
186
216
293
892
Mexico
194
228
258
280
960
Source: United States Department of Agriculture (USDA, 2018).
Other issues affecting the world meat trade include urbanization as well as dietary changes and consumer tastes by type of meat. In addition, the abolition of tariff barriers in the international meat trade has also contributed to changes in world imports and exports. The issues of food security and climate change are also factors in the changing of world beef trade.
Growth in world lamb/mutton trade quantity is relatively small compared to beef trade (FAO, 2018). However, the trade value of lamb/mutton is higher than beef. This is due to the higher price of lamb/mutton (Figure 3).
According to Table 4, the main importing countries are China, United States of America, United Kingdom and Germany. Even though these countries have reached a level of self-sufficiency but still rely on imported lamb/mutton such as the United States of America and China to support the population growth. There are also Asian countries that recorded an increasing demand for lamb/mutton likes Malaysia (5th place) and Japan.
Table 4. Major importing country for lamb/mutton (2014 – 2017)
Country
2014
2015
2016
2017
Total
(‘000) MT
China
282.9
222.9
220.1
n.a
725.9
United States of America
92.9
103.5
116.5
138.3
451.2
United Kingdom
57.7
93.5
90.0
80.3
321.5
German
34.4
38.5
39.2
41.3
153.4
Malaysia
31.2
34.2
33.4
38.6
137.4
Italy
25.0
24.8
29.4
25.1
104.3
Jordan
24.4
28.0
24.0
24.5
100.9
Japan
20.7
18.5
20.0
22.2
81.4
Kuwait
11.4
13.5
10.2
13.7
48.8
Source: Comtrade (2018).
On the other hand, the list of major exporters for the period 2014 - 2017 was dominated by the Asia Pacific countries like Australia and New Zealand, followed by the United Kingdom (Table 5). The high productivity of lamb/mutton in Australia and New Zealand with lower prices has been an import factor for Asian countries, including Malaysia (Vink, 2009). Australia and New Zealand have been the source of supply of lamb/mutton for Malaysia because they offer cheaper price and convenient logistic.
Table 5. Major exporting countries for lamb/mutton (2014 – 2017)
Country
2014
2015
2016
2017
Total
(‘000) MT
Australia
498.5
458.1
442.1
454.7
1853.4
New Zealand
415.7
418.3
387.4
395.4
1616.8
United Kingdom
102.3
79.5
78.3
90.0
350.1
Ireland
39.4
42.5
48.6
56.1
186.6
Spain
33.5
31.8
34.8
37.2
137.3
Romania
3.6
6.8
5.4
8.2
24.0
German
6.5
6.5
6.1
6.9
26.0
Chile
6.2
5.0
4.9
5.4
21.5
Italy
2.5
3.0
2.7
3.9
12.1
Source: Comtrade (2018).
Figure 4 shows a comparison of the per-capita consumption of beef and lamb/mutton in the world. The per-capita consumption of beef is 6 - 7 kg, which is three times the per- capita consumption of lamb/mutton, which is 1-2 Kg a year. This is in line with higher lamb/mutton market prices with increasing trend of lamb/mutton ranging from US $ 5 / kg - US $ 6 / kg compared to US $ 2 / kg - US $ 3 / kg for beef (Figure 3).
SCENARIO OF MEAT INDUSTRY IN MALAYSIA
Beef industry
There has been a significant increase in the economic value of the beef industry in Malaysia, from RM0.697 billion (US$ 2.44 billion) in 2008 to RM 2.51 billion (US$ 8 billion) in 2013 due to the domestic production value and import value of livestock (Ariff et al., 2015). Figure 5 shows Malaysia has a high dependence on imported beef with a low self-sufficiency level (SSL) of 24.2% in 2007 decreasing to 23.4% in 2017. According to the study by Ariff et al., in order to increase 1% of the SSL, the industry needs to increase the number of slaughtered cattle to around 14,000 animals a year. The industry is targeted to increase the SSL to 32.7% by 2020 (MOA, 2015) which could be translated into 450,000 slaughtered cattle per annum.
Figure 5 indicates that Malaysia has a low capability to produce beef for domestic consumption. Despite its rich flora and fauna, Malaysia still does not have the competitive advantage to produce beef. The lack of land suitable for cattle rearing is the main factor that hindered the industry to expand.
Beef is one of the main sources of protein consumed by most people in the country. Based on Figure 6, the total consumption of beef has shown an increase of 67.1 thousand MT over the past ten years. Per-capita consumption also showed an increase from 5.3 Kg in 2007 to 6.5 Kg in 2017.
Local beef production volume showed a slight increase in 2011 - 2014, but started to decrease in 2015-2016. The domestic production can only cover around 30% of the total consumption, causing Malaysia to import beef. Consequently, the import trends shows an increase by 5.46% during the period 2011 - 2016. Malaysia relied heavily on beef from Australia and New Zealand. On the other hand, Malaysia imports buffalo meat from India because it is cheaper and more accessible than the beef from Australia and New Zealand, which expose to climate variability (Ariff et al., 2015). Import price for beef has increased from RM10/kg (US$ 2.47 / kg) in 2011 to RM 13/kg (US$3.20/kg) in 2016. The same trend was recorded for retail prices where the price has increased from RM11.80/kg (US$2.90) in 2011 to RM16.60/kg (US$4.10) in 2017 and this trend is expected to continue (Figure 7).
Lamb/mutton Industry
The lamb/mutton industry in Malaysia has shown a promising growth in recent years. However, it is still not sufficient for local demand. Malaysia relies heavily on lamb/mutton from Australia and New Zealand to cater for local shortages. This is clearly seen in Figure 8 where the SSL for lamb/mutton is at a low level of between 10.2% and 19.0%.
The lamb/mutton industry is relatively small if compared with other meat industries such as beef, chicken and pork, and the gap between production and consumption is expected to be higher. This is evidenced by the significant increase in the consumption of lamb/mutton while local production trends are still showing no improvement. Figure 9 shows the local consumption is increased from 17.5 thousand MT in 2007 to 40.4 thousand MT in 2017. This increase was due to the changing consumer preferences to lamb/mutton from beef. A few decades ago, the consumption of lamb/mutton was around one kilogram per year. The scent of lamb/mutton and the perception that it has high-fat content and cholesterol causes less consumption of this produce (Kaur, 2010). However, many studies have rejected this negative perception by showing the benefits of using lamb/mutton, which has led to increase in the consumption at the consumer level.
Based on Figure 10, the increase of consumption despite smaller production volume has led to higher demand of imported lamb/mutton. The quantity of imported lamb/mutton has increased around 15.5 thousand MT, from 18.1 thousand MT in 2011 to 33.6 thousand MT in 2016. It can be concluded that importing lamb/mutton meat is only to meet local demand.
On average, the lamb/mutton prices were higher than chicken (RM 6.70 / kg or US$ 1.65/kg) and beef (RM 18.70/kg or US$ 4.60/kg) in 2008 (Kaur, 2010). In average, the market price of imported lamb/mutton is in the range of RM20.20 to RM24.10 per kilogram (US$5.00 - US$5.95) as compared to the local produce, which is between RM30.00 and RM35.00 (US$7.40 - US$8.65) per kilogram. Import prices showed a slight decrease of RM 1.10 / kg (US$ 0.25/kg) for the period 2011 - 2017. However, the market price of lamb/mutton has increased every year due to the depreciation of the Malaysian Ringgit currency.
Lamb/mutton is gaining popular among the general population of Malaysia. A study by Kaur (2010) found that lamb/mutton was consumed by over 72% of the people in Malaysia, and the consumption level is expected to increase to more than 80% in 2020. The per capita consumption has also increased from 0.6 kg in 2007 to 1.3 (2017), indicating that there is a lot of upside potential.
Further to this, a research was carried out by MARDI in 2019 that aims to understand more about consumers’ preference toward lamb/mutton in their daily diet. The study revealed that around 30% of consumers partake lamb/mutton on monthly basis, while around 4% of respondents consume lamb/mutton at least three to four times in a week. The price of lamb/mutton is relatively very expensive for majority of consumers and thus, prevent them to buy this produce more frequent.
Almost 90% of consumers in Malaysia eat fresh meat (cooked as a dish such as mutton curry and grilled as BBQ). Less than 10% of the meat is processed such as burger, sausage, meat ball or canned. Apart from enjoying lamb/mutton at their home, respondents also tended to eat outside including at the restaurants (37.90%), Festive seasons (28.64%), Functions and other ceremony (20.56%) and hotels (12.90%). This shows that consumers have several options for eating lamb/mutton other than at home.
The youngsters also prefer western food style such as lamb chop and grilled lamb. The higher preference toward eating outside the house has been reflected by an increasing number of restaurants that serving lamb/mutton menu, especially in the urban and sub-urban areas.
Import quota liberalization in Malaysia
As a member of the World Trade Organization (WTO), the Asia-Pacific Economic Cooperation (APEC) and the ASEAN, Malaysia in general, follows the trade liberalization policy imposed by those organizations. This is because Malaysia has signed the trade agreement and supported the implementation of trade liberalization and bilateral/multilateral trading agreements with countries within and outside the region. Malaysia’s trade policy aims to enhance its global position as a trading nation and towards more liberalized and fair international trading environment. Even though it is a free-trade agreement, tariff is still one of the main trade policy instrument and gain revenues. For agricultural product entering Malaysia, the tariff will be between zero and 15% depending on the categories (Dardak, 2019).
Some measures were also introduced to protect the domestic industry as a trade barrier for the foreign products to enter the Malaysian market and subject to import licensing requirements. This measure will determine the quantity of agricultural produce that can enter the market at one time. However, starting from January 2016, Malaysia has introduced import quota liberalization policy. It includes eight agricultural products as follows:
Import quota liberalization policy means that no more quotas were imposed on imported commodities. This is in line with the open economic system's practice that is expected to achieve faster and more stable economic growth in the global economy while also addressing the shortage of beef and lamb/mutton in this country. However, all importers are required to obtain an import permit from the Department of Veterinary Services (DVS) before they could import meat from any country in the world. In order to obtain an official import permit, they have to fulfil the standard of procedure or SOP. The DVS, the Department of Islamic Development, Malaysia (JAKIM) and the Ministry of Health, Malaysia (MOH) will conduct accreditation checks at the exporting countries. Only product that complies with the Sanitary and phytosanitary (SPS), Halal requirements and follows the standards will be given the permit. This is to ensure that the importation of meat will not create any risk of spreading disease to Malaysia, it is clean and safe to eat.
Impact of import quota liberalization on the beef and lamb/mutton industry
Trade liberalization opened a great opportunity for producing countries to export their beef and lamb/mutton to Malaysia. For many years, Malaysia is dependent on its source to several countries such as Australia and New Zealand. At the same time, the quota limits the entrance of the commodities and as a result, stabilizes the price of meat in local markets. The trade liberalization also provides the opportunity to breeders in bringing good breeds from other countries such as Wagyu cattle from Japan and Boer Goat from South Africa.
After Malaysia liberalized its import quota, importers started to find other sources of beef and lamb/mutton. The dependence toward meat from Australia and New Zealand is declining and products from Brazil, Pakistan, USA and Japan started to enter the Malaysian markets. Figure 13 and 14 below show the total import volume recorded by DVS for beef and lamb/mutton.
However, the main import of lamb and mutton still comes from Australia and New Zealand. The importers are seeking other cheaper sources, such as from India and South Africa. However, the main issue that needs to be solved is logistic or transportation cost.
The authors also study the impact of quota import liberalization from the importers in Malaysia. Primary data were collected through face-to-face surveys, and interviews were conducted with beef and lamb/mutton importers in Malaysia. The respondents were selected from active importers based on market share.
Table 6. Market share of respondents for beef and lamb/mutton importers (2016-2017)
Respondent
Beef
Lamb/mutton
Import quantity (MT)
Market share (%)
Import quantity (MT)
Market share (%)
1
1,158.62
0.80
890.61
2.50
2
9,693.65
6.68
2,970.60
8.33
3
19,882.44
13.69
6,006.10
16.85
4
2,553.31
1.76
1,053.38
2.95
5
7,612.80
5.24
221.74
0.62
6
9,143.63
6.30
795.68
2.23
7
5,057.49
3.48
n.a
n.a
8
5,581.32
3.84
1,709.23
4.79
9
1,157.96
0.80
1,080.06
3.03
10
40,899.75
28.17
8,882.07
24.90
Source: Field Survey (2018).
A total of ten importers were involved in the survey where they were randomly selected from the database provided by the DVS, in 2017. This primary data was analyzed using qualitative and descriptive methods. Nine out of ten companies are importing both beef and lamb/mutton, and only one company is importing beef.
Table 7. The impact of import quota liberalization towards industry
Impact
Mean
Standard Deviation
The implementation of liberalization facilitates business
4.10
0.994
Systematic and seamless management
4.10
0.994
The size of the business is increasing
3.50
1.179
Knowledge and skills in the import process become easier
3.80
0.919
Demand for meat supply is increasing
3.60
1.075
Revenue is growing
3.20
1.135
Likert scale: 1= strongly disagree; 2 = disagree; 3= not sure; 4=agree; 5=strongly agree
Table 7 shows the impact on the implementation of import quota liberalization on beef and lamb/mutton to importers. Respondents offered their opinions on a scale from 1 = strongly disagree to 5 = strongly agree. Based on the results of the descriptive analysis, the majority of respondents agree that the existence of liberalization can facilitate their business and that the company can deal systematically and smoothly. Other impacts were the increasing demand for meat supply (mean = 3.60) as well as knowledge and skills in the import process (mean = 3.80). However, increasing business size (mean = 3.50) and increasing income (mean = 3.20) could not be identified.
Table 8. Issues and challenges after implementation of import quota liberalization
Issues
Mean
Standard deviation
Operating costs are increasing
2.40
0.699
Raw material
2.40
0.699
2.80
0.919
Workers
2.00
0.000
2.00
0.000
2.00
0.000
2.00
0.000
Marketing
2.10
0.316
3.10
1.197
2.00
0.000
2.00
0.000
Services from Departments / Agencies
2.70
0.949
2.40
0.699
Likert scale: 1= strongly disagree; 2 = disagree; 3= not sure; 4=agree; 5=strongly agree
In general, the change in policy does not affect the business operations of the local importers (Table 8). Since the price of imported beef and lamb/mutton is controlled by the government, the importers who have strong connection with the exporters will have the competitive advantage. The importers will buy at the cheaper price and sell the meat at the price determined by the government. These companies are seen to dominate the market share as they can offer cheaper price. At the same time, the government also provides supports and facilitates the process of importation of beef and lamb/mutton, especially from the new source of supply. For example, the government recognizes the Halal Certificate produce by the Muslim Authority in the non-Muslim countries. This will reduce the bureaucratic process and speed up the importation of the commodities. As a result, the supply of beef and lamb/mutton is always sufficient and secured.
Figure 15 represents the response on the implementation of import liberalization on meat products in Malaysia. In general, importers are aware about the liberalization of beef and lamb/mutton procedure introduced by the DVS, and the majority of them support this import liberalization policy. The implementation of liberalization was found to have no negative effect on business operations at the meat industry level for 50% of the respondent.
Although there is no quota for importing the meat products, all of importers aware that import permit applications are still being pursued and subject to certain conditions, especially halal, sanitary and phytosanitary (SPS) procedures and disease control. The majority of respondents had this information.
The importers get their beef and lamb/mutton directly from the exporter or they are 100% self-imported companies. In other words, they are not buying through agents or other parties. As the government is very concern about food safety, all produce entering this country is strictly check at the port of entrance by the Malaysian Quarantine and Inspection Services (MAQIS). The MAQIS has the authority to confiscate any item deemed as a threat to the safety of the Malaysian consumers.
Around 80% of the importers sell their products as frozen and cold meat products directly to their customers consisting of wholesalers, retailers and some directly to consumers. Meanwhile, only 20% of the importing companies add-value by producing downstream products such as burgers, sausages, nuggets and meat-based products. Seventy percent of these products are produced mainly for local market and 30% for export markets. The traditional markets of Malaysian meat-based products are Singapore, Indonesia, Thailand and Brunei.
The open quota import system is also seen as having the negative impacts on local entrepreneurs. For example, after the implementation of this policy, the CIF price has increased, and consequently, affected the local processing industries. The rising prices of imported meat after liberalization were due to external factors such as the value of the currency and the selling price at the exporting countries. One way to mitigate this high-price impact is not to only rely on existing exporting countries. Malaysia must diversify the sources from other countries. From the positive side, the policy change helped the local industry to grow. The local production has been seen to increase significantly, and the quality of meat products also increases tremendously. The Processing industries have a better source of raw materials and can produce better end products, especially for export markets.
CONCLUSION
Liberalization should continue as Malaysia still has a high dependence on imported meat as domestic meat production is unable to meet the high demand every year. The low SSL for beef and lamb/mutton, indicating that import quota liberalization was crucial to ensuring availability of meat supply in Malaysia. Trade liberalization policy is one that the government must continue as it can guarantee the country's food supply. However, the enforcement of import policies and conditions needs to be strengthened to avoid internal issues such as the monopoly by big companies and to ensure that the local beef industry continues to strive to increase its production.
REFERENCES
Ariff, O.M. , Sharifah, N.Y. and Hafidz, A.W. (2015). Status of Beef Industry of Malaysia. Malaysian Journal of Animal Science. Vol 18(2): 1-21.
Dardak, R.A. (2019). Overview of Agriculture Trade in Malaysia. FFTC Agricultural Policy Platform. Retrived from “http://ap.fftc.agnet.org/ap_db.php?id=1021.
Department of Veterinary Service, DVS (2018). Livestock Statistics, 2017.
FAO (2017). Meat and Meat Products: Price and Trade Update. Food and Agriculture Organization of the United Nations.
Kaur, B. (2010). Consumer Preference for Goat Meat in Malaysia: Market Opportunities and Potential. Journal of Agribusiness Marketing. Vol. 3: 40-55.
Kendall. M.G. (1975). Rank Correlation Methods,.4th edition. Charles Griffin, London.
Kutner, M.H., Nachtsheim,C.J. and Neter,J. (2008). Applied Linear Regression Models. The McGrow-Hill Companies,Inc. 4th Edition.
Mann.H.B. (1945). Non-parametric tests against trend, Econometrica 13:163-171.
Meat and Livestock Australia (MLA). (2017). Market and Prices Report.
Ritcie, H and Roser, M. (2018). Meat and Seafood Production and Consumption. Retrieved from: “https:// ourworldindata.org/meat-and-seafood-production-conumption”.
Ucak, H. (2007). Trend in Meat Industry – Production, Consumption and Trade. Oeconomia. 6 (4):125 -131.
Vink, N. (2009). The Global Sheep Industry. Merino Science. 28-32.