ABSTRACT
The rapid development of AI and IoT devices and infrastructure has formed the convergence of the two transformative technologies into AIoT (Artificial Intelligence of Things). Although AIoT is still at a growing stage, its applications in many areas are already boosting enormous business potentials. This emerging technology also creates immense potential in solving problems as well as changing the shape of agriculture. AIoT utilizes modern technologies including, but not limited to, smart sensors, image processing, cloud computing, data analytics, network communication, and artificial intelligence to make agricultural production, management, and marketing more autonomous and efficient. The delivery of information to farmers, farm managers, or consumers becomes more instantaneous and easier to access. Thus, the applications of AIoT will help not only in increasing the quantity and quality of food production but also in enhancing the efficiency of agricultural operations such as pest and plant disease management. While AIoT will become one of the main driving forces for smart agriculture, there are still some barriers need to be overcome such as the cost factors and the adaptation to the traditional agricultural practice. In this paper, we will discuss several promising AIoT applications in agriculture such as insect pest monitoring and forecasting, greenhouse management, livestock monitoring, etc. Through the application examples we can have a deeper look and understanding of the future impact of AIoT on modern agriculture.
Keywords: Deep learning, wireless sensor networks, insect pest monitoring, dairy cow monitoring, precision agriculture
INTRODUCTION
Due to the rise in population all over the world, it is predicted that the world should produce 70% more food by 2050 (Food and Agriculture Organization of the United Nations, 2009). In addition, there are also issues in food waste management, climate change, and scarcity in natural resources that should be addressed. One of the solutions to these problems is smart agriculture. By utilizing modern and innovative technology, the gap between productivity and sustainability can be reduced. Smart agriculture encourages farmers to slowly adapt into more systematic and data-driven agricultural techniques.
Just recently, a new concept called Artificial Intelligence of Things (AIoT) has been introduced to assist in accelerating the development of smart farming. It aims to combine the power of connectivity from Internet of Things (IoT) and the data-driven knowledge obtained from Artificial Intelligence (AI). Typically, an IoT system involves the use of wireless sensor networks (WSN) for collecting data seamlessly (Lamhichhane et al., 2016; Andonovic et al., 2009). Wireless sensor nodes are deployed in different assigned locations for gathering spatial and temporal data. As IoT is combined with AI, the data can be further utilized by applying AI techniques such as machine learning and deep learning for performing data interpretation, automatic image analysis, data forecasting and many more. This can be used to provide more than data but also recommend possible solutions to problems that farmers may encounter.
In this paper, examples are introduced to show the potential of integrating AI and IoT to develop more intelligent systems for agriculture. The presented examples are some of our undergoing projects in AIoT for smart agriculture that can be used as a reference on how to further improve current agricultural systems.
AIOT TECHNOLOGY AND ITS APPLICATIONS
Nowadays, AIoT systems are seen emerging and aiming to solve problems that were not solvable until AI and IoT were made more available. For instance, wireless imaging has not been possible until embedded systems with higher computing capabilities were released. By having more commercially available embedded systems, more computationally intensive processes can be performed unlike when typical microcontrollers are used. Thus, more advanced applications such as developing wireless imaging sensor networks (WISN) are made more possible. In this section, two examples demonstrating the capabilities of AIoT systems using integrated imaging and environmental sensing are presented.
Intelligent insect pest monitoring system
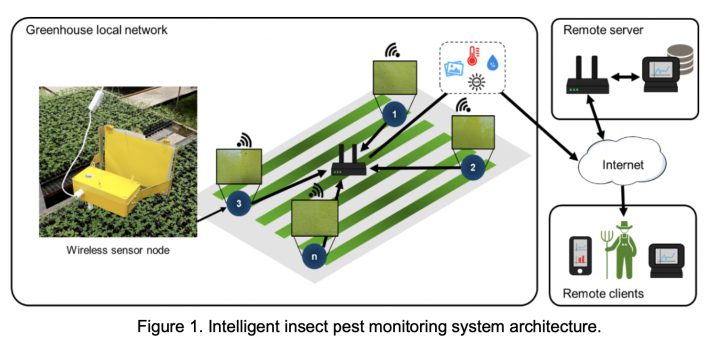
One of the latest applications of AIoT in agriculture is intelligent insect pest monitoring. By keeping track of the population density of the insect pests in ones’ farm, data-driven strategies can be developed for implementing integrated pest management (IPM). To fulfill this goal, we developed an insect pest monitoring system composed of wireless imaging and environmental sensor nodes. Each node includes an embedded system, RGB camera, temperature-humidity sensor, and light intensity sensor. A sticky paper trap is held with a fixed distance in front of each node and the image of the sticky paper trap is captured by the camera. The sticky paper trap images, together with the environmental data, are sent to the remote server via internet for remote processing. The nodes are hung inside the greenhouses depending on the suspected insect pest hotspots, as suggested by the farm owners. The architecture of the system is shown in Figure 1.
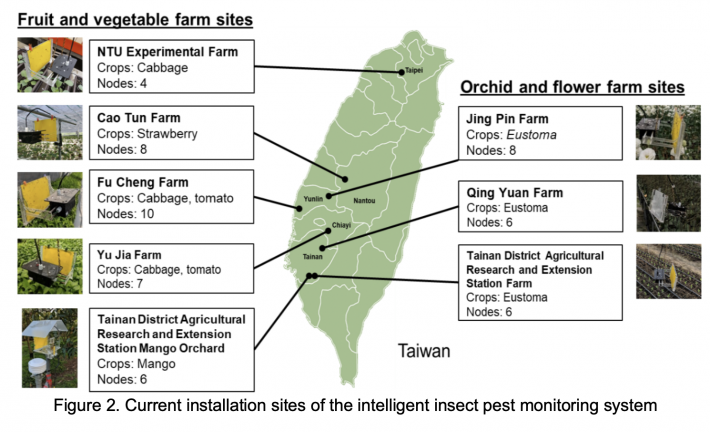
The system described in Figure 1 is currently installed in seven greenhouses and one outdoor orchard in Taiwan. The installation sites are locations that are in need of an insect pest monitoring system to conduct integrated pest management for preventing crop damages. The approximate locations of the installation sites of the system in Taiwan are shown in Figure 2.
In analyzing the sticky paper trap images, an insect pest detection and recognition algorithm is used. Before the emergence of AI in image processing, most algorithms for insect pest detection and recognition use traditional image processing techniques for analyzing the sticky paper trap images. Ever since, most works use a method in image processing called color segmentation (Espinoza et al., 2016; Cho et al., 2007; Xia et al., 2014) for detecting the insect objects from the images. Color segmentation aims to separate the foreground (insect objects) from the background of the sticky paper trap image and determine the location of the insect objects. T he features of the detected insect objects are then obtained such as color features (Cho et al., 2007), shape and size features (Barbedo, 2014), and gradient features (Venugoban and Ramanan, 2014). The features are used to classify the insect objects by using feature analysis (Cho et al., 2007) or statistical approaches such as support vector machines (SVM) (Kumar et al., 2010). However, it was sooner realized that these methods have some limitations most especially for more dynamic applications.
In recent years, several works using AI for detecting and identifying the insect objects became more popular due to its adaptability and accuracy. In the past, our presented system used color segmentation for detecting the insect objects (Rustia and Lin, 2017). Unfortunately, using color segmentation was not always adaptive of the lighting condition of the captured images from different locations, thus making the detection process sometimes inaccurate. However, using deep learning based object detection, the detection rate of our algorithm was remarkably improved as it can accurately detect the insect objects with around 97% detection rate. The deep learning based object detection we used is based on Tiny-YOLOv3, a smaller version of one of the most famous object detection architectures – YOLOv3 (Redmon and Farhadi, 2018). In deep learning based object detection, a model is trained to detect target objects from an image based on manually annotated training input images. The trained model performs convolutional operations throughout the image that can automatically extract the features of the target objects. Once the features of the objects are obtained, location of the objects are determined based on the detection probabilities.
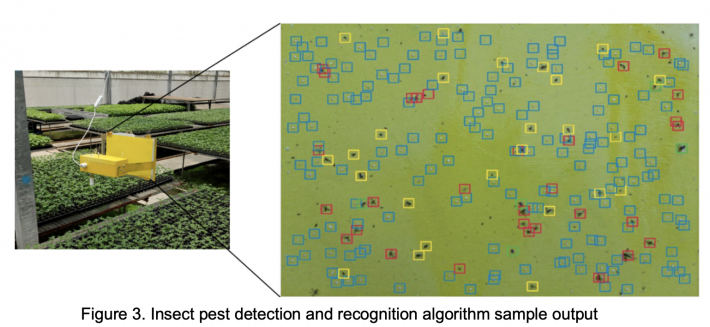
After detecting the objects, image classification by convolutional neural network (CNN) is used to categorize the objects according to the defined classes. Similar to object detection, CNN also automatically extract features from the input images and use it for classification. This include features that may not be easily discovered by applying traditional image processing methods, thus making the model more intelligent. Through CNN, the detected objects are first classified into insect or non-insect. Classifying the objects in this way reduces the noise caused by non-insect objects stuck on the sticky paper traps such as dirt, leaves, etc. Once the objects are confirmed to be insect objects, they are classified according to four types: fly, gnat, thrips, and whitefly, with an F1-score of 93%. The four insect types are some of the major insect pests inside the greenhouses that need to be monitored. Among the four types, the thrips and whiteflies are particularly most harmful since they can easily transmit plant diseases that may easily infect an entire farm (Ekman et al., 2014). A sample output of the insect pest detection and recognition algorithm is shown in Figure 3.
From the insect count data obtained using the insect pest detection and recognition algorithm, the data are automatically analyzed and prepared before sharing to the farmers. Through data analysis, the data are transformed into more meaningful information such as alarms rather than showing only the raw data to the farmers. This enables farmers to easily understand their data in a faster and simpler manner. Some of the data analytics performed in the website and mobile APP are shown in Figures 4a and 4b.
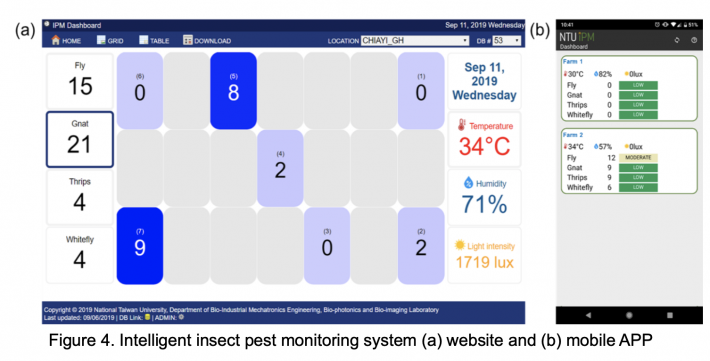
The sample screenshot of the website in Figure 4a shows one of the functions of the insect pest monitoring system, insect pest hotspot detection. By using the website grid view, the approximate location of each node in the farm are displayed and the number of insect counts are shown in different shades to determine the hotspots. In the case of the screenshot shown in Figure 4a, the gnat insect counts are shown in different node locations with the hotspots shaded using dark blue while the other locations are shaded using light blue. This can be used by the farmers to plan their pesticide application more efficiently by spraying more dosage of pesticide on the hotspots while the other locations may even be opted out.
Another method is to use the insect count for giving a warning to the farmers when the insect counts are noticeably irregular based on data-driven warning models. The warning models come from the relative frequency distributions from the collected increase in insect pest count per day. Using the models, the distributions can be divided into different levels by clustering. As a basic approach, k-means clustering was used to cluster the data into 4 levels namely, normal, moderate, high, and severe. The sample derived warning models of the four different insect types of a greenhouse are shown in Figure 5.
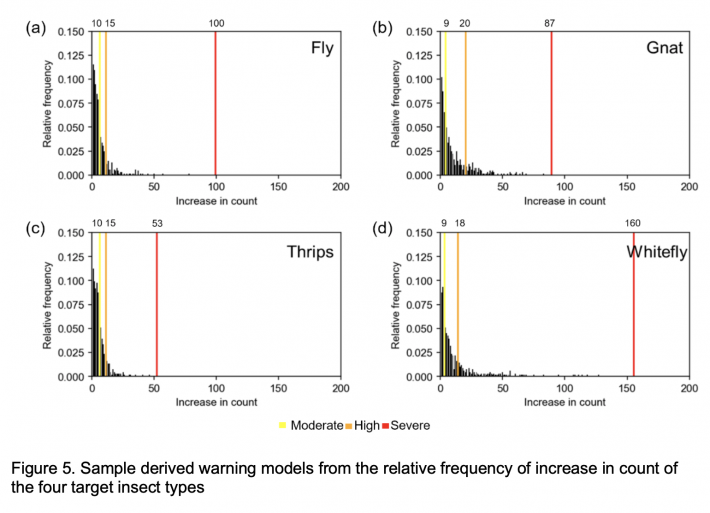
The sample derived warning model in Figure 5a show that a “moderate” alarm can be sent out whenever the number of flies detected in one day is more than 10 and less than 15, while the “moderate” alarm for gnat ranges from 9 to 20 as shown in Figure 5b. The alarms for different insects are determined based on the historical data collected. The data analysis can extract information and make it more understandable to the farmers for further operation management in the greenhouse if needed.
The presented intelligent insect pest monitoring system demonstrated how AI, IoT and data analytics work hand-in-hand to produce more meaningful results that can be useful to the farmers. In this application, AIoT played a vital role in providing a technique for classifying the insect pests on the sticky paper traps in a more reliable and systematic way. The system, however, is not limited to insect identification, hotspot detection and alarm detection but also for research applications such as insect biological modelling (Rustia and Lin, 2019) or even for forecasting (Lu et al., 2019; Azfar et al., 2015; Cai et al., 2019).
Dairy cow feeding and drinking behavior monitoring system
Besides insect pest monitoring, AIoT can also be applied to monitoring livestock such as dairy cows. Unlike insects, there are other behavior of dairy cows that can be monitored such as feeding, drinking, lying, and estrous behaviors. One of the methods for dairy cow monitoring is by the use of wearable sensors. Some of the wearable sensors include ear tags (Rahman et al., 2018; Pereira et al., 2018) or collar tags (Andonovic et al., 2009). However, using such devices may affect the natural behavior of the dairy cows and might also face technical issues such as battery replacement or wearing out. An alternative approach is to use non-contact devices such as cameras. Unlike wearable sensors, cameras may monitor multiple dairy cows at the same time, thus reducing the cost of the system (Cangar et al., 2008). Moreover, there are possibly more information that can be obtained from the images as compared to the sensor-based methods. The information that can be extracted using an environmental and imaging system for dairy cow monitoring are demonstrated.
Some of the factors affecting the behavior of dairy cows are ambient temperature and humidity. Like humans, studies show that dairy cows also experience stress on uncomfortable environments (Herbut et al., 2018). Based on these facts, the system we developed aims to monitor how the dairy cows behave when under heat stress. The developed system is composed of several wireless imaging and environmental sensing nodes. Each node includes an embedded system, temperature and humidity sensor, and a camera. The node has two variants: one for drinking behavior monitoring and another for feeding behavior. The drinking behavior monitoring nodes are installed on the dairy cow farm ceilings facing the drinking troughs while the feeding behavior monitoring nodes are placed in front of the feeding fences. All the nodes are connected through a Wi-Fi router for sending the data to our remote server via internet.
The drinking behavior monitoring node records videos and analyzes the video to determine the drinking frequency of the dairy cows. An algorithm was developed that aims to detect the dairy cow heads and to record the time the dairy cow reaches the drinking troughs and the time they go away from the troughs, considering it as drinking activity. At first, our system used traditional image processing algorithm to detect the dairy cows by background segmentation (Tsai et al., 2018). As the algorithm was tested, it had a high accuracy in most cases but had some minor issues due to difference in lighting condition and variation in the color of the dairy cows depending on the location. But as the system was upgraded to use a deep learning approach for detection with YOLOv3, it shows that it is more reliable as it can adapt accordingly. The drinking behavior monitoring node and a sample result of the drinking behavior detection algorithm is shown in Figures 6a and 6b, respectively.
On the other hand, the feeding behavior monitoring node aims to detect the dairy cow heads after passing through the feeding fences and leaving the fences, indicating a feeding behavior. Similar to the drinking behavior detection algorithm, an image processing based algorithm is also tested. The algorithm made use of Adaboost-cascade algorithm for detecting the dairy cow heads with a detection rate up to 87% (Kuan et al., 2018). Instead of using the said algorithm, a deep learning based approach was used using Tiny YOLOv2 that has a detection rate up to 97%, which has a big improvement compared to the previously mentioned approach (Kuan et al., 2019). Other than that, a dairy cow face identification model was also trained to identify the dairy cow faces. Currently, the model can identify up to 19 classes of dairy cow faces with an F1-score of 97%. The feeding behavior monitoring node, along with a sample output image of the algorithm is shown in Figures 6c and 6d, respectively.

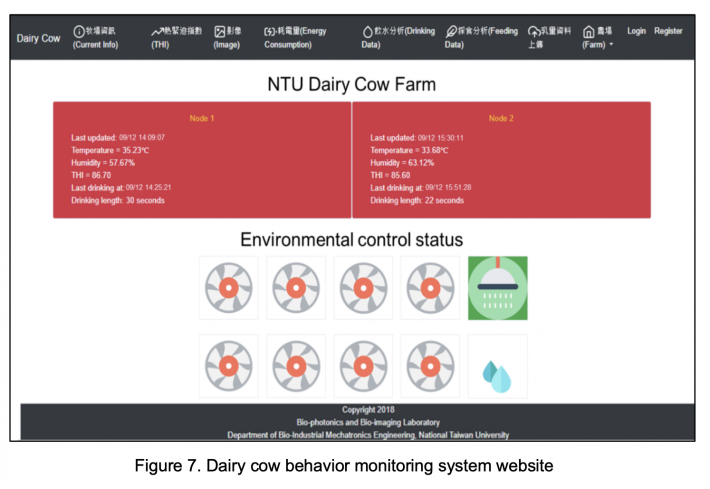
The information from the two type of nodes are all uploaded into a website that is accessible by the dairy cow farm owners. As the temperature and humidity data are collected, it is converted into an index called temperature-humidity index (THI). THI is an index that can be used to describe how the combination of temperature and humidity feels to the human body or to animals (Polsky and von Keyserlingk, 2017). It has been shown that THI affects the milk production of the dairy cows, most especially in extreme levels. Other than THI, the drinking length are shown in the website in real-time. Additionally, the status of the environmental control devices such as fan, sprinkler, and mist nozzles are also displayed whether they are turned on or not. A screenshot of the website is shown in Figure 7.
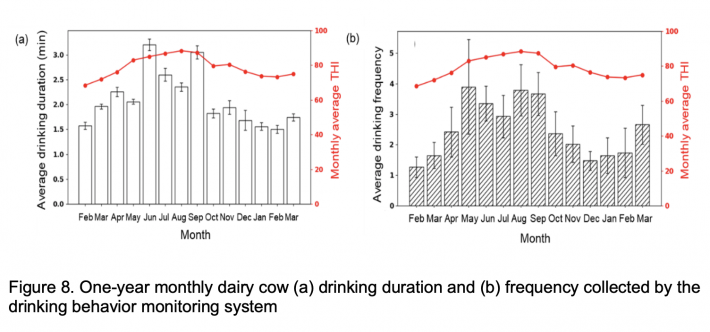
Based on a one-year period of data, it was confirmed that THI had some effect to the drinking behavior of the dairy cows as shown in Figure 8. As the season changed throughout the year, it was observed during the summer season (around May to August in Taiwan) that the drinking length of the dairy cows became longer and the drinking frequency increased as well. The presented data can be used by the dairy cow farm owners to plan and have better environmental control strategies during the summer season and maintain productivity of the dairy cows.
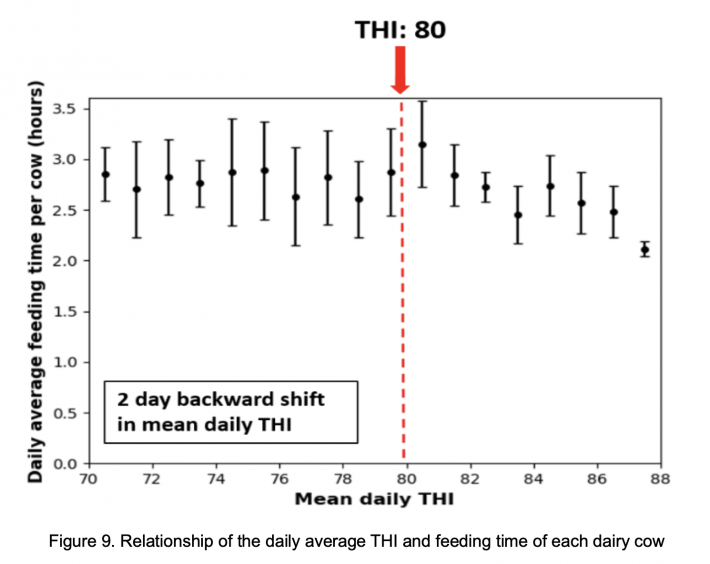
The effects of THI to the behavior of the dairy cows were also reflected on the feeding behavior, as shown in Figure 9. It was found that there is a relationship between the THI and feeding behavior of the dairy cows in which the dairy cows eat less if the THI level is above 80, as seen in Figure 9. This information can be used to precisely control the THI level to ensure that the dairy cows are not too stressed due to hot enviroment. It has been observed that at lower THI levels, the average milk production was relatively higher than those of higher THI levels. This demonstrates that the THI condition inside the dairy cow farms have some effect to the health and productivity of the dairy cows.
The dairy cow monitoring system shows how AIoT can be used for collecting potentially useful data that can be used as indices to know the possible productivity of the dairy cows depending on THI. Similar to the insect pest monitoring system, alarms and other functions can be incorporated to the system for dairy cow health or milk production management, most especially as the dairy cow face identification algorithm is utilized. As compared to using wearable sensors, the AIoT based monitoring system was proven to show a lot of potential.
CONCLUSION
From the examples provided, the potential of AIoT in smart agriculture was demonstrated. AIoT was able to upgrade past agricultural systems into smarter systems and increase its reliability. It was particularly shown that AIoT can improve smart systems by migrating from traditional methods, such as image processing, into more advanced AI methods like deep learning. Data analytics also played a vital role in delivering the data to the farmers in a more understandable and simpler manner. However, AIoT should not be limited to the examples provided since there are still a lot more applications of AIoT yet to be discovered and developed. AIoT may also be applied in addressing problems that were not solvable in the past. With the collaboration of researchers, engineers, farmers, and government agencies, AIoT will be able to overcome the barriers of implementing smarter agriculture.
REFERENCES
Andonovic, I., Michie, C., Gilroy, M., Goh, H. G., Kwong, K. H., Sasloglou, K., and Wu, T. 2009. Wireless sensor networks for cattle health monitoring. Paper presented at the 2009 International Conference on ICT Innovations, Berlin, Heidelberg.
Azfar, S., Nadeem, A., and Basic, A. 2015. Pest detection and control techniques using wireless sensor network: A review. Journal of Entomology and Zoology Studies 3(2): 92-99.
Barbedo, J. G. A. 2014. Using digital image processing for counting whiteflies on soybean leaves. Journal of Asia-Pacific Entomology 17(4), 685-694.
Cai, J., Xiao, D., Lv, L., and Ye, Y. 2019. An early warning model for vegetable pests based on multidimensional data. Computers and Electronics in Agriculture, 156, 217-226.
Cangar, Ö., Leroy, T., Guarino, M., Vranken, E., Fallon, R., Lenehan, J., ... and Berckmans, D. 2008. Automatic real-time monitoring of locomotion and posture behaviour of pregnant cows prior to calving using online image analysis. Computer and Electronics in Agriculture, 64(1), 53-60.
Cho, J., Choi, J., Qiao, M., Ji, C. W., Kim, H. Y., Uhm, K. B., and Chon, T. S. 2007. Automatic identification of whiteflies, aphids and thrips in greenhouse based on image analysis. International Journal of Mathematics and Computers in Simulation 1, 46-53.
Ekman J., Tesoriero, L., and Grigg, S. 2014. Pests, diseases and disorders of brassica vegetables: A field identification guide. Horticultural Australia, New South Wales, Australia.
Espinoza, K., Valera, D. L., Torres, J. A., López, A., and Molina-Aiz, F. D. 2016. Combination of image processing and artificial neural networks as a novel approach for the identification of Bemisia tabaci and Frankliniella occidentalis on sticky traps in greenhouse agriculture. Computer and Electronics in Agriculture 127(C), 495-505.
Food and Agriculture Organization of the United Nations. 2009. How to feed the world in 2050. (http://www.fao.org/fileadmin/templates/wsfs/docs/expert_paper/How_to_Fee... Accessed 10September2019).
Herbut, P., Angrecka, S., and Walczak, J. 2018. Environmental parameters to assessing of heat stress in dairy cattle—a review. International Journal of Biometeorology 62(12): 2089-2097.
Kuan, C.-Y., Tsai, Y. C., Hsu, J. T., Ding, S.T., and Lin, T.-T. 2018. An imaging system for monitoring the feeding behavior of dairy cows. Paper presented at the 9th International Symposium on Machinery and Mechatronics for Agriculture and Biosystems Engineering (ISMAB), Jeju, Korea.
Kuan, C.-Y., Tsai, Y. C., Hsu, J. T., Ding, S.T., and Lin, T.-T. 2019. An imaging system based on deep learning for monitoring the feeding behavior of dairy cows. Paper presented at the 2019 ASABE Annual International Meeting, Boston, USA.
Kumar, R., Martin, V., and Moisan, S. 2010. Robust insect classification applied to real Time greenhouse infestation monitoring. Paper presented at the 20th International Conference on Pattern Recognition on Visual Observation and Analysis of Animal and Insect Behavior Workshop, Istanbul, Turkey.
Lamichhane, J. R., Aubertot, J.-N., Begg, G., Birch, A. N. E., Boonekamp, P., Dachbrodt-Saaydeh, S., . . . and Messéan, A. 2016. Networking of integrated pest management: A powerful approach to address common challenges in agriculture. Crop Protection, 89, 139-151.
Lu, C.-Y., Rustia, D. J. A., and Lin, T.-T. 2019. A greenhouse whitefly early warning method based on autoregressive recurrent neural network. Accepted paper at the 2019 Asia Pacific Federation for Information Technology in Agriculture (APFITA) Conference, Taichung, Taiwan.
Pereira, G. M., Heins, B. J., and Endres, M. I. 2018. Technical note: Validation of an ear-tag accelerometer sensor to determine rumination, eating, and activity behaviors of grazing dairy cattle. Journal of Dairy Science 101(3): 2492-2495.
Polsky, L., and von Keyserlingk, M. A. G. 2017. Invited review: Effects of heat stress on dairy cattle welfare. Journal of Dairy Science, 100(11), 8645-8657.
Redmon, J., and Farhadi, A. 2018. YOLOv3: An incremental improvement. arXiv:1804.02767.
Rustia, D. J. A., and Lin, T.-T. 2017. An IoT-based Wireless Imaging and Sensor Node System for Remote Greenhouse Pest Monitoring. Chemical Engineering Transactions 58.
Rustia, D. J. A., and Lin, T.-T. 2019. Stochastic models for greenhouse whitefly flight behavior based on wireless image monitoring system measurements. Pertanika Journal of Science and Technology, 27(S1), 81-93.
Tsai, Y. C., Cheng, C. Y., Hsu, C. T., Ding, S.T., and Lin, T.-T. 2018. An embedded imaging system for dairy cows drinking behavior monitoring. Paper presented at the 2018 CIGR International Conference on Agricultural Engineering. Antalya, Turkey.
Venugoban, K., and Ramanan, A. 2014. Image classification of paddy field insect pests using gradient-based features. International Journal of Machine Learning and Computing 4(1), 1-5.
Xia, C., Chon, T.-S., Ren, Z., and Lee, J.-M. 2015. Automatic identification and counting of small size pests in greenhouse conditions with low computational cost. Ecological Informatics 29(Part 2), 139-146.
Date submitted: October 29, 2019
Reviewed, edited and uploaded: November 29, 2019 |

Trends of AIoT Application in Smart Agriculture
ABSTRACT
The rapid development of AI and IoT devices and infrastructure has formed the convergence of the two transformative technologies into AIoT (Artificial Intelligence of Things). Although AIoT is still at a growing stage, its applications in many areas are already boosting enormous business potentials. This emerging technology also creates immense potential in solving problems as well as changing the shape of agriculture. AIoT utilizes modern technologies including, but not limited to, smart sensors, image processing, cloud computing, data analytics, network communication, and artificial intelligence to make agricultural production, management, and marketing more autonomous and efficient. The delivery of information to farmers, farm managers, or consumers becomes more instantaneous and easier to access. Thus, the applications of AIoT will help not only in increasing the quantity and quality of food production but also in enhancing the efficiency of agricultural operations such as pest and plant disease management. While AIoT will become one of the main driving forces for smart agriculture, there are still some barriers need to be overcome such as the cost factors and the adaptation to the traditional agricultural practice. In this paper, we will discuss several promising AIoT applications in agriculture such as insect pest monitoring and forecasting, greenhouse management, livestock monitoring, etc. Through the application examples we can have a deeper look and understanding of the future impact of AIoT on modern agriculture.
Keywords: Deep learning, wireless sensor networks, insect pest monitoring, dairy cow monitoring, precision agriculture
INTRODUCTION
Due to the rise in population all over the world, it is predicted that the world should produce 70% more food by 2050 (Food and Agriculture Organization of the United Nations, 2009). In addition, there are also issues in food waste management, climate change, and scarcity in natural resources that should be addressed. One of the solutions to these problems is smart agriculture. By utilizing modern and innovative technology, the gap between productivity and sustainability can be reduced. Smart agriculture encourages farmers to slowly adapt into more systematic and data-driven agricultural techniques.
Just recently, a new concept called Artificial Intelligence of Things (AIoT) has been introduced to assist in accelerating the development of smart farming. It aims to combine the power of connectivity from Internet of Things (IoT) and the data-driven knowledge obtained from Artificial Intelligence (AI). Typically, an IoT system involves the use of wireless sensor networks (WSN) for collecting data seamlessly (Lamhichhane et al., 2016; Andonovic et al., 2009). Wireless sensor nodes are deployed in different assigned locations for gathering spatial and temporal data. As IoT is combined with AI, the data can be further utilized by applying AI techniques such as machine learning and deep learning for performing data interpretation, automatic image analysis, data forecasting and many more. This can be used to provide more than data but also recommend possible solutions to problems that farmers may encounter.
In this paper, examples are introduced to show the potential of integrating AI and IoT to develop more intelligent systems for agriculture. The presented examples are some of our undergoing projects in AIoT for smart agriculture that can be used as a reference on how to further improve current agricultural systems.
AIOT TECHNOLOGY AND ITS APPLICATIONS
Nowadays, AIoT systems are seen emerging and aiming to solve problems that were not solvable until AI and IoT were made more available. For instance, wireless imaging has not been possible until embedded systems with higher computing capabilities were released. By having more commercially available embedded systems, more computationally intensive processes can be performed unlike when typical microcontrollers are used. Thus, more advanced applications such as developing wireless imaging sensor networks (WISN) are made more possible. In this section, two examples demonstrating the capabilities of AIoT systems using integrated imaging and environmental sensing are presented.
Intelligent insect pest monitoring system
One of the latest applications of AIoT in agriculture is intelligent insect pest monitoring. By keeping track of the population density of the insect pests in ones’ farm, data-driven strategies can be developed for implementing integrated pest management (IPM). To fulfill this goal, we developed an insect pest monitoring system composed of wireless imaging and environmental sensor nodes. Each node includes an embedded system, RGB camera, temperature-humidity sensor, and light intensity sensor. A sticky paper trap is held with a fixed distance in front of each node and the image of the sticky paper trap is captured by the camera. The sticky paper trap images, together with the environmental data, are sent to the remote server via internet for remote processing. The nodes are hung inside the greenhouses depending on the suspected insect pest hotspots, as suggested by the farm owners. The architecture of the system is shown in Figure 1.
The system described in Figure 1 is currently installed in seven greenhouses and one outdoor orchard in Taiwan. The installation sites are locations that are in need of an insect pest monitoring system to conduct integrated pest management for preventing crop damages. The approximate locations of the installation sites of the system in Taiwan are shown in Figure 2.
In analyzing the sticky paper trap images, an insect pest detection and recognition algorithm is used. Before the emergence of AI in image processing, most algorithms for insect pest detection and recognition use traditional image processing techniques for analyzing the sticky paper trap images. Ever since, most works use a method in image processing called color segmentation (Espinoza et al., 2016; Cho et al., 2007; Xia et al., 2014) for detecting the insect objects from the images. Color segmentation aims to separate the foreground (insect objects) from the background of the sticky paper trap image and determine the location of the insect objects. T he features of the detected insect objects are then obtained such as color features (Cho et al., 2007), shape and size features (Barbedo, 2014), and gradient features (Venugoban and Ramanan, 2014). The features are used to classify the insect objects by using feature analysis (Cho et al., 2007) or statistical approaches such as support vector machines (SVM) (Kumar et al., 2010). However, it was sooner realized that these methods have some limitations most especially for more dynamic applications.
In recent years, several works using AI for detecting and identifying the insect objects became more popular due to its adaptability and accuracy. In the past, our presented system used color segmentation for detecting the insect objects (Rustia and Lin, 2017). Unfortunately, using color segmentation was not always adaptive of the lighting condition of the captured images from different locations, thus making the detection process sometimes inaccurate. However, using deep learning based object detection, the detection rate of our algorithm was remarkably improved as it can accurately detect the insect objects with around 97% detection rate. The deep learning based object detection we used is based on Tiny-YOLOv3, a smaller version of one of the most famous object detection architectures – YOLOv3 (Redmon and Farhadi, 2018). In deep learning based object detection, a model is trained to detect target objects from an image based on manually annotated training input images. The trained model performs convolutional operations throughout the image that can automatically extract the features of the target objects. Once the features of the objects are obtained, location of the objects are determined based on the detection probabilities.
After detecting the objects, image classification by convolutional neural network (CNN) is used to categorize the objects according to the defined classes. Similar to object detection, CNN also automatically extract features from the input images and use it for classification. This include features that may not be easily discovered by applying traditional image processing methods, thus making the model more intelligent. Through CNN, the detected objects are first classified into insect or non-insect. Classifying the objects in this way reduces the noise caused by non-insect objects stuck on the sticky paper traps such as dirt, leaves, etc. Once the objects are confirmed to be insect objects, they are classified according to four types: fly, gnat, thrips, and whitefly, with an F1-score of 93%. The four insect types are some of the major insect pests inside the greenhouses that need to be monitored. Among the four types, the thrips and whiteflies are particularly most harmful since they can easily transmit plant diseases that may easily infect an entire farm (Ekman et al., 2014). A sample output of the insect pest detection and recognition algorithm is shown in Figure 3.
From the insect count data obtained using the insect pest detection and recognition algorithm, the data are automatically analyzed and prepared before sharing to the farmers. Through data analysis, the data are transformed into more meaningful information such as alarms rather than showing only the raw data to the farmers. This enables farmers to easily understand their data in a faster and simpler manner. Some of the data analytics performed in the website and mobile APP are shown in Figures 4a and 4b.
The sample screenshot of the website in Figure 4a shows one of the functions of the insect pest monitoring system, insect pest hotspot detection. By using the website grid view, the approximate location of each node in the farm are displayed and the number of insect counts are shown in different shades to determine the hotspots. In the case of the screenshot shown in Figure 4a, the gnat insect counts are shown in different node locations with the hotspots shaded using dark blue while the other locations are shaded using light blue. This can be used by the farmers to plan their pesticide application more efficiently by spraying more dosage of pesticide on the hotspots while the other locations may even be opted out.
Another method is to use the insect count for giving a warning to the farmers when the insect counts are noticeably irregular based on data-driven warning models. The warning models come from the relative frequency distributions from the collected increase in insect pest count per day. Using the models, the distributions can be divided into different levels by clustering. As a basic approach, k-means clustering was used to cluster the data into 4 levels namely, normal, moderate, high, and severe. The sample derived warning models of the four different insect types of a greenhouse are shown in Figure 5.
The sample derived warning model in Figure 5a show that a “moderate” alarm can be sent out whenever the number of flies detected in one day is more than 10 and less than 15, while the “moderate” alarm for gnat ranges from 9 to 20 as shown in Figure 5b. The alarms for different insects are determined based on the historical data collected. The data analysis can extract information and make it more understandable to the farmers for further operation management in the greenhouse if needed.
The presented intelligent insect pest monitoring system demonstrated how AI, IoT and data analytics work hand-in-hand to produce more meaningful results that can be useful to the farmers. In this application, AIoT played a vital role in providing a technique for classifying the insect pests on the sticky paper traps in a more reliable and systematic way. The system, however, is not limited to insect identification, hotspot detection and alarm detection but also for research applications such as insect biological modelling (Rustia and Lin, 2019) or even for forecasting (Lu et al., 2019; Azfar et al., 2015; Cai et al., 2019).
Dairy cow feeding and drinking behavior monitoring system
Besides insect pest monitoring, AIoT can also be applied to monitoring livestock such as dairy cows. Unlike insects, there are other behavior of dairy cows that can be monitored such as feeding, drinking, lying, and estrous behaviors. One of the methods for dairy cow monitoring is by the use of wearable sensors. Some of the wearable sensors include ear tags (Rahman et al., 2018; Pereira et al., 2018) or collar tags (Andonovic et al., 2009). However, using such devices may affect the natural behavior of the dairy cows and might also face technical issues such as battery replacement or wearing out. An alternative approach is to use non-contact devices such as cameras. Unlike wearable sensors, cameras may monitor multiple dairy cows at the same time, thus reducing the cost of the system (Cangar et al., 2008). Moreover, there are possibly more information that can be obtained from the images as compared to the sensor-based methods. The information that can be extracted using an environmental and imaging system for dairy cow monitoring are demonstrated.
Some of the factors affecting the behavior of dairy cows are ambient temperature and humidity. Like humans, studies show that dairy cows also experience stress on uncomfortable environments (Herbut et al., 2018). Based on these facts, the system we developed aims to monitor how the dairy cows behave when under heat stress. The developed system is composed of several wireless imaging and environmental sensing nodes. Each node includes an embedded system, temperature and humidity sensor, and a camera. The node has two variants: one for drinking behavior monitoring and another for feeding behavior. The drinking behavior monitoring nodes are installed on the dairy cow farm ceilings facing the drinking troughs while the feeding behavior monitoring nodes are placed in front of the feeding fences. All the nodes are connected through a Wi-Fi router for sending the data to our remote server via internet.
The drinking behavior monitoring node records videos and analyzes the video to determine the drinking frequency of the dairy cows. An algorithm was developed that aims to detect the dairy cow heads and to record the time the dairy cow reaches the drinking troughs and the time they go away from the troughs, considering it as drinking activity. At first, our system used traditional image processing algorithm to detect the dairy cows by background segmentation (Tsai et al., 2018). As the algorithm was tested, it had a high accuracy in most cases but had some minor issues due to difference in lighting condition and variation in the color of the dairy cows depending on the location. But as the system was upgraded to use a deep learning approach for detection with YOLOv3, it shows that it is more reliable as it can adapt accordingly. The drinking behavior monitoring node and a sample result of the drinking behavior detection algorithm is shown in Figures 6a and 6b, respectively.
On the other hand, the feeding behavior monitoring node aims to detect the dairy cow heads after passing through the feeding fences and leaving the fences, indicating a feeding behavior. Similar to the drinking behavior detection algorithm, an image processing based algorithm is also tested. The algorithm made use of Adaboost-cascade algorithm for detecting the dairy cow heads with a detection rate up to 87% (Kuan et al., 2018). Instead of using the said algorithm, a deep learning based approach was used using Tiny YOLOv2 that has a detection rate up to 97%, which has a big improvement compared to the previously mentioned approach (Kuan et al., 2019). Other than that, a dairy cow face identification model was also trained to identify the dairy cow faces. Currently, the model can identify up to 19 classes of dairy cow faces with an F1-score of 97%. The feeding behavior monitoring node, along with a sample output image of the algorithm is shown in Figures 6c and 6d, respectively.
The information from the two type of nodes are all uploaded into a website that is accessible by the dairy cow farm owners. As the temperature and humidity data are collected, it is converted into an index called temperature-humidity index (THI). THI is an index that can be used to describe how the combination of temperature and humidity feels to the human body or to animals (Polsky and von Keyserlingk, 2017). It has been shown that THI affects the milk production of the dairy cows, most especially in extreme levels. Other than THI, the drinking length are shown in the website in real-time. Additionally, the status of the environmental control devices such as fan, sprinkler, and mist nozzles are also displayed whether they are turned on or not. A screenshot of the website is shown in Figure 7.
Based on a one-year period of data, it was confirmed that THI had some effect to the drinking behavior of the dairy cows as shown in Figure 8. As the season changed throughout the year, it was observed during the summer season (around May to August in Taiwan) that the drinking length of the dairy cows became longer and the drinking frequency increased as well. The presented data can be used by the dairy cow farm owners to plan and have better environmental control strategies during the summer season and maintain productivity of the dairy cows.
The effects of THI to the behavior of the dairy cows were also reflected on the feeding behavior, as shown in Figure 9. It was found that there is a relationship between the THI and feeding behavior of the dairy cows in which the dairy cows eat less if the THI level is above 80, as seen in Figure 9. This information can be used to precisely control the THI level to ensure that the dairy cows are not too stressed due to hot enviroment. It has been observed that at lower THI levels, the average milk production was relatively higher than those of higher THI levels. This demonstrates that the THI condition inside the dairy cow farms have some effect to the health and productivity of the dairy cows.
The dairy cow monitoring system shows how AIoT can be used for collecting potentially useful data that can be used as indices to know the possible productivity of the dairy cows depending on THI. Similar to the insect pest monitoring system, alarms and other functions can be incorporated to the system for dairy cow health or milk production management, most especially as the dairy cow face identification algorithm is utilized. As compared to using wearable sensors, the AIoT based monitoring system was proven to show a lot of potential.
CONCLUSION
From the examples provided, the potential of AIoT in smart agriculture was demonstrated. AIoT was able to upgrade past agricultural systems into smarter systems and increase its reliability. It was particularly shown that AIoT can improve smart systems by migrating from traditional methods, such as image processing, into more advanced AI methods like deep learning. Data analytics also played a vital role in delivering the data to the farmers in a more understandable and simpler manner. However, AIoT should not be limited to the examples provided since there are still a lot more applications of AIoT yet to be discovered and developed. AIoT may also be applied in addressing problems that were not solvable in the past. With the collaboration of researchers, engineers, farmers, and government agencies, AIoT will be able to overcome the barriers of implementing smarter agriculture.
REFERENCES
Andonovic, I., Michie, C., Gilroy, M., Goh, H. G., Kwong, K. H., Sasloglou, K., and Wu, T. 2009. Wireless sensor networks for cattle health monitoring. Paper presented at the 2009 International Conference on ICT Innovations, Berlin, Heidelberg.
Azfar, S., Nadeem, A., and Basic, A. 2015. Pest detection and control techniques using wireless sensor network: A review. Journal of Entomology and Zoology Studies 3(2): 92-99.
Barbedo, J. G. A. 2014. Using digital image processing for counting whiteflies on soybean leaves. Journal of Asia-Pacific Entomology 17(4), 685-694.
Cai, J., Xiao, D., Lv, L., and Ye, Y. 2019. An early warning model for vegetable pests based on multidimensional data. Computers and Electronics in Agriculture, 156, 217-226.
Cangar, Ö., Leroy, T., Guarino, M., Vranken, E., Fallon, R., Lenehan, J., ... and Berckmans, D. 2008. Automatic real-time monitoring of locomotion and posture behaviour of pregnant cows prior to calving using online image analysis. Computer and Electronics in Agriculture, 64(1), 53-60.
Cho, J., Choi, J., Qiao, M., Ji, C. W., Kim, H. Y., Uhm, K. B., and Chon, T. S. 2007. Automatic identification of whiteflies, aphids and thrips in greenhouse based on image analysis. International Journal of Mathematics and Computers in Simulation 1, 46-53.
Ekman J., Tesoriero, L., and Grigg, S. 2014. Pests, diseases and disorders of brassica vegetables: A field identification guide. Horticultural Australia, New South Wales, Australia.
Espinoza, K., Valera, D. L., Torres, J. A., López, A., and Molina-Aiz, F. D. 2016. Combination of image processing and artificial neural networks as a novel approach for the identification of Bemisia tabaci and Frankliniella occidentalis on sticky traps in greenhouse agriculture. Computer and Electronics in Agriculture 127(C), 495-505.
Food and Agriculture Organization of the United Nations. 2009. How to feed the world in 2050. (http://www.fao.org/fileadmin/templates/wsfs/docs/expert_paper/How_to_Fee... Accessed 10September2019).
Herbut, P., Angrecka, S., and Walczak, J. 2018. Environmental parameters to assessing of heat stress in dairy cattle—a review. International Journal of Biometeorology 62(12): 2089-2097.
Kuan, C.-Y., Tsai, Y. C., Hsu, J. T., Ding, S.T., and Lin, T.-T. 2018. An imaging system for monitoring the feeding behavior of dairy cows. Paper presented at the 9th International Symposium on Machinery and Mechatronics for Agriculture and Biosystems Engineering (ISMAB), Jeju, Korea.
Kuan, C.-Y., Tsai, Y. C., Hsu, J. T., Ding, S.T., and Lin, T.-T. 2019. An imaging system based on deep learning for monitoring the feeding behavior of dairy cows. Paper presented at the 2019 ASABE Annual International Meeting, Boston, USA.
Kumar, R., Martin, V., and Moisan, S. 2010. Robust insect classification applied to real Time greenhouse infestation monitoring. Paper presented at the 20th International Conference on Pattern Recognition on Visual Observation and Analysis of Animal and Insect Behavior Workshop, Istanbul, Turkey.
Lamichhane, J. R., Aubertot, J.-N., Begg, G., Birch, A. N. E., Boonekamp, P., Dachbrodt-Saaydeh, S., . . . and Messéan, A. 2016. Networking of integrated pest management: A powerful approach to address common challenges in agriculture. Crop Protection, 89, 139-151.
Lu, C.-Y., Rustia, D. J. A., and Lin, T.-T. 2019. A greenhouse whitefly early warning method based on autoregressive recurrent neural network. Accepted paper at the 2019 Asia Pacific Federation for Information Technology in Agriculture (APFITA) Conference, Taichung, Taiwan.
Pereira, G. M., Heins, B. J., and Endres, M. I. 2018. Technical note: Validation of an ear-tag accelerometer sensor to determine rumination, eating, and activity behaviors of grazing dairy cattle. Journal of Dairy Science 101(3): 2492-2495.
Polsky, L., and von Keyserlingk, M. A. G. 2017. Invited review: Effects of heat stress on dairy cattle welfare. Journal of Dairy Science, 100(11), 8645-8657.
Redmon, J., and Farhadi, A. 2018. YOLOv3: An incremental improvement. arXiv:1804.02767.
Rustia, D. J. A., and Lin, T.-T. 2017. An IoT-based Wireless Imaging and Sensor Node System for Remote Greenhouse Pest Monitoring. Chemical Engineering Transactions 58.
Rustia, D. J. A., and Lin, T.-T. 2019. Stochastic models for greenhouse whitefly flight behavior based on wireless image monitoring system measurements. Pertanika Journal of Science and Technology, 27(S1), 81-93.
Tsai, Y. C., Cheng, C. Y., Hsu, C. T., Ding, S.T., and Lin, T.-T. 2018. An embedded imaging system for dairy cows drinking behavior monitoring. Paper presented at the 2018 CIGR International Conference on Agricultural Engineering. Antalya, Turkey.
Venugoban, K., and Ramanan, A. 2014. Image classification of paddy field insect pests using gradient-based features. International Journal of Machine Learning and Computing 4(1), 1-5.
Xia, C., Chon, T.-S., Ren, Z., and Lee, J.-M. 2015. Automatic identification and counting of small size pests in greenhouse conditions with low computational cost. Ecological Informatics 29(Part 2), 139-146.
Reviewed, edited and uploaded: November 29, 2019