Abstract
Rice is not only a staple food but also an important exported cereal in Myanmar. Taking spaces in international markets as well as maintaining sufficient domestic rice consumption becomes an important issue for Myanmar’s economy. The economic importance of rice industry is political pressure for successive government in Myanmar. Particularly after complete liberalization of rice export in 2011, as one of the major global rice exporters, export potential for rice is essentially needed to know for policy makers as well as rice industry stakeholders in Myanmar. Paw San, also known as “Pearl rice”, is a premium quality fragrant rice of Myanmar which has gained the reputation of being the world’s best rice in 2011 and is considered a market driven export rice. This study investigated the export potential of Paw San varieties by reviewing the findings of comparative advantage studies which were carried out in selected townships of Ayeyawaddy and Sagaing Regions during 2008 and 2013. The findings of the case study interview with Paw San grower from Khin Oo Township, Sagaing Region in 2018 was also included in this study. The findings showed that Paw San varieties could generate pleasurable income for Myanmar farmers under existing production technologies and government interventions both in the past and present. Paw San varieties had favorable comparative advantages in all study areas and higher comparative advantages could be seen at the high level of world prices, high yield levels and high exchange rates for Paw San production and marketing under different scenarios. Moreover, the findings also indicated that Paw San varieties should be enhanced in terms of reducing explicit and implicit tax or market failure of tradable goods by government in order to increase the economic efficiency of production and export potential in the future.
Keywords: Paw San, Export, Comparative Advantage, Myanmar
Introduction
Rice is not only a main staple food but also one of the most important exported cereals in agrarian based Myanmar. Maintaining sufficient domestic rice consumption as well as taking spaces in international markets becomes the important issue in Myanmar’s economy. Rice has been the focus in the history of Myanmar’s economic development and the economic importance of rice industry is political pressure for successive government. Before World War II, Myanmar was a top rice exporter in the world and exported about 3 million tons annually. Because of stagnation of production since the 1960s and export restriction, Thailand took the place of Myanmar in the export market and Myanmar rice export nearly disappeared in 1970s. The significant yield increased from the mid 1970s to early 1980s was certainly due to implementation of the special high-yielding rice program with the adoption of modern rice varieties and agronomic practices (Hnin Yu Lwin, 2010).
Myanmar has adopted a series of policy reforms to liberalize its economy since the late 1980s. The government introduced the market oriented economic system in 1988 and agricultural policies concentrated to increase production and agricultural exports. Liberalizations of rice marketing were implemented twice in 1987 and 2003 to accelerate a market oriented economy by favoring competitive market price for rice producers and consumers. Abolishing government’s monopolized compulsory marketing quotas of paddy and rice trading and ending the distributed ration system after second liberalization unlocked substantial space for private traders and agribusinesses. Therefore, all citizens were free to participate in the domestic rice trade. Rice export was allowed only when there was surplus, however, the export earnings were to be shared equally between the government and the private companies (since export tax was levied at 10%, the share was 45% each), while the government paid 45% of the export costs that accrued to the private companies in local currency (Okamoto, 2013).
Rice export plan was pulled back again in January 2004 because of uncertain rice surplus and confidence of rice traders reduced by highly volatile rice export policies. The number of rice export companies and export quantities were also fluctuating because of unclear rice export licensing procedure. Rice export gradually declined even after liberalization while Myanmar Agricultural Produce Trading (MAPT) and Ministry of Agriculture and Irrigation (MOAI) were not involved in rice exports apart from allocating the existing stock. Myanmar Economic Corporation (MEC) or Union of Myanmar Economic Holding (UMEHL) became the main players in rice export since 2004 (Wong and Wai, 2013). As a conditional solution to limited access to affordable seeds and other inputs, credit, and extension, the rice specialization companies (RSCs) were established in 2008 and they provided all these support to smallholder farmers. More comprehensive and contract farming initiatives were implemented by RSCs and the government gave priority export license to RSCs as a reward for developing the supply chain.
Since 2011, the country has opened its doors to democratic transformation and government has started ambitious efforts with a major focus on economic reforms. The government abolished the quota system and fully liberalized any registered traders with certified stock level and facilities to apply export license for rice export, thus the access of RSCs’ export priority has been lost. Rice export tax was also reduced from 10% to 2% and agricultural policy liberalization across a broad range of commodities was started while rice sector still requires the export permission. In 2012, the Myanmar Rice Federation (MRF) was formed and is currently performing as the umbrella organization representing the five private sector groups of farmers/paddy producers, millers, traders, fertilizer, seed, pesticide entrepreneurs, and the companies including the RSCs, Myanmar Agribusiness Public Corporation (MAPCO) and exporters in order to develop private public partnership along the rice supply chain.
After completely liberalizing rice export in 2011, rice export reached 1.6 million tons in 2013-2014, the highest export level during the past 40 years. However, the quality and price of Myanmar’s export rice remain lower than the international market even the world demand for high quality fragrant rice has increased. Although the price of fragrant rice is more than that of other normal white rice, the share of fragrant rice exporters in the world market is still small. European Union, Singapore, Hong Kong and most Southeast Asian countries are potential markets for high quality fragrant rice. Myanmar, one of the top global rice exporters as well as producers of many rice varieties, may also have the potential to capture the higher value portions of the world’s fragrant rice market (Phyu Lay Myint and Napasintuwong, 2016).
Paw San, also well known as “Myanmar’s Pearl Rice”, is one of the most recognized high quality fragrant rice varieties in the world. Myanmar Paw San has similar aroma, grain and eating qualities to the world’s famous fragrant rice varieties such as Basmati from India and Pakistan and Jasmine rice from Thailand. Paw San was awarded as the world’s best rice at the Rice Traders’ World Rice Conference in 2011 and it defeated two-time winner Jasmine rice. Therefore, Paw San rice is considered as market driven export crop. Due to the nature of high domestic demand and price, low yield as compared to other rice varieties, only about 6% of total rice area was covered under Paw San in 2013 and it has little export share in Myanmar’s rice export volume. Current international rice trade is highly competitive and only high quality rice can get high price. However, Myanmar’s rice sector especially focused on quantity supplied rather than the quality; thus, the country is still unable to meet demands for a wide range of quality rice in export. The volume of rice export is constrained by poor grain quality, inadequate processing and marketing infrastructure, limited investments in irrigation and expansion of rice areas, and underdeveloped trading system, as well as marketing policies (World Bank, 2014).
In order to meet export demand for quality rice and increase export volume, Myanmar needs to ascertain whether quality rice production and export marketing is efficient under various government interventions and policies. In addition, as one of the top global rice exporters, export potential for quality rice is essentially needed for policy makers to know as well as rice industry stakeholders in Myanmar. Myanmar’s rice production depends on economic efficiency in terms of comparative advantage. In this context, some questions are raised: “Is there any effect of government intervention policies on the profitability of quality rice production and marketing?” “Is quality rice production sure to have comparative advantage or not and is there any space to exploit in the world market?” and “Would the changes of important determining factors for export such as yield of Paw San, export price and exchange rate affect the comparative advantage of Paw San production and trading? ”
Therefore, this study is an attempt to answer these questions to some extent in terms of indicating whether Myanmar is an efficient producer of Paw San rice and whether there will be export potential. The specific objectives are:
- To determine the effects of government intervention policies on private and social profitability of Paw San rice varieties in the past and present;
- To compare the advantages of Paw San rice production and export marketing in the past and present; and
- To estimate export potential in terms of pointing out the effects of changes in different yield levels, export prices and exchange rates of different Paw San rice varieties on Domestic Resource Cost ratio.
Research methodology
The comparative advantage concept applied in this study was referred to comparative cost advantage in David Ricardo’s theory. In this concern, the comparative advantage of Paw San rice production in Myanmar was investigated by implying domestic production cost comparison to the export earning.
The current study was based on the findings of comparative advantage studies for Paw San rice varieties which were carried out in Pathein and Phyapone Townships of Ayeyawaddy Region during 2008 and Shwebo Township, Sagaing Regions during 2013. The findings of case study interview with Paw San grower from Khin Oo Township, Sagaing Region in 2018 was also included to indicate the present situation. All these studies employed Policy Analysis Matrix (PAM) developed by Monke and Pearson (1989) to determine the comparative advantage of different Paw San varieties.
The results of PAM can help production system to determine simultaneously the economic efficiency of the system, the level of distortion on the input and output markets, and the extent to which resources are transferred among agents. PAM can be considered as a simple static general equilibrium and policy-oriented simulation model. It has characteristics of a general equilibrium model in that it takes into account the interdependencies between output (rice) sector and input sectors including factor markets for rice. It is static as it considers economic factors only at a given point in time.
The data requirements for construction of PAM include yields, input requirements, and the market prices for inputs and outputs. Additional data such as transportation costs, port charges, storage costs, processing, handling and packing costs, import/ export tariffs, and exchange rates are also required to calculate social prices. All inputs (reserved seed, farm yard manure, labor, cattle, agrochemicals, diesel for farm machineries) and outputs (milled rice) were classified as non-tradable and tradable items in PAM. Tradable inputs and outputs were valued at their world price equivalent adjusted for tax, transportation costs and current market exchange rates at the different study time periods. Non-tradable inputs were also valued at their returns in alternative opportunities. After tradable and non-tradable inputs and outputs were classified, their market prices were transformed into economic or social prices by using standard conversion factors through calculation of export and import parity prices. Market (private) price is a price at which a good or service is actually exchanged for another good or service as money. Social (economic) price is the true economic value of goods and services in the absence of taxes, subsidies, import tariff, quotas, price controls and other government policies. Accurate estimation of social prices is critically important in Domestic Resource Cost (DRC) analysis through PAM because these prices represent the opportunity costs to the economy of inputs and outputs.
The PAM model used for the comparative advantage studies which were reviewed for this case was as follow:
Table 1 Policy analysis matrix
|
Value (per ton of commodity)
|
Revenue
|
Tradable
input
|
Domestic
Factor Cost
|
Profit
|
|
Private prices
|
A
|
B
|
C
|
D
|
|
Social prices
|
E
|
F
|
G
|
H
|
|
Policy effect or divergences
|
I
|
J
|
K
|
L
|
Private profit D = A-(B+C)
Social profit H = E- (F+G)
Output policy I = A-E
Input policy J = B- F
Factor cost K = C- G
Net policy divergence L = D-H = I- (J+K)
Domestic Resource Cost ratio (DRC) = G/ (E-F)
Nominal Protection Coefficient for Revenue (NPC) = A/ E
Nominal Protection Coefficient for Tradable Inputs (NPCI) = B/ F
Effective Protection Coefficient (EPC) = (A-B)/ (E-F)
Source: Monke and Pearson (1989)
Even though PAM can simultaneously provide many policy analysis indicators for both output and input sectors, comparative advantage expressed the efficiency of using resources to produce the products by using a given production technology when measured against the possibilities of international trade. Therefore, Domestic Resource Cost (DRC) was selected as the most important policy indicator to estimate the comparative advantage for this study.
DRC was the ratio of domestic factor cost required to produce a certain amount of output valued at social prices to the value added created by the same resources at social prices. It was an indication of the total cost of production when prices are adjusted for taxes, subsidies, and market imperfection and resources valued at their opportunity costs. In other words, DRC showed the price that a country pays in terms of domestic resources in order to save one unit of foreign exchange by not importing the product (or by exporting the product).
The appropriate value of DRC is between one and zero. If DRC>1, the opportunity cost of domestic resources used to produce the commodity is greater than the amount of foreign exchange generated from these resources. Therefore, production of the commodity does not represent an efficient use of the country's domestic resources or the country does not have comparative advantage in producing the product. In contrast, if DRC < 1, the value of domestic resources used to produce the commodity is lower than its value added at social prices. Therefore, the country has a comparative advantage in producing the commodity or it is desirable to produce and expand the production of the commodity from the social point of view. If DRC = 1, the country is neutral in terms of comparative advantage of the product. A lower value of DRC of a product indicates a lower relative cost of domestic resources which again exhibits a higher comparative for a country and vice versa.
For this study, two policy effect indicators from PAM which were Nominal Protection Coefficient (NPC) for revenue of Paw San and Nominal Protection Coefficient on tradable inputs (NPCI) were also chosen to compare the past and present situations of output and input policy effects in Paw San rice production and trading. Nominal Protection Coefficient (NPC) was defined as the ratio of its domestic price to its border price of a product. Nominal Protection Coefficient on tradable inputs (NPCI) was defined as the ratio between the private values of all tradable input components to their social values. It showed the degree of tradable input transfer. The nominal protection rates reflected the impacts of commodity-specific price interventions such as domestic procurement and distribution system, import tariff, export taxes, and quantitative restrictions on domestic trade.
The NPC can assume a range of numerical values showing the overall policy distortion. If NPC > 1, the market price of output exceeds the social price, implying that the domestic producers receive higher price. This is called positive protection for producers who receive the output subsidy. For consumers it denotes negative protection. If NPC is less than 1, the negative protection occurs for producers. The consumer is being favored while the producer is being discriminated against. It implies that the producer implicitly pays a tax on the product. If NPC = 1, the protection is neutral. There may be no policy intervention on producers and consumers; therefore they are facing market prices that are equal to the social prices of outputs. If NPCI < 1, the private prices of inputs are lower than their social prices showing that policies are reducing input costs. In other words, the producers are subsidized in their input use. If NPCI > 1, they are taxed by purchasing the tradable inputs. If NPCI = 1, it indicates that there is either no policy distortion or neutral situation.
Policy Analysis Matrix (PAM) was a static model and it might generate results which were not realistic in a dynamic sense and potentially biased against government policies. To overcome this limitation, sensitivity analyses on DRC were done by changing in world reference prices for outputs, different exchange rates and different yield levels.
Results and discussion
Average yield of Paw San varieties were relatively different across the study areas and time period. Farmers in Ayeyawaddy Region received 2.13 MT/ha (41 baskets/acre) for Ayeyawaddy Paw San and 2.01 MT/ha (39 baskets/acre) for Phyapone Paw San respectively during 2008 monsoon season. Average paddy yield of Shwebo Paw San in Shwebo Township during 2013 monsoon season showed 3.17 MT/ha (62 baskets/acre) while that in Khin Oo Township cultivated during 2017 monsoon season was 3.86 MT/ha (75 baskets/acre) respectively, as in Fig.1. The export prices of Paw San rice varieties and exchange rates were also different during different time periods as in Fig. 2. The export price of Shwebo Paw San from Shwe bo to China via Muse 105 mile trading center during 2013 showed the highest value as compared to those of other Paw San rice export prices (FOB prices) received by exporting via sea trade in 2008 and 2018.
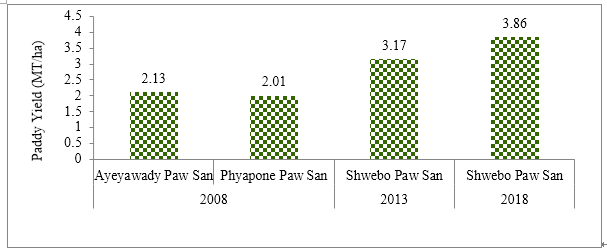
Figure 1 Paddy yields of Paw San varieties in different areas of Myanmar
Source: Aye Moe San, 2008, Cho Cho Win, 2013 and Authors’ case study data, 2018
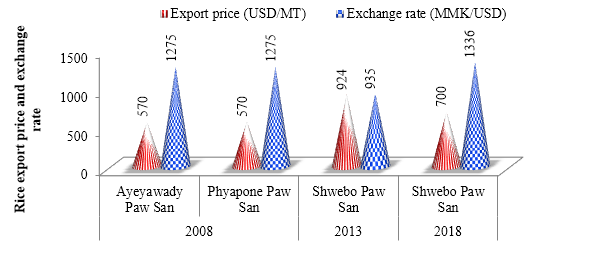
Figure 2 Rice export prices and exchange rates for Paw San varieties
Source: Aye Moe San, 2008, Cho Cho Win, 2013 and Authors’ case study data, 2018
Fig. 3 represented the export logistic costs of Paw San from different regions of Myanmar at different time periods. Share of export tax in export logistic cost, 72,680 MMK/MT, showed the largest portion in 2008 but its share became the smallest portions, 17,280 MMK/MT in 2013 and 18,700 MM K/MT in 2018 because of reducing export tax from 10% to 2% in 2011. Packaging, handling and processing costs contributed the lowest cost item in Paw San rice export which was only 9,000 MMK/MT in 2008, however, it increased 38,210 MMK/MT in 2013 and 30,000 MMK/MT in 2018 respectively. This figure clearly showed there is an increased trend in demanding high quality rice through better processing activities within a decade..PNG)
Figure 3 Logistic costs for Paw San export from different areas of Myanmar
Source: Aye Moe San, 2008, Cho Cho Win, 2013 and Authors’ case study data, 2018
The inputs used in Paw San rice production in different regions as well as the conversion of private to social value per hectare were presented in Table 1. Farmers in Ayeyawaddy Region did not use any insecticides, pesticides, rodenticides and weedicide while those in Shwebo used all of them for Paw San rice production.
Table 2. Private and social values of inputs used in Paw San rice production in different regions
(Unit= ‘000 MMK/ha)
|
Inputs
|
2008
|
2013
|
2018
|
|
Pathein
|
Phyapone
|
Shwebo
|
Khin Oo
|
|
Seed
|
32.59 (32.59)
|
21.51 (21.51)
|
49.42 (70.67)
|
83.98 (83.98)
|
|
FYM
|
5.89 (5.89)
|
10.66 (10.66)
|
11.87 (11.87)
|
39.52 (39.52)
|
|
Urea
|
102.76 (101.74)
|
107.63 (101.17)
|
65.11 (47.53)
|
|
|
T super
|
64.28 (57.86)
|
47.66 (44.80)
|
|
|
|
Compound
|
42.71 (35.88)
|
52.65 (42.64)
|
77.94 (56.87)
|
177.84 (154.72)
|
|
Insecticide
|
|
|
13.87 (4.62)
|
172.90 (167.71)
|
|
Weedicide
|
|
|
8.09 (1.73)
|
|
|
Rodenticide
|
|
|
6.19 (3.12)
|
|
|
Furadum 3G
|
|
|
5.41 (1.99)
|
|
|
Diesel
|
|
|
20.67 (19.01)
|
19.76 (17.19)
|
|
Labor
|
223.54 (207.72)
|
179.05 (167.59)
|
521.77 (491.18)
|
597.74 (578.84)
|
Note: Values in parentheses represent the social values.
Source: Aye Moe San, 2008, Cho Cho Win, 2013 and Authors’ case study data, 2018
Consequently, private and social costs and returns of Paw San rice productions in different areas were illustrated in Fig.4. Findings of three studies showed that farmers received relatively lower private gross revenues than social gross revenues in Paw San rice production which created negative output policy divergences. Farmers got 38% less than social gross revenue in Ayeyawaddy Region during 2008 while farmers in Shwebo got 30% less and those in Khin Oo received 33% less gross revenue than the respective social revenue in 2013 and 2018. The negative values of output transfers pointed out that farmers did not receive protection from the government export policies. On the other hand, the values for input transfers (the differences between the private and social values of tradable inputs) and the factor transfers (the differences between the private and social values of non-tradable inputs or domestic transfers) were positive. Positive values of divergences for tradable and non-tradable inputs showed that the private input costs for both tradable and non-tradable inputs were larger (ranging the lowest 3% to the highest 20%) than their respective social input costs. This occurred because inputs were available from under market distortion. The prices paid by farmers for inputs were high because the government did not subsidize any imported agrochemicals and diesel to farmers. This seemed as if the farmers were indirectly taxed by purchasing tradable inputs. The positive divergences in non-tradable input costs indicated that farmers paid higher prices to labor especially at the peak season. As a consequence, the total variable costs based on market prices were 7% each, 9% and 5% respectively higher as compared to the total variable costs at social prices in Ayeyawaddy Region, Shwebo and Khin Oo across the study period.
The results also showed the variation in private and social benefit-cost ratios, however, all were greater than 1 which means Paw San rice productions in study areas were financially and economically profitable for Paw San growers, as shown in Fig. 5. The benefit-cost ratios at social values were higher than those at private values for Paw San in Ayeyawaddy and Sagaing Regions during 2008, 2013 and 2018.
.PNG)
Figure 4 Private and social costs and returns of Paw San productions in different areas of Myanmar
Note: Values in boxes represent the percentage differences between private and social revenue and costs based on financial values.
Source: Aye Moe San, 2008, Cho Cho Win, 2013 and Authors’ case study data, 2018
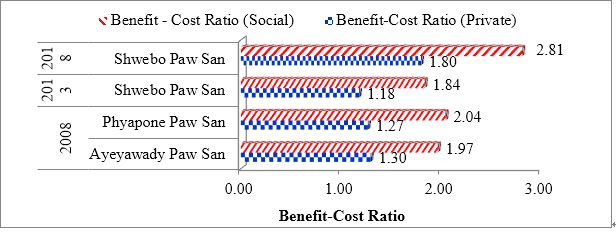
Figure 5 Private and social benefit-cost ratios of Paw San productions in different areas of Myanmar
Source: Aye Moe San, 2008, Cho Cho Win, 2013 and Authors’ case study data, 2018
The empirical analysis demonstrated that all study areas: Pathein, Phyapone, Shwe bo and Khin Oo townships had comparative advantages in the production of Paw San varieties because of 0 < DRC <1, as shown in Fig.6. The DRC value of Ayeyawaddy Paw San was 0.37 and that of Phyapone Paw San was 0.31 while that of Shwebo Paw San in Shwebo was 0.39 and that in Khin Oo was 0.13 respectively. According to their private and social benefit-cost ratios, Paw San varieties were also desirable to produce and expand the productions from the social point of view in the future. According to findings of three studies, the comparative advantage of Shwebo Paw San in Khin Oo Township was the highest because of the lowest DRC value, 0.13 with respect to the high yield level (75 baskets/acre), world market price, and current technologies and input prices. This DRC value showed that only 0.13 unit of domestic resources was utilized in order to earn 1 unit of foreign exchange by exporting Shwebo Paw San variety from Khin Oo Township. A lower value of DRC indicated a lower relative cost of domestic resources which again exhibited a higher comparative advantage for a country and vice versa.
Nominal Protection Coefficients (NPC), the ratios between the revenues of the products in private prices to their counterpart in social prices were less than 1 in the study areas, as in Fig. 6. This indicated that negative protections occurred for producers and low NPC values implied that the producers implicitly paid taxes on the Paw San productions. The values of NPC, 0.70 and 0.67 of Paw San varieties indicated that the output policies caused private price of Paw San to be 30% and 33% lower than social price. These NPC values could be explained by the trade margin that could contribute a large difference between farm gate prices received by farmers and export prices received by traders. The market information dissemination service in Myanmar was still in inadequate condition and there was information gap between primary producers and terminal markets. Hence, these divergences could be caused by market imperfection. On the other hand, Nominal Protection Coefficients for Tradable Inputs (NPCI), the ratios between the private values of all tradable input components to their social values were greater than 1 in Paw San Paw San productions. This indicated that the private values of tradable inputs were greater than the social values. The larger values of NPCI indicated that farmers were implicitly taxed on the prices of tradable inputs in purchasing. There can be concluded that trade policies were still undesirable for farmers in raising the input costs within a decade.
.PNG)
Figure 6 Selected policy analysis indicators for Paw San productions in Myanmar
Source: Aye Moe San, 2008, Cho Cho Win, 2013 and Authors’ case study data, 2018
Comparative advantage rankings tend to be highly sensitive to world prices of rice, to the level of paddy yield and to the exchange rates. Therefore, sensitivity analyses on comparative advantages (on DRC ratios) were calculated by changing different average yield levels, the recorded rice export prices and exchange rates for Paw San varieties in all three studies. All studies assumed the domestic resource costs, tradable input costs, labor and cattle costs and the prices of Paw San varieties as a constant. As shown in subsequent Fig.7 to 10, DRC ratios became smaller and smaller if yield, export price and exchange rate increased. There can be concluded that Paw San rice production would obtain more favorable comparative advantages if Myanmar can expand export destinations to high income countries along with higher export prices at the increased exchange rate. Meanwhile, weakness in production and processing stages along rice value chain should be offset to achieve high yield level and good quality product in order to take place in competitive international markets.
.PNG)
Figure 7. Sensitivity Analysis on DRC for Ayeyawaddy Pawsan Production during 2008
Note: * represents exchange rate MMK per 1 US$.
Source: Aye Moe San, 2008
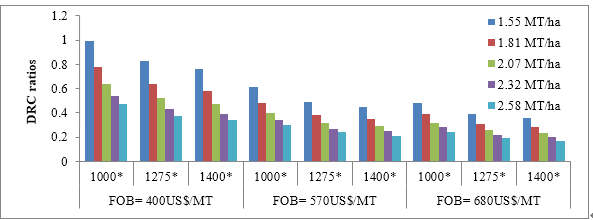
Figure 8. Sensitivity Analysis on DRC for Phyapone Pawsan Production during 2008
Note: * represents exchange rate MMK per 1 US$.
Source: Aye Moe San, 2008
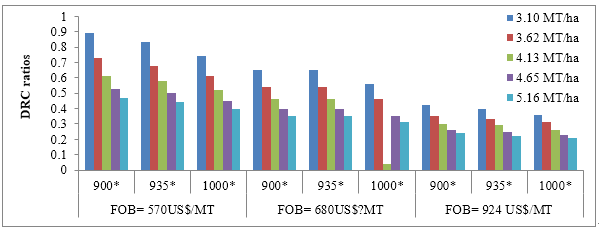
Figure 9. Sensitivity Analysis on DRC for Shwebo Paw San Production during 2013
Note: * represents exchange rate MMK per 1 US$.
Source: Cho Cho Win, 2013
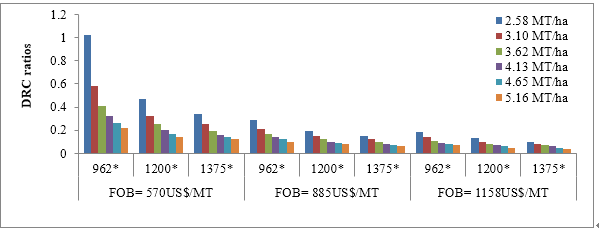
Figure 10. Sensitivity Analysis on DRC for Shwebo Paw San Production during 2018
Note: * represents exchange rate MMK per 1 US$.
Source: Authors’ case study data, 2018
Conclusions and Policy Recommendation
Examining comparative advantage of rice is important for Myanmar, as one of the world’s largest rice exporting countries. The contribution of rice production to economic development in Myanmar depends to a considerable extent on their economic efficiency in terms of comparative advantage of domestic production and export marketing. Current international rice trade is highly competitive and only high quality rice can get better condition in both domestic and export markets. Therefore, by utilizing a PAM model, this study analyzed the comparative advantages of Myanmar’s high quality rice “Paw San” to ascertain whether Myanmar is an efficient producer of Paw San rice varieties in the past and present as well as to estimate export potential of Paw San in the future. This study particularly focused on Paw San in major Paw San producing areas of lower and upper Myanmar at different time periods (2008, 2013 and 2018).
The findings showed that farmers had to pay high prices for inputs at market prices rather than economic values at their respective social prices across the time and regions. That showed there was market imperfection in input sectors and trading policies were seemed as implicitly levying taxes on farmers due to restriction on import licenses, tariffs and other transportation and handling charges. Similarly, farmers faced higher labor requirement and high cost of labor at the peak seasons of Paw San productions. Average yield level of Paw San was relatively low in Ayeyawaddy Region last decade ago while those in Sagaing Region showed higher yield level in 2013 and 2018. Due to export tax reduction in 2011, the export tax contributed as the lowest share in rice export logistic costs after 2011, however, handling, packaging and processing activities took place increased share in rice export logistic costs in 2013 and 2018. Transportation costs form farm gate to export points still remained the largest cost items in rice export in 2013 and 2018. Due to high transportation costs, other charges and product market imperfection, there were large differences in trade margins between farm gate prices received by farmers and export prices received by traders for Paw San rice varieties.
However, Paw San rice production and marketing showed financially and economically profitable for Myanmar farmers within a decade even though there were undesirable policy environment for input and output sides. In addition, Paw San production and trading had comparative advantages under past and present production technologies and government intervention policies. If producers will have the higher export price with the higher yield level at the higher exchange rate, the more comparative advantage for the country can be assured. Paw San rice production and exporting has a potential for Myanmar to increase income of producers as well as to contribute to foreign exchange earnings for the country economy because financial returns to domestic producers were attractive even though there were distortions in market prices and other constraints.
To overcome labor scarcity and high labor cost at the peak season of Paw San production, farm mechanization technologies should be encouraged by providing farm machines such as power tillers/tractors, combine harvesters and power threshers to reduce labor intensive activities like land preparation and harvesting. To maintain long term comparative advantages in Paw San production, productivities and product quality should be enhanced by providing improved production technologies and postharvest management practices. Infrastructures such as farm to market road, processing plants and storage facilities should be developed in order to reduce logistic costs in rice export and to increase profitability. Government should also support the smooth flow of imported agrochemicals by setting up the flexible policies on import. Finally, government intervention policies should be focusing on facilitating open market trading with more transparent price information system along marketing channel for both inputs and outputs.
REFERENCES
Aye Moe San 2008. Comparative advantages of two exported rice varieties (Pawsan and Manawthukha) in the selected townships of Ayeyarwaddy Division. MSc. Thesis, Yezin Agricultural University, Myanmar.
Cho Cho Win 2013. Comparative advantage of selected rice varieties (Shwebo Pawsan and Ayeyarmin) in Shwebo township, Sagaing Region, MSc Thesis, Yezin Agricultural Univerisity, Myanmar.
Hnin Yu Lwin 2010. Economic evaluation of the potential of Myanmar rice market
under changing policy mix. PhD. Thesis, Kyushu University, Fukuoka, Japan.
Monke, E. A. and S. R. Person 1989. The Policy Analysis Matrix for agricultural development. Conell University Press, Ithaca and Landon.
Okamoto, I. 2013. Rice export and contract farming: Lessons from “Rice Specializing Companies”.
Phyu Lay Myint and O. Napasintuwong 2016. Economic analysis of Paw San rice adoption in Myanmar, DOI:10.3923/ajar.2016.175.184, Asian Journal of Agricultural Research.
Theing Myint and Aye Moe San 2018. Case study interview of Shwebo Paw San growers from Khin Oo Township, Sagaing Region.
Wong, L., And Wai, Eh. M. A. 2013. Rapid value chain assessment: Structure and dynamics of the rice value chain in Myanmar. Strategic agricultural sector and food security diagnostic for Myanmar. Background paper No. 6. Michigan State University and Myanmar Research and Development Institute: 1- 46.
World Bank 2014. Myanmar: Capitalizing on rice export opportunities. Economic and Sector Work Report No.85804, Southeast Asia Sustainable Development Unit, World Bank Group, Washington, DC.
|
Date submitted: Feb. 1, 2019
Reviewed, edited and uploaded: May. 30, 2019
|

Export Potential of Myanmar Paw San Hmwe Rice: Policy Analysis through Comparative Advantage
Abstract
Rice is not only a staple food but also an important exported cereal in Myanmar. Taking spaces in international markets as well as maintaining sufficient domestic rice consumption becomes an important issue for Myanmar’s economy. The economic importance of rice industry is political pressure for successive government in Myanmar. Particularly after complete liberalization of rice export in 2011, as one of the major global rice exporters, export potential for rice is essentially needed to know for policy makers as well as rice industry stakeholders in Myanmar. Paw San, also known as “Pearl rice”, is a premium quality fragrant rice of Myanmar which has gained the reputation of being the world’s best rice in 2011 and is considered a market driven export rice. This study investigated the export potential of Paw San varieties by reviewing the findings of comparative advantage studies which were carried out in selected townships of Ayeyawaddy and Sagaing Regions during 2008 and 2013. The findings of the case study interview with Paw San grower from Khin Oo Township, Sagaing Region in 2018 was also included in this study. The findings showed that Paw San varieties could generate pleasurable income for Myanmar farmers under existing production technologies and government interventions both in the past and present. Paw San varieties had favorable comparative advantages in all study areas and higher comparative advantages could be seen at the high level of world prices, high yield levels and high exchange rates for Paw San production and marketing under different scenarios. Moreover, the findings also indicated that Paw San varieties should be enhanced in terms of reducing explicit and implicit tax or market failure of tradable goods by government in order to increase the economic efficiency of production and export potential in the future.
Keywords: Paw San, Export, Comparative Advantage, Myanmar
Introduction
Rice is not only a main staple food but also one of the most important exported cereals in agrarian based Myanmar. Maintaining sufficient domestic rice consumption as well as taking spaces in international markets becomes the important issue in Myanmar’s economy. Rice has been the focus in the history of Myanmar’s economic development and the economic importance of rice industry is political pressure for successive government. Before World War II, Myanmar was a top rice exporter in the world and exported about 3 million tons annually. Because of stagnation of production since the 1960s and export restriction, Thailand took the place of Myanmar in the export market and Myanmar rice export nearly disappeared in 1970s. The significant yield increased from the mid 1970s to early 1980s was certainly due to implementation of the special high-yielding rice program with the adoption of modern rice varieties and agronomic practices (Hnin Yu Lwin, 2010).
Myanmar has adopted a series of policy reforms to liberalize its economy since the late 1980s. The government introduced the market oriented economic system in 1988 and agricultural policies concentrated to increase production and agricultural exports. Liberalizations of rice marketing were implemented twice in 1987 and 2003 to accelerate a market oriented economy by favoring competitive market price for rice producers and consumers. Abolishing government’s monopolized compulsory marketing quotas of paddy and rice trading and ending the distributed ration system after second liberalization unlocked substantial space for private traders and agribusinesses. Therefore, all citizens were free to participate in the domestic rice trade. Rice export was allowed only when there was surplus, however, the export earnings were to be shared equally between the government and the private companies (since export tax was levied at 10%, the share was 45% each), while the government paid 45% of the export costs that accrued to the private companies in local currency (Okamoto, 2013).
Rice export plan was pulled back again in January 2004 because of uncertain rice surplus and confidence of rice traders reduced by highly volatile rice export policies. The number of rice export companies and export quantities were also fluctuating because of unclear rice export licensing procedure. Rice export gradually declined even after liberalization while Myanmar Agricultural Produce Trading (MAPT) and Ministry of Agriculture and Irrigation (MOAI) were not involved in rice exports apart from allocating the existing stock. Myanmar Economic Corporation (MEC) or Union of Myanmar Economic Holding (UMEHL) became the main players in rice export since 2004 (Wong and Wai, 2013). As a conditional solution to limited access to affordable seeds and other inputs, credit, and extension, the rice specialization companies (RSCs) were established in 2008 and they provided all these support to smallholder farmers. More comprehensive and contract farming initiatives were implemented by RSCs and the government gave priority export license to RSCs as a reward for developing the supply chain.
Since 2011, the country has opened its doors to democratic transformation and government has started ambitious efforts with a major focus on economic reforms. The government abolished the quota system and fully liberalized any registered traders with certified stock level and facilities to apply export license for rice export, thus the access of RSCs’ export priority has been lost. Rice export tax was also reduced from 10% to 2% and agricultural policy liberalization across a broad range of commodities was started while rice sector still requires the export permission. In 2012, the Myanmar Rice Federation (MRF) was formed and is currently performing as the umbrella organization representing the five private sector groups of farmers/paddy producers, millers, traders, fertilizer, seed, pesticide entrepreneurs, and the companies including the RSCs, Myanmar Agribusiness Public Corporation (MAPCO) and exporters in order to develop private public partnership along the rice supply chain.
After completely liberalizing rice export in 2011, rice export reached 1.6 million tons in 2013-2014, the highest export level during the past 40 years. However, the quality and price of Myanmar’s export rice remain lower than the international market even the world demand for high quality fragrant rice has increased. Although the price of fragrant rice is more than that of other normal white rice, the share of fragrant rice exporters in the world market is still small. European Union, Singapore, Hong Kong and most Southeast Asian countries are potential markets for high quality fragrant rice. Myanmar, one of the top global rice exporters as well as producers of many rice varieties, may also have the potential to capture the higher value portions of the world’s fragrant rice market (Phyu Lay Myint and Napasintuwong, 2016).
Paw San, also well known as “Myanmar’s Pearl Rice”, is one of the most recognized high quality fragrant rice varieties in the world. Myanmar Paw San has similar aroma, grain and eating qualities to the world’s famous fragrant rice varieties such as Basmati from India and Pakistan and Jasmine rice from Thailand. Paw San was awarded as the world’s best rice at the Rice Traders’ World Rice Conference in 2011 and it defeated two-time winner Jasmine rice. Therefore, Paw San rice is considered as market driven export crop. Due to the nature of high domestic demand and price, low yield as compared to other rice varieties, only about 6% of total rice area was covered under Paw San in 2013 and it has little export share in Myanmar’s rice export volume. Current international rice trade is highly competitive and only high quality rice can get high price. However, Myanmar’s rice sector especially focused on quantity supplied rather than the quality; thus, the country is still unable to meet demands for a wide range of quality rice in export. The volume of rice export is constrained by poor grain quality, inadequate processing and marketing infrastructure, limited investments in irrigation and expansion of rice areas, and underdeveloped trading system, as well as marketing policies (World Bank, 2014).
In order to meet export demand for quality rice and increase export volume, Myanmar needs to ascertain whether quality rice production and export marketing is efficient under various government interventions and policies. In addition, as one of the top global rice exporters, export potential for quality rice is essentially needed for policy makers to know as well as rice industry stakeholders in Myanmar. Myanmar’s rice production depends on economic efficiency in terms of comparative advantage. In this context, some questions are raised: “Is there any effect of government intervention policies on the profitability of quality rice production and marketing?” “Is quality rice production sure to have comparative advantage or not and is there any space to exploit in the world market?” and “Would the changes of important determining factors for export such as yield of Paw San, export price and exchange rate affect the comparative advantage of Paw San production and trading? ”
Therefore, this study is an attempt to answer these questions to some extent in terms of indicating whether Myanmar is an efficient producer of Paw San rice and whether there will be export potential. The specific objectives are:
Research methodology
The comparative advantage concept applied in this study was referred to comparative cost advantage in David Ricardo’s theory. In this concern, the comparative advantage of Paw San rice production in Myanmar was investigated by implying domestic production cost comparison to the export earning.
The current study was based on the findings of comparative advantage studies for Paw San rice varieties which were carried out in Pathein and Phyapone Townships of Ayeyawaddy Region during 2008 and Shwebo Township, Sagaing Regions during 2013. The findings of case study interview with Paw San grower from Khin Oo Township, Sagaing Region in 2018 was also included to indicate the present situation. All these studies employed Policy Analysis Matrix (PAM) developed by Monke and Pearson (1989) to determine the comparative advantage of different Paw San varieties.
The results of PAM can help production system to determine simultaneously the economic efficiency of the system, the level of distortion on the input and output markets, and the extent to which resources are transferred among agents. PAM can be considered as a simple static general equilibrium and policy-oriented simulation model. It has characteristics of a general equilibrium model in that it takes into account the interdependencies between output (rice) sector and input sectors including factor markets for rice. It is static as it considers economic factors only at a given point in time.
The data requirements for construction of PAM include yields, input requirements, and the market prices for inputs and outputs. Additional data such as transportation costs, port charges, storage costs, processing, handling and packing costs, import/ export tariffs, and exchange rates are also required to calculate social prices. All inputs (reserved seed, farm yard manure, labor, cattle, agrochemicals, diesel for farm machineries) and outputs (milled rice) were classified as non-tradable and tradable items in PAM. Tradable inputs and outputs were valued at their world price equivalent adjusted for tax, transportation costs and current market exchange rates at the different study time periods. Non-tradable inputs were also valued at their returns in alternative opportunities. After tradable and non-tradable inputs and outputs were classified, their market prices were transformed into economic or social prices by using standard conversion factors through calculation of export and import parity prices. Market (private) price is a price at which a good or service is actually exchanged for another good or service as money. Social (economic) price is the true economic value of goods and services in the absence of taxes, subsidies, import tariff, quotas, price controls and other government policies. Accurate estimation of social prices is critically important in Domestic Resource Cost (DRC) analysis through PAM because these prices represent the opportunity costs to the economy of inputs and outputs.
The PAM model used for the comparative advantage studies which were reviewed for this case was as follow:
Table 1 Policy analysis matrix
Value (per ton of commodity)
Revenue
Tradable
input
Domestic
Factor Cost
Profit
Private prices
A
B
C
D
Social prices
E
F
G
H
Policy effect or divergences
I
J
K
L
Private profit D = A-(B+C)
Social profit H = E- (F+G)
Output policy I = A-E
Input policy J = B- F
Factor cost K = C- G
Net policy divergence L = D-H = I- (J+K)
Domestic Resource Cost ratio (DRC) = G/ (E-F)
Nominal Protection Coefficient for Revenue (NPC) = A/ E
Nominal Protection Coefficient for Tradable Inputs (NPCI) = B/ F
Effective Protection Coefficient (EPC) = (A-B)/ (E-F)
Source: Monke and Pearson (1989)
Even though PAM can simultaneously provide many policy analysis indicators for both output and input sectors, comparative advantage expressed the efficiency of using resources to produce the products by using a given production technology when measured against the possibilities of international trade. Therefore, Domestic Resource Cost (DRC) was selected as the most important policy indicator to estimate the comparative advantage for this study.
DRC was the ratio of domestic factor cost required to produce a certain amount of output valued at social prices to the value added created by the same resources at social prices. It was an indication of the total cost of production when prices are adjusted for taxes, subsidies, and market imperfection and resources valued at their opportunity costs. In other words, DRC showed the price that a country pays in terms of domestic resources in order to save one unit of foreign exchange by not importing the product (or by exporting the product).
The appropriate value of DRC is between one and zero. If DRC>1, the opportunity cost of domestic resources used to produce the commodity is greater than the amount of foreign exchange generated from these resources. Therefore, production of the commodity does not represent an efficient use of the country's domestic resources or the country does not have comparative advantage in producing the product. In contrast, if DRC < 1, the value of domestic resources used to produce the commodity is lower than its value added at social prices. Therefore, the country has a comparative advantage in producing the commodity or it is desirable to produce and expand the production of the commodity from the social point of view. If DRC = 1, the country is neutral in terms of comparative advantage of the product. A lower value of DRC of a product indicates a lower relative cost of domestic resources which again exhibits a higher comparative for a country and vice versa.
For this study, two policy effect indicators from PAM which were Nominal Protection Coefficient (NPC) for revenue of Paw San and Nominal Protection Coefficient on tradable inputs (NPCI) were also chosen to compare the past and present situations of output and input policy effects in Paw San rice production and trading. Nominal Protection Coefficient (NPC) was defined as the ratio of its domestic price to its border price of a product. Nominal Protection Coefficient on tradable inputs (NPCI) was defined as the ratio between the private values of all tradable input components to their social values. It showed the degree of tradable input transfer. The nominal protection rates reflected the impacts of commodity-specific price interventions such as domestic procurement and distribution system, import tariff, export taxes, and quantitative restrictions on domestic trade.
The NPC can assume a range of numerical values showing the overall policy distortion. If NPC > 1, the market price of output exceeds the social price, implying that the domestic producers receive higher price. This is called positive protection for producers who receive the output subsidy. For consumers it denotes negative protection. If NPC is less than 1, the negative protection occurs for producers. The consumer is being favored while the producer is being discriminated against. It implies that the producer implicitly pays a tax on the product. If NPC = 1, the protection is neutral. There may be no policy intervention on producers and consumers; therefore they are facing market prices that are equal to the social prices of outputs. If NPCI < 1, the private prices of inputs are lower than their social prices showing that policies are reducing input costs. In other words, the producers are subsidized in their input use. If NPCI > 1, they are taxed by purchasing the tradable inputs. If NPCI = 1, it indicates that there is either no policy distortion or neutral situation.
Policy Analysis Matrix (PAM) was a static model and it might generate results which were not realistic in a dynamic sense and potentially biased against government policies. To overcome this limitation, sensitivity analyses on DRC were done by changing in world reference prices for outputs, different exchange rates and different yield levels.
Results and discussion
Average yield of Paw San varieties were relatively different across the study areas and time period. Farmers in Ayeyawaddy Region received 2.13 MT/ha (41 baskets/acre) for Ayeyawaddy Paw San and 2.01 MT/ha (39 baskets/acre) for Phyapone Paw San respectively during 2008 monsoon season. Average paddy yield of Shwebo Paw San in Shwebo Township during 2013 monsoon season showed 3.17 MT/ha (62 baskets/acre) while that in Khin Oo Township cultivated during 2017 monsoon season was 3.86 MT/ha (75 baskets/acre) respectively, as in Fig.1. The export prices of Paw San rice varieties and exchange rates were also different during different time periods as in Fig. 2. The export price of Shwebo Paw San from Shwe bo to China via Muse 105 mile trading center during 2013 showed the highest value as compared to those of other Paw San rice export prices (FOB prices) received by exporting via sea trade in 2008 and 2018.
Figure 1 Paddy yields of Paw San varieties in different areas of Myanmar
Source: Aye Moe San, 2008, Cho Cho Win, 2013 and Authors’ case study data, 2018
Figure 2 Rice export prices and exchange rates for Paw San varieties
Source: Aye Moe San, 2008, Cho Cho Win, 2013 and Authors’ case study data, 2018
Fig. 3 represented the export logistic costs of Paw San from different regions of Myanmar at different time periods. Share of export tax in export logistic cost, 72,680 MMK/MT, showed the largest portion in 2008 but its share became the smallest portions, 17,280 MMK/MT in 2013 and 18,700 MM K/MT in 2018 because of reducing export tax from 10% to 2% in 2011. Packaging, handling and processing costs contributed the lowest cost item in Paw San rice export which was only 9,000 MMK/MT in 2008, however, it increased 38,210 MMK/MT in 2013 and 30,000 MMK/MT in 2018 respectively. This figure clearly showed there is an increased trend in demanding high quality rice through better processing activities within a decade..PNG)
Figure 3 Logistic costs for Paw San export from different areas of Myanmar
Source: Aye Moe San, 2008, Cho Cho Win, 2013 and Authors’ case study data, 2018
The inputs used in Paw San rice production in different regions as well as the conversion of private to social value per hectare were presented in Table 1. Farmers in Ayeyawaddy Region did not use any insecticides, pesticides, rodenticides and weedicide while those in Shwebo used all of them for Paw San rice production.
Table 2. Private and social values of inputs used in Paw San rice production in different regions
(Unit= ‘000 MMK/ha)
Inputs
2008
2013
2018
Pathein
Phyapone
Shwebo
Khin Oo
Seed
32.59 (32.59)
21.51 (21.51)
49.42 (70.67)
83.98 (83.98)
FYM
5.89 (5.89)
10.66 (10.66)
11.87 (11.87)
39.52 (39.52)
Urea
102.76 (101.74)
107.63 (101.17)
65.11 (47.53)
T super
64.28 (57.86)
47.66 (44.80)
Compound
42.71 (35.88)
52.65 (42.64)
77.94 (56.87)
177.84 (154.72)
Insecticide
13.87 (4.62)
172.90 (167.71)
Weedicide
8.09 (1.73)
Rodenticide
6.19 (3.12)
Furadum 3G
5.41 (1.99)
Diesel
20.67 (19.01)
19.76 (17.19)
Labor
223.54 (207.72)
179.05 (167.59)
521.77 (491.18)
597.74 (578.84)
Note: Values in parentheses represent the social values.
Source: Aye Moe San, 2008, Cho Cho Win, 2013 and Authors’ case study data, 2018
Consequently, private and social costs and returns of Paw San rice productions in different areas were illustrated in Fig.4. Findings of three studies showed that farmers received relatively lower private gross revenues than social gross revenues in Paw San rice production which created negative output policy divergences. Farmers got 38% less than social gross revenue in Ayeyawaddy Region during 2008 while farmers in Shwebo got 30% less and those in Khin Oo received 33% less gross revenue than the respective social revenue in 2013 and 2018. The negative values of output transfers pointed out that farmers did not receive protection from the government export policies. On the other hand, the values for input transfers (the differences between the private and social values of tradable inputs) and the factor transfers (the differences between the private and social values of non-tradable inputs or domestic transfers) were positive. Positive values of divergences for tradable and non-tradable inputs showed that the private input costs for both tradable and non-tradable inputs were larger (ranging the lowest 3% to the highest 20%) than their respective social input costs. This occurred because inputs were available from under market distortion. The prices paid by farmers for inputs were high because the government did not subsidize any imported agrochemicals and diesel to farmers. This seemed as if the farmers were indirectly taxed by purchasing tradable inputs. The positive divergences in non-tradable input costs indicated that farmers paid higher prices to labor especially at the peak season. As a consequence, the total variable costs based on market prices were 7% each, 9% and 5% respectively higher as compared to the total variable costs at social prices in Ayeyawaddy Region, Shwebo and Khin Oo across the study period.
The results also showed the variation in private and social benefit-cost ratios, however, all were greater than 1 which means Paw San rice productions in study areas were financially and economically profitable for Paw San growers, as shown in Fig. 5. The benefit-cost ratios at social values were higher than those at private values for Paw San in Ayeyawaddy and Sagaing Regions during 2008, 2013 and 2018.
Figure 4 Private and social costs and returns of Paw San productions in different areas of Myanmar
Note: Values in boxes represent the percentage differences between private and social revenue and costs based on financial values.
Source: Aye Moe San, 2008, Cho Cho Win, 2013 and Authors’ case study data, 2018
Figure 5 Private and social benefit-cost ratios of Paw San productions in different areas of Myanmar
Source: Aye Moe San, 2008, Cho Cho Win, 2013 and Authors’ case study data, 2018
The empirical analysis demonstrated that all study areas: Pathein, Phyapone, Shwe bo and Khin Oo townships had comparative advantages in the production of Paw San varieties because of 0 < DRC <1, as shown in Fig.6. The DRC value of Ayeyawaddy Paw San was 0.37 and that of Phyapone Paw San was 0.31 while that of Shwebo Paw San in Shwebo was 0.39 and that in Khin Oo was 0.13 respectively. According to their private and social benefit-cost ratios, Paw San varieties were also desirable to produce and expand the productions from the social point of view in the future. According to findings of three studies, the comparative advantage of Shwebo Paw San in Khin Oo Township was the highest because of the lowest DRC value, 0.13 with respect to the high yield level (75 baskets/acre), world market price, and current technologies and input prices. This DRC value showed that only 0.13 unit of domestic resources was utilized in order to earn 1 unit of foreign exchange by exporting Shwebo Paw San variety from Khin Oo Township. A lower value of DRC indicated a lower relative cost of domestic resources which again exhibited a higher comparative advantage for a country and vice versa.
Nominal Protection Coefficients (NPC), the ratios between the revenues of the products in private prices to their counterpart in social prices were less than 1 in the study areas, as in Fig. 6. This indicated that negative protections occurred for producers and low NPC values implied that the producers implicitly paid taxes on the Paw San productions. The values of NPC, 0.70 and 0.67 of Paw San varieties indicated that the output policies caused private price of Paw San to be 30% and 33% lower than social price. These NPC values could be explained by the trade margin that could contribute a large difference between farm gate prices received by farmers and export prices received by traders. The market information dissemination service in Myanmar was still in inadequate condition and there was information gap between primary producers and terminal markets. Hence, these divergences could be caused by market imperfection. On the other hand, Nominal Protection Coefficients for Tradable Inputs (NPCI), the ratios between the private values of all tradable input components to their social values were greater than 1 in Paw San Paw San productions. This indicated that the private values of tradable inputs were greater than the social values. The larger values of NPCI indicated that farmers were implicitly taxed on the prices of tradable inputs in purchasing. There can be concluded that trade policies were still undesirable for farmers in raising the input costs within a decade.
Figure 6 Selected policy analysis indicators for Paw San productions in Myanmar
Source: Aye Moe San, 2008, Cho Cho Win, 2013 and Authors’ case study data, 2018
Comparative advantage rankings tend to be highly sensitive to world prices of rice, to the level of paddy yield and to the exchange rates. Therefore, sensitivity analyses on comparative advantages (on DRC ratios) were calculated by changing different average yield levels, the recorded rice export prices and exchange rates for Paw San varieties in all three studies. All studies assumed the domestic resource costs, tradable input costs, labor and cattle costs and the prices of Paw San varieties as a constant. As shown in subsequent Fig.7 to 10, DRC ratios became smaller and smaller if yield, export price and exchange rate increased. There can be concluded that Paw San rice production would obtain more favorable comparative advantages if Myanmar can expand export destinations to high income countries along with higher export prices at the increased exchange rate. Meanwhile, weakness in production and processing stages along rice value chain should be offset to achieve high yield level and good quality product in order to take place in competitive international markets.
Figure 7. Sensitivity Analysis on DRC for Ayeyawaddy Pawsan Production during 2008
Note: * represents exchange rate MMK per 1 US$.
Source: Aye Moe San, 2008
Figure 8. Sensitivity Analysis on DRC for Phyapone Pawsan Production during 2008
Note: * represents exchange rate MMK per 1 US$.
Source: Aye Moe San, 2008
Figure 9. Sensitivity Analysis on DRC for Shwebo Paw San Production during 2013
Note: * represents exchange rate MMK per 1 US$.
Source: Cho Cho Win, 2013
Figure 10. Sensitivity Analysis on DRC for Shwebo Paw San Production during 2018
Note: * represents exchange rate MMK per 1 US$.
Source: Authors’ case study data, 2018
Conclusions and Policy Recommendation
Examining comparative advantage of rice is important for Myanmar, as one of the world’s largest rice exporting countries. The contribution of rice production to economic development in Myanmar depends to a considerable extent on their economic efficiency in terms of comparative advantage of domestic production and export marketing. Current international rice trade is highly competitive and only high quality rice can get better condition in both domestic and export markets. Therefore, by utilizing a PAM model, this study analyzed the comparative advantages of Myanmar’s high quality rice “Paw San” to ascertain whether Myanmar is an efficient producer of Paw San rice varieties in the past and present as well as to estimate export potential of Paw San in the future. This study particularly focused on Paw San in major Paw San producing areas of lower and upper Myanmar at different time periods (2008, 2013 and 2018).
The findings showed that farmers had to pay high prices for inputs at market prices rather than economic values at their respective social prices across the time and regions. That showed there was market imperfection in input sectors and trading policies were seemed as implicitly levying taxes on farmers due to restriction on import licenses, tariffs and other transportation and handling charges. Similarly, farmers faced higher labor requirement and high cost of labor at the peak seasons of Paw San productions. Average yield level of Paw San was relatively low in Ayeyawaddy Region last decade ago while those in Sagaing Region showed higher yield level in 2013 and 2018. Due to export tax reduction in 2011, the export tax contributed as the lowest share in rice export logistic costs after 2011, however, handling, packaging and processing activities took place increased share in rice export logistic costs in 2013 and 2018. Transportation costs form farm gate to export points still remained the largest cost items in rice export in 2013 and 2018. Due to high transportation costs, other charges and product market imperfection, there were large differences in trade margins between farm gate prices received by farmers and export prices received by traders for Paw San rice varieties.
However, Paw San rice production and marketing showed financially and economically profitable for Myanmar farmers within a decade even though there were undesirable policy environment for input and output sides. In addition, Paw San production and trading had comparative advantages under past and present production technologies and government intervention policies. If producers will have the higher export price with the higher yield level at the higher exchange rate, the more comparative advantage for the country can be assured. Paw San rice production and exporting has a potential for Myanmar to increase income of producers as well as to contribute to foreign exchange earnings for the country economy because financial returns to domestic producers were attractive even though there were distortions in market prices and other constraints.
To overcome labor scarcity and high labor cost at the peak season of Paw San production, farm mechanization technologies should be encouraged by providing farm machines such as power tillers/tractors, combine harvesters and power threshers to reduce labor intensive activities like land preparation and harvesting. To maintain long term comparative advantages in Paw San production, productivities and product quality should be enhanced by providing improved production technologies and postharvest management practices. Infrastructures such as farm to market road, processing plants and storage facilities should be developed in order to reduce logistic costs in rice export and to increase profitability. Government should also support the smooth flow of imported agrochemicals by setting up the flexible policies on import. Finally, government intervention policies should be focusing on facilitating open market trading with more transparent price information system along marketing channel for both inputs and outputs.
REFERENCES
Aye Moe San 2008. Comparative advantages of two exported rice varieties (Pawsan and Manawthukha) in the selected townships of Ayeyarwaddy Division. MSc. Thesis, Yezin Agricultural University, Myanmar.
Cho Cho Win 2013. Comparative advantage of selected rice varieties (Shwebo Pawsan and Ayeyarmin) in Shwebo township, Sagaing Region, MSc Thesis, Yezin Agricultural Univerisity, Myanmar.
Hnin Yu Lwin 2010. Economic evaluation of the potential of Myanmar rice market
under changing policy mix. PhD. Thesis, Kyushu University, Fukuoka, Japan.
Monke, E. A. and S. R. Person 1989. The Policy Analysis Matrix for agricultural development. Conell University Press, Ithaca and Landon.
Okamoto, I. 2013. Rice export and contract farming: Lessons from “Rice Specializing Companies”.
Phyu Lay Myint and O. Napasintuwong 2016. Economic analysis of Paw San rice adoption in Myanmar, DOI:10.3923/ajar.2016.175.184, Asian Journal of Agricultural Research.
Theing Myint and Aye Moe San 2018. Case study interview of Shwebo Paw San growers from Khin Oo Township, Sagaing Region.
Wong, L., And Wai, Eh. M. A. 2013. Rapid value chain assessment: Structure and dynamics of the rice value chain in Myanmar. Strategic agricultural sector and food security diagnostic for Myanmar. Background paper No. 6. Michigan State University and Myanmar Research and Development Institute: 1- 46.
World Bank 2014. Myanmar: Capitalizing on rice export opportunities. Economic and Sector Work Report No.85804, Southeast Asia Sustainable Development Unit, World Bank Group, Washington, DC.
Date submitted: Feb. 1, 2019
Reviewed, edited and uploaded: May. 30, 2019