ABSTRACT
Myanmar has the potential to increase its rice production, quality and exports. The rice industry remains the most important contributor to GDP, income and employment generation. Rice is grown in 34% of the the country’s total cultivated area in 2016. The labor engagement rate of rice is the highest and nearly three-fourths of farm household income. On the consumption side, rice contributes about 66% of the population’s daily calorie intake. Per capita rice consumption rate is about 155kg in average. Myanmar’s agricultural sector has good market forecast to accommodate higher rice exports. China is turning into a large net importer, and the European Union opened its profitable market for duty-free imports from Myanmar. Regarding the destination of rice export, it was mainly to China via border trade which was operated by high proportion of about 51.62% of the total trade volume in 2017/18. In the past, agricultural policies have intended to increase productivity through tax reduction, credit extension, seeds and fertilizer subsidies, price subsidies and food stockpiling. Paddy yields persist low compared to neighboring countries because lower levels of input use, ineffective weed and pest control, and poor water management. Myanmar controlled rice exports through export licenses which brought the favorable effects of low price to consumers, but, it also penalized farmers by significantly reducing their incentives to produce rice. In early 2017, a new agricultural sector policy was focused on improving farmer incomes and increased competitiveness. Recently in 2018, the minimum reference farm gate price of paddy was set to manage the price volatility during harvesting season. Myanmar’s rice value chain remains largely traditional. Improving the efficiency and quality of postharvest operations to reduce losses and improve the quality of rice will result in increased profitability of rice production. The critical interventions of the rice value chain are to improve productivity and efficiency of value chain segments and exporting high-quality rice and value added products. Economic liberalization, sector policy reforms, and better openness to innovation and international cooperation present promising signals for the Myanmar rice sector. Currently, mechanization, communications, and investments in new milling facilities are happening very rapidly. However, the seed system, extension service, finance, and land and water management are slowly scaled up. Higher rice export requires providing public services and a favorable investment macroclimate to improve farm productivity, efficiency of milling and trade logistics. A value chain modernization approach will be critically required with institutional innovations through strengthening public private coordination for the future of Myanmar’s rice industry.
Keywords: Agricultural policy, rice industry, rice exports, The minimum reference farm gate price, value chain, institutional innovation
INTRODUCTION
Rice is a vital crop for Myanmar and for Asia. Actually, rice dominates the agricultural sector which is the largest and most productive part of the Myanmar economy and is comprehensively tangled into the social and economic lives of the Myanmar people. Myanmar’s land and water resources are therefore an asset for its own people as well as for its neighbors. Myanmar is a rice surplus country and it has the distinct potential to increase rice production, rice quality and exports over the medium and long run. Changes in rice economy might have a direct and profound influence on the entire Myanmar economy.
At the same time, domestic and international consumers are demanding greater diversity, nutritional quality, and safety from their food systems. Therefore, future development of Myanmar’s rice-based cropping systems must be commenced in the framework of a diversified and sustainable food system that raises productivity and living standards for the benefit of all stakeholders. Moreover, Myanmar’s rice industry will require improvements in technology, institutional innovation and governance of all stages along the rice supply chain.
There is growing awareness among stakeholders in agricultural development that production along the supply chain is still short of its potential. Therefore, the various forces that have influenced on the rice industry are critically important to all stakeholders especially for decision makers for long-term rice industry development strategies.
The paper proceeds as the scene in terms of rice industry contribution to the country’s economy, production trend of Myanmar’s rice industry, then looks in depth at rice consumption, domestic demand and rice exports. In addition, key policy issues that need to be addressed will be discussed to ensure a bright future for Myanmar’s rice economy and finally conclusion.
CONTRIBUTION AND PRODUCTION OF MYANMAR RICE INDUSTRY
Rice contribution to country economy
Rice remains a strategic sector as the most important food crop. It is making important contributions to the country’s GDP, income and employment generation in Myanmar. In 2015-16, about 65.4% of the total population (52.2 million) is engaged in the agricultural sector in Myanmar. Rice is cultivated on 7.2 million ha representing 34% of the total crop sown area in 2015-16. Since rice is labor intensive, the labor absorption rate is highest in the rice industry and nearly three-fourths of farm household income is derived from rice farming and related activities, especially in the major rice grown areas in Myanmar (Department of Planning, 2016).
Journey of Myanmar’s rice industry: harvested area, yield and production
The development of Myanmar’s rice industry over the past century was accompanied by different policies under many government eras (Fig. 1). Even though there has been a consistent increasing trend in cultivated area, yield and total production of rice since the end of the Second World War, exports have not reached the level attained during the British colonial government era. In the early 1940s, the country produced about 8 million tons of paddy and became the world’s largest rice exporting country, reflecting the export-oriented commercial agriculture system encouraged by the British government.
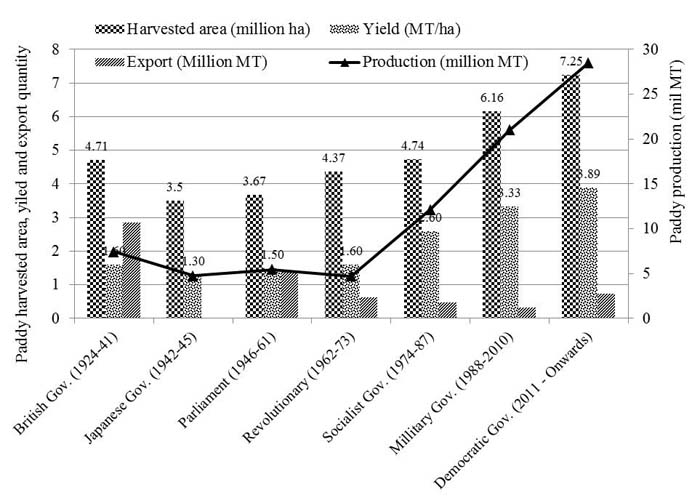
Fig. 1. Rice sector developments in different government era in Myanmar
Source: Theingi Myint 2007 and Department of Planning. 2016.
In 1995, Myanmar became a member of the World Trade Organization (WTO) and of the Association of South East Asian Nations (ASEAN) in 1997. The Myanmar government adopted market-oriented policy reforms consistent with economic globalization under the structural adjustment program via the encouragements of these two institutions. The policy reforms incorporated the removal of state control mechanism over production and marketing in agriculture, including the rice industry, in order to develop greater trade and industrial linkages among member countries (Wong and Wai, 2013).
The government of Myanmar changed to democracy and has started determined efforts to dispose of its recent history of isolation and preventive policies especially for economic reforms since 2011. The first notable policy in rice industry was the Farmland Law and the Vacant, Virgin and Fallow lands management law which was introduced in 2012. Land used rights became officially transferrable and eligible for mortgaging, and seasonal crop choice has been liberalized either. The second transformation was rice export tax, which was also reduced from 10% to 2%, although rice exporters must still obtain an export permit. The private sector expanded its role in paddy trading and milling by organizing the Myanmar Rice and Paddy Traders Association (MRPTA), then re-named as the Myanmar Rice Federation (MRF) in 2012.
Current production of Myanmar rice industry
In Myanmar, major paddy producing areas were categorized by ecological zones such as the delta, dry zone, coastal zone, and mountainous areas. Delta areas encompass of the Ayeyarwaddy, Bago and Yangon regions, dry zone includes including Mandalay, Sagaing, and Magway regions, coastal region is Thahnintharyi, Mon and Rakhine States, and mountainous areas are apart from above three areas in the country where are mountainous. Paddy grown area, yield and production by season in 2016/17 for each of the four main agro-ecological zones is shown in Table 1. Among the ecological zones, the delta region is the largest cultivated are in both seasons. The highest yield is found in dry zone during monsoon season and delta in summer season. Coastal areas are the lowest production among the regions (Table 1).
Table 1. Paddy productions by ecological zone and season, 2016-17
|
Growing season in Ecological zone
|
Cultivated Area
|
Harvested Area
|
Yielda
|
Productiona
|
|
('000 ha's)
|
('000 ha's)
|
(tons/ha)
|
(mn tons)
|
|
Monsoon
|
|
Delta
|
3,089
|
2,998
|
2.41
|
7,218
|
|
Dry Zone
|
1,295
|
1,292
|
2.76
|
3,564
|
|
Coastal
|
825
|
825
|
2.22
|
1,836
|
|
Mountainous
|
957
|
956
|
2.40
|
2,296
|
|
Total
|
6,167
|
6,071
|
2.46
|
14,914
|
|
Summer
|
|
Delta
|
697
|
697
|
3.13
|
2,184
|
|
Dry Zone
|
205
|
203
|
1.97
|
400
|
|
Coastal
|
25
|
25
|
2.57
|
65
|
|
Mountainous
|
70
|
66
|
6.54
|
432
|
|
Total
|
994
|
992
|
3.11
|
3,082
|
|
Total (2 Seasons)
|
|
Delta
|
3,787
|
3,695
|
2.54
|
9,403
|
|
Dry Zone
|
1,500
|
1,495
|
2.65
|
3,964
|
|
Coastal
|
851
|
850
|
2.23
|
1,901
|
|
Mountainous
|
1,023
|
1,022
|
2.67
|
2,729
|
|
Total
|
7,161
|
7,063
|
2.55
|
17,996
|
a Milled rice equivalent (using a milling ratio of 0.65 kgs of milled rice per 1.0 kg of paddy).
Source: DOA, MOALI, 2016.
In 2016/17, about 83% of the annual production is harvested during the monsoon season and the remaining only 17% during the summer season. About 48% of the total production in monsoon season was grown from the delta (Table 2). About 24% is produced in the dry zone; the rest is produced from the coastal regions and mountainous areas. In the summer season, about 71% of paddy production comes from the delta, 13% of total production grows in dry zone and the rest are from coastal and mountainous areas. Total paddy production comprises of primarily zone 52% in delta and 22% in dry zone in 2016/17 (Table 2).
Table 2. Myanmar paddy production share by ecological zone and season, 2016-17
|
Ecological zones
|
Monsoon
|
Summer
|
Total
(%)
|
|
Season
(%)
|
Total
(%)
|
Season
(%)
|
Total
(%)
|
|
Delta
|
48.4
|
40.1
|
70.9
|
12.1
|
52.2
|
|
Dry Zone
|
23.9
|
19.8
|
13.0
|
2.2
|
22.0
|
|
Coastal
|
12.3
|
10.2
|
2.1
|
0.4
|
10.6
|
|
Mountainous
|
15.4
|
12.8
|
14.0
|
2.4
|
15.2
|
|
Total
|
100.0
|
82.9
|
100.0
|
17.1
|
100.0
|
Source: DOA, MOALI, 2016.
DEMAND OF MYANMAR RICE INDUSTRY
Domestic rice consumption
Rice constitutes a high share of the caloric diet of the population of ASEAN countries. Rice consumption by ASEAN countries accounts for 22% of the world total. The growth in the region’s total rice consumption is driven by population growth of 1.1% annually, outweighing small declines in average per capita use (Wailes et. al, 2012).
Rice is the most important food crop of Myanmar and it remains a strategic sector in terms of its contribution to gross domestic product (GDP), income, and employment generation. Rice is the major source of the energy for the Myanmar people as it contributes about 73 and 80% of the total daily dietary energy requirement in urban and rural households, respectively (CSO, 2012). Regarding the calorie intake, World Bank study in 2015 showed that rice and cereal contributed about 66% while percentage of food spending was about 21.4% in 2015.
Generally, rice also carries the largest weight in the Consumer Price Index, accounting for 17% on average and 27% for low-income groups (CSO 2012). The average share of rice in total household expenditure declined from 30.1% in 1989 to 13.6 % in 2005 and, with the exception of the world food price crisis of 2008/9, continued to fall to 13.0% in 2016. The trend line in Fig. 2 is showing clearly the decreasing trend of rice expenditure in Myanmar (Theingi Myint et al., 2016).
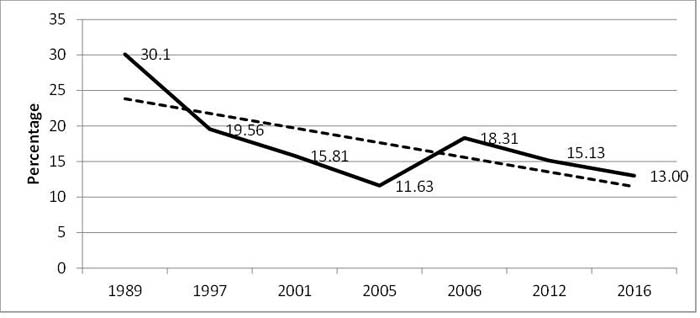
Fig. 2. Percentage of average rice expenditure in Myanmar (1989-2016)
Source: CSO, 2015 & Theingi Myint et al., 2016.
According to the Central Statistical Organization data in 2015, the rural rice expenditure share in food expenditure was greater than that of urban over two decades because income growth, relative price changes and urbanization have altered dietary patterns in Myanmar (Fig. 3). According to the recent consumption study in 2016, average per capita consumption in Myanmar was 155 kg per year. The minimum per capita rice consumption was 43 kg per year and maximum rate was 326 kg per year. the average per capita rice consumption of urban people in Union was 133.07 Kg and rural people was 164.80 Kg. Total union rice consumption was about 8 million ton per year in which total rice consumption of urban was 2 million ton per year and rural people was 6 million ton per year.
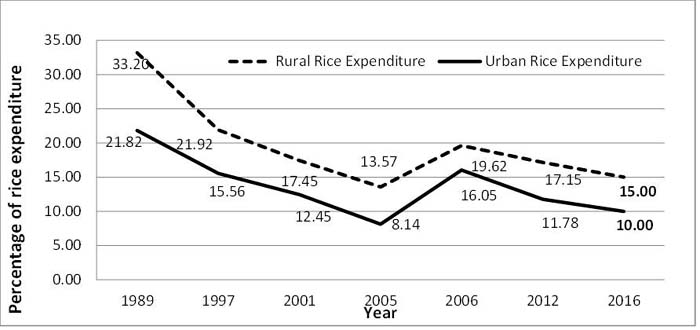
Fig. 3. Average rice expenditure percentages of rural and urban households in Myanmar (1989-2016)
Source: CSO, 2015 & Theingi Myint et al., 2016.
Among the urban consumers, per capita rice consumption of different income groups was not significantly different from each other in quantity terms, while the lower income landless consumers consumed more rice than higher income landless. However, farmer consumed more rice regardless of their farm size. Therefore, effect of income on rice consumption was found in landless consumer, no income effect in rice consumption of urban and farmer consumers in Myanmar (Theingi Myint et. al., 2016).
Myanmar’S rice export: volume, type and destination
Myanmar’s rice sector is characterized as market oriented whereby farmers and private sector are active stakeholders. Within the context of a market economy, Myanmar has consistently set the highest priority on the rice sector as food security is a first priority, then the social and political significance for the country being not only self-sufficient in rice but also a rice export.
The target of rice production that fulfills both domestic and export requirements was set by of the Myanmar Agricultural Sector. The target is the paddy production must reach at least 19.40 million metric tons, about 60% of which is for local food consumption and 40% for international trade by 2030. The target will be achieved by 7.70 million hectares (ha) of rice harvested area with an annual average yield of at least 4.20 MT/ha per cropping season.
Regarding the liberalizing export policy through border trade, in 2012/13 rice export was reached the highest o 1.3 million ton during 48 years. After that 2015/16, the exports were increased up 1.8 million ton, calling for the continuation of reforms to achieve the above export targets. However, rice export was decrease due to the heavy flood in 2015/16 (Table 3). Even though the export was lagged behind the target, there are good market prospects to accommodate higher rice exports for Myanmar. The global demand for rice is projected to continue growing, at least during the next 10-15 years. China is turning into a large net importer of rice, and the European Union opened its lucrative market for duty-free imports from Myanmar.
Regarding the destination of Myanmar rice export, it was mainly exported to ASEAN plus three group especially to China during 2012/13 to 2014/15. Myanmar rice export to ASEAN plus three group was 53.6% in 2012/13 and it was up to 76.1% total export volume in 2014/15. Some export amount went to EU which was gradually increasing during 2012/13 to 2014/15 from 5.4 % to 11.1% of total export volume (Table 4).
Table 3. National Rice Balance 2008 to 2016 (‘000 tons, milled rice equivalent)
|
Year
|
Production
|
Consumption
|
Exports
|
Ending Stocks
|
|
2008/2009
|
11,200
|
18,800
|
1,052
|
548
|
|
2009/2010
|
11,642
|
10,890
|
700
|
600
|
|
2010/2011
|
11,060
|
10,100
|
1,075
|
485
|
|
2011/2012
|
11,473
|
10,200
|
1,357
|
401
|
|
2012/2013
|
11,715
|
10,400
|
1,163
|
553
|
|
2013/2014
|
11,957
|
10,450
|
1,688
|
372
|
|
2014/2015
|
12,600
|
10,550
|
1,734
|
422
|
|
2015/2016
|
12,200
|
10,650
|
1,800
|
518
|
|
2016/2017
|
12,500
|
10,750
|
1,600
|
668
|
Source: USDA
Table 4. Myanmar rice export by destination, 2012/13 -2014/15
|
Destination Group
|
Percentage of rice export destination
|
|
2012/13
|
2013/14
|
2014/15
|
|
EU
|
5.4
|
5.7
|
11.1
|
|
ASEAN
|
18.2
|
11.8
|
5.4
|
|
(ASEAN) + 3
|
53.6
|
73.8
|
76.1
|
|
Middle East
|
0.7
|
0.7
|
1.8
|
|
Africa
|
14.2
|
0.2
|
0.2
|
|
Other
|
7.9
|
7.8
|
5.4
|
|
Total All Trade
|
100
|
100
|
100
|
Note: Border Trade involves Thailand - under ASEAN Group; China - under (ASEAN) Plus 3 Group; and Bangladesh and India under Other Group.
Source: Ministry of Commerce and Customs via Myanmar Rice Federation
Rice export of Myanmar is mainly made up of white long grain, white short grain and broken rice. However, white long grain export was decreasing trend from 2012/13 to 2015/16 (74.86% to 29.54%), it was increased up again 42.83% of total rice export volume in 2016/17. White short grain and broken rice export were found increasing during these years while glutinous rice and other rice export were decreasing (Table 5).
Table 5. Myanmar rice export by type of rice, 2012/13 -2016/17
|
Type of rice
|
2012-13
|
2013-14
|
2014-15
|
2015-16
|
2016-17
|
| |
|
|
(Percentage)
|
|
|
White Long Grain
|
74.86
|
68.47
|
45.13
|
29.57
|
42.83
|
|
White Short Grain
|
15.25
|
9.44
|
30.09
|
43.92
|
31.66
|
|
Parboiled Rice
|
0.01
|
0.22
|
0.98
|
1.69
|
0.94
|
|
Glutinous Rice
|
1.63
|
2.32
|
0.97
|
0.52
|
0.14
|
|
Other Rice
|
0.74
|
0.00
|
0.35
|
0.00
|
0.00
|
|
Broken Rice
|
7.52
|
19.55
|
22.48
|
24.31
|
24.42
|
|
Total
|
100
|
100
|
100
|
100
|
100
|
Rice export was increased up to around 4 million metric ton in 2017/18. The rice export was mainly to ASEAN by border trade up to 2016/17 however, oversea trade to other destination was also upturn to nearly half of the total export in 2017/18 (Table 6). The major buyers of Myanmar white rice are China, Bangladesh and Cote d'ivoire and the top three importers of broken rice are Belgium, China and Indonesia in 2017/18 (Ministry of Commerce, March 2018).
Table 6. Rice export by Type of trade in 2017/2018 (up to 23 March 2018)
|
Type of trade
|
Trade Volume (MT)
|
Ratio of trade by type
|
|
Border Trade
|
1811747.627
|
51.62
|
|
Oversea Trade
|
1698266.070
|
48.38
|
|
Total
|
3510013.697
|
100.00
|
Source: Ministry of Commerce, March 2018.
POLICIES TOWARDS VALUE ADDITION AND EXPORT
In the past, Myanmar agricultural policies have targeted to increase productivity through tax reduction, credit extension, seed and fertilizer subsidies, price subsidies and food stockpiling. Trade restrictions have also been enforced to control increased prices of agricultural commodities and to ensure sufficient supplies for domestic markets, as with rice during the 2007-2008 crisis. The above policy responses, however, are no longer considered passable in the face of growing complexities in food security ecosystems. Paddy yields remain low compared to Myanmar’s neighbors because of lower levels of input use, particularly improved seeds and fertilizer, inefficient weed and pest control, and uncertain water management (Denning and others 2013).
Over the last six decades, and up to as recently as three years ago, Myanmar’s food security strategy focused on making sure that rice was available at affordable prices. The motivation behind this strategy was that Myanmar’s urban residents and large rural population of landless poor (estimated at 30 % of the total rural population) are important consumers of rice whom access to affordable rice is critical to their survival from both economic and political perspectives. To pursue this strategy, the low price of rice benefited consumers, but, unfortunately, it also penalized farmers by significantly reducing their incentives to produce.
Fortunately, policies have improved over the last two years. In early 2017, the Ministry of Agriculture, Livestock and Irrigation (MOALI) published a new agricultural sector policy focused on improving farmer incomes and increased competitiveness. Recently in 2018, the minimum reference farm gate price of paddy was set to manage the price volatility during harvesting season. Economic liberalization, sector policy reforms, and greater openness to innovation and international cooperation present encouraging signals for the rice sector and for the agriculture sector as a whole. A recent statement from the Myanmar Rice Federation suggested an export target of 4 million MT is achievable by 2017/18. The challenge now is to work at improving productivity at three critical segments of the rice value chain.
Myanmar should aim to produce and sell increasing quantities of different qualities of rice more efficiently. Higher rice exports necessitate providing public services and a favorable investment climate to all farms, small and large, that would improve farm productivity, efficiency of milling and trade logistics serving both export and domestic markets. This strategy will allow Myanmar’s rice value chain stakeholders to better serve their local and overseas clients, earn higher incomes, capture the growing market of higher value rice, and diversify risks along different markets.
Myanmar’s rice value chain involves many stakeholders and remains largely traditional in nature. Improving the efficiency and quality of postharvest operations to reduce postharvest losses and improve the quality of the rice output will result in increased production of rice for domestic and export markets. For getting better quality paddy, the milling industry would be accelerated by modernization, creating non-farm jobs and stimulating economic growth. Net buyers of rice in rural and urban areas would benefit from the increased supplies and improved quality of rice, potentially at lower prices.
Upgrading rice mills requires access to long term credit, technical and managerial capacity and reliable electricity supply at a reasonable price. Myanmar’s electricity rates have long been subsidized, which has led to inadequate investment in new power sources and maintenance of existing plants and transmission lines. Therefore, planned investments in electricity generation over the next five years indicate supply increases of less than 5 % per year (Dapice 2012), while ADB forecasts that demand will increase by 13 % per annum from 2012 to 2018 (ADB 2012). In the absence of reliable electricity, rice millers were unwilling to invest to upgrade rice mills. The rice milling industry could take advantage of foreign direct investment (FDI) for modernization to overcome the limitation of domestic capital investment.
Improving the efficiency and quality of postharvest operations to reduce losses and improve the quality of rice will result in increased profitability of rice production. The critical interventions of the rice value chain are to improve productivity and efficiency of value chain segments and exporting high-quality rice and value added products. Economic liberalization, sector policy reforms, and better openness to innovation and international cooperation present promising signals for the Myanmar rice industry.
CONCLUSION
In Myanmar’s rice industry, currently, mechanization, communications, and investments in new milling facilities are happening very rapidly. However, the seed system, extension serviceS, finance, land and water management are slowly scaled up. To fulfill the target of rice export requires providing public services and a favorable investment macroclimate to improve farm productivity, efficiency of milling and trade logistics in internal then foreign direct investment from international. A value chain modernization approach will be critically required with institutional innovations through strengthening public private coordination for the future Myanmar rice industry. It should contribute to upgraded rice value chain with the ultimate objective of improving the well-being of present and future generations of rice farmers and consumers, particularly those with low incomes in Myanmar.
REFERENCES
CSO (Central Statistical Organization). 2012. Statistical Yearbook 2015. Ministry of National Planning and Economic Development. Nay Pyi Taw, Myanmar.
CSO (Central Statistical Organization). 2015. Statistical Yearbook 2015. Ministry of National Planning and Economic Development. Nay Pyi Taw, Myanmar
Denning, Glenn, Kye Baroang, Tun Min Sandar and other MDRI and MSU colleagues 2013. “Background Paper No. 2. Rice Productivity Improvement in Myanmar.”
Department of Planning. 2016b. Myanmar Agriculture in Brief. Ministry of Agriculture Livestock and Irrigation, The government of the Republic of the Union of Myanmar, 2016.
DOA (Department of Agriculture) MOALI. 2016. Annual Report. Ministry of Agriculture and Irrigation.Ministry of Commerce and Customs via Myanmar Rice Federation
Ministry of Commerce, March 2018. Official report through Myanmar Rice Federation, Yangon.
Theingi Myint, Nang Ei Mon The, Ei Mon Thidar Kyaw, Yee Mon Aung and Myint Myat Moe. 2016. Study on Per Capita Rice Consumption and Ratio of Household Expenditure in Myanmar (final report). (unpublished manuscript). Department of Agricultural Economics, Yezin Agricultural University, Naypyidaw, Myanmar.
Theingi Myint 2007. Myanmar rice market: Market integration and price causality. Ph.D thesis, Yezin Agricultural University, Yezin, Myanmar.
Wong, L., and Eh Mwee Aye Wai. 2013. Rapid value chain assessment: Structure and dynamics of the rice value chain in Myanmar. Strategic agricultural sector and food security diagnostic for Myanmar. Background paper No. 6. Michigan State University and Myanmar Research and Development Institute.
| (Submitted as a paper for the International Seminar on “Promoting Rice Farmers’ Market through value-adding Activities”, June 6-7, 2018, Kasetsart University, Thailand) |

Myanmar’s Rice Industry and Policies toward Value Addition and Export
ABSTRACT
Myanmar has the potential to increase its rice production, quality and exports. The rice industry remains the most important contributor to GDP, income and employment generation. Rice is grown in 34% of the the country’s total cultivated area in 2016. The labor engagement rate of rice is the highest and nearly three-fourths of farm household income. On the consumption side, rice contributes about 66% of the population’s daily calorie intake. Per capita rice consumption rate is about 155kg in average. Myanmar’s agricultural sector has good market forecast to accommodate higher rice exports. China is turning into a large net importer, and the European Union opened its profitable market for duty-free imports from Myanmar. Regarding the destination of rice export, it was mainly to China via border trade which was operated by high proportion of about 51.62% of the total trade volume in 2017/18. In the past, agricultural policies have intended to increase productivity through tax reduction, credit extension, seeds and fertilizer subsidies, price subsidies and food stockpiling. Paddy yields persist low compared to neighboring countries because lower levels of input use, ineffective weed and pest control, and poor water management. Myanmar controlled rice exports through export licenses which brought the favorable effects of low price to consumers, but, it also penalized farmers by significantly reducing their incentives to produce rice. In early 2017, a new agricultural sector policy was focused on improving farmer incomes and increased competitiveness. Recently in 2018, the minimum reference farm gate price of paddy was set to manage the price volatility during harvesting season. Myanmar’s rice value chain remains largely traditional. Improving the efficiency and quality of postharvest operations to reduce losses and improve the quality of rice will result in increased profitability of rice production. The critical interventions of the rice value chain are to improve productivity and efficiency of value chain segments and exporting high-quality rice and value added products. Economic liberalization, sector policy reforms, and better openness to innovation and international cooperation present promising signals for the Myanmar rice sector. Currently, mechanization, communications, and investments in new milling facilities are happening very rapidly. However, the seed system, extension service, finance, and land and water management are slowly scaled up. Higher rice export requires providing public services and a favorable investment macroclimate to improve farm productivity, efficiency of milling and trade logistics. A value chain modernization approach will be critically required with institutional innovations through strengthening public private coordination for the future of Myanmar’s rice industry.
Keywords: Agricultural policy, rice industry, rice exports, The minimum reference farm gate price, value chain, institutional innovation
INTRODUCTION
Rice is a vital crop for Myanmar and for Asia. Actually, rice dominates the agricultural sector which is the largest and most productive part of the Myanmar economy and is comprehensively tangled into the social and economic lives of the Myanmar people. Myanmar’s land and water resources are therefore an asset for its own people as well as for its neighbors. Myanmar is a rice surplus country and it has the distinct potential to increase rice production, rice quality and exports over the medium and long run. Changes in rice economy might have a direct and profound influence on the entire Myanmar economy.
At the same time, domestic and international consumers are demanding greater diversity, nutritional quality, and safety from their food systems. Therefore, future development of Myanmar’s rice-based cropping systems must be commenced in the framework of a diversified and sustainable food system that raises productivity and living standards for the benefit of all stakeholders. Moreover, Myanmar’s rice industry will require improvements in technology, institutional innovation and governance of all stages along the rice supply chain.
There is growing awareness among stakeholders in agricultural development that production along the supply chain is still short of its potential. Therefore, the various forces that have influenced on the rice industry are critically important to all stakeholders especially for decision makers for long-term rice industry development strategies.
The paper proceeds as the scene in terms of rice industry contribution to the country’s economy, production trend of Myanmar’s rice industry, then looks in depth at rice consumption, domestic demand and rice exports. In addition, key policy issues that need to be addressed will be discussed to ensure a bright future for Myanmar’s rice economy and finally conclusion.
CONTRIBUTION AND PRODUCTION OF MYANMAR RICE INDUSTRY
Rice contribution to country economy
Rice remains a strategic sector as the most important food crop. It is making important contributions to the country’s GDP, income and employment generation in Myanmar. In 2015-16, about 65.4% of the total population (52.2 million) is engaged in the agricultural sector in Myanmar. Rice is cultivated on 7.2 million ha representing 34% of the total crop sown area in 2015-16. Since rice is labor intensive, the labor absorption rate is highest in the rice industry and nearly three-fourths of farm household income is derived from rice farming and related activities, especially in the major rice grown areas in Myanmar (Department of Planning, 2016).
Journey of Myanmar’s rice industry: harvested area, yield and production
The development of Myanmar’s rice industry over the past century was accompanied by different policies under many government eras (Fig. 1). Even though there has been a consistent increasing trend in cultivated area, yield and total production of rice since the end of the Second World War, exports have not reached the level attained during the British colonial government era. In the early 1940s, the country produced about 8 million tons of paddy and became the world’s largest rice exporting country, reflecting the export-oriented commercial agriculture system encouraged by the British government.
Fig. 1. Rice sector developments in different government era in Myanmar
Source: Theingi Myint 2007 and Department of Planning. 2016.
In 1995, Myanmar became a member of the World Trade Organization (WTO) and of the Association of South East Asian Nations (ASEAN) in 1997. The Myanmar government adopted market-oriented policy reforms consistent with economic globalization under the structural adjustment program via the encouragements of these two institutions. The policy reforms incorporated the removal of state control mechanism over production and marketing in agriculture, including the rice industry, in order to develop greater trade and industrial linkages among member countries (Wong and Wai, 2013).
The government of Myanmar changed to democracy and has started determined efforts to dispose of its recent history of isolation and preventive policies especially for economic reforms since 2011. The first notable policy in rice industry was the Farmland Law and the Vacant, Virgin and Fallow lands management law which was introduced in 2012. Land used rights became officially transferrable and eligible for mortgaging, and seasonal crop choice has been liberalized either. The second transformation was rice export tax, which was also reduced from 10% to 2%, although rice exporters must still obtain an export permit. The private sector expanded its role in paddy trading and milling by organizing the Myanmar Rice and Paddy Traders Association (MRPTA), then re-named as the Myanmar Rice Federation (MRF) in 2012.
Current production of Myanmar rice industry
In Myanmar, major paddy producing areas were categorized by ecological zones such as the delta, dry zone, coastal zone, and mountainous areas. Delta areas encompass of the Ayeyarwaddy, Bago and Yangon regions, dry zone includes including Mandalay, Sagaing, and Magway regions, coastal region is Thahnintharyi, Mon and Rakhine States, and mountainous areas are apart from above three areas in the country where are mountainous. Paddy grown area, yield and production by season in 2016/17 for each of the four main agro-ecological zones is shown in Table 1. Among the ecological zones, the delta region is the largest cultivated are in both seasons. The highest yield is found in dry zone during monsoon season and delta in summer season. Coastal areas are the lowest production among the regions (Table 1).
Table 1. Paddy productions by ecological zone and season, 2016-17
Growing season in Ecological zone
Cultivated Area
Harvested Area
Yielda
Productiona
('000 ha's)
('000 ha's)
(tons/ha)
(mn tons)
Monsoon
Delta
3,089
2,998
2.41
7,218
Dry Zone
1,295
1,292
2.76
3,564
Coastal
825
825
2.22
1,836
Mountainous
957
956
2.40
2,296
Total
6,167
6,071
2.46
14,914
Summer
Delta
697
697
3.13
2,184
Dry Zone
205
203
1.97
400
Coastal
25
25
2.57
65
Mountainous
70
66
6.54
432
Total
994
992
3.11
3,082
Total (2 Seasons)
Delta
3,787
3,695
2.54
9,403
Dry Zone
1,500
1,495
2.65
3,964
Coastal
851
850
2.23
1,901
Mountainous
1,023
1,022
2.67
2,729
Total
7,161
7,063
2.55
17,996
a Milled rice equivalent (using a milling ratio of 0.65 kgs of milled rice per 1.0 kg of paddy).
Source: DOA, MOALI, 2016.
In 2016/17, about 83% of the annual production is harvested during the monsoon season and the remaining only 17% during the summer season. About 48% of the total production in monsoon season was grown from the delta (Table 2). About 24% is produced in the dry zone; the rest is produced from the coastal regions and mountainous areas. In the summer season, about 71% of paddy production comes from the delta, 13% of total production grows in dry zone and the rest are from coastal and mountainous areas. Total paddy production comprises of primarily zone 52% in delta and 22% in dry zone in 2016/17 (Table 2).
Table 2. Myanmar paddy production share by ecological zone and season, 2016-17
Ecological zones
Monsoon
Summer
Total
(%)
Season
(%)
Total
(%)
Season
(%)
Total
(%)
Delta
48.4
40.1
70.9
12.1
52.2
Dry Zone
23.9
19.8
13.0
2.2
22.0
Coastal
12.3
10.2
2.1
0.4
10.6
Mountainous
15.4
12.8
14.0
2.4
15.2
Total
100.0
82.9
100.0
17.1
100.0
Source: DOA, MOALI, 2016.
DEMAND OF MYANMAR RICE INDUSTRY
Domestic rice consumption
Rice constitutes a high share of the caloric diet of the population of ASEAN countries. Rice consumption by ASEAN countries accounts for 22% of the world total. The growth in the region’s total rice consumption is driven by population growth of 1.1% annually, outweighing small declines in average per capita use (Wailes et. al, 2012).
Rice is the most important food crop of Myanmar and it remains a strategic sector in terms of its contribution to gross domestic product (GDP), income, and employment generation. Rice is the major source of the energy for the Myanmar people as it contributes about 73 and 80% of the total daily dietary energy requirement in urban and rural households, respectively (CSO, 2012). Regarding the calorie intake, World Bank study in 2015 showed that rice and cereal contributed about 66% while percentage of food spending was about 21.4% in 2015.
Generally, rice also carries the largest weight in the Consumer Price Index, accounting for 17% on average and 27% for low-income groups (CSO 2012). The average share of rice in total household expenditure declined from 30.1% in 1989 to 13.6 % in 2005 and, with the exception of the world food price crisis of 2008/9, continued to fall to 13.0% in 2016. The trend line in Fig. 2 is showing clearly the decreasing trend of rice expenditure in Myanmar (Theingi Myint et al., 2016).
Fig. 2. Percentage of average rice expenditure in Myanmar (1989-2016)
Source: CSO, 2015 & Theingi Myint et al., 2016.
According to the Central Statistical Organization data in 2015, the rural rice expenditure share in food expenditure was greater than that of urban over two decades because income growth, relative price changes and urbanization have altered dietary patterns in Myanmar (Fig. 3). According to the recent consumption study in 2016, average per capita consumption in Myanmar was 155 kg per year. The minimum per capita rice consumption was 43 kg per year and maximum rate was 326 kg per year. the average per capita rice consumption of urban people in Union was 133.07 Kg and rural people was 164.80 Kg. Total union rice consumption was about 8 million ton per year in which total rice consumption of urban was 2 million ton per year and rural people was 6 million ton per year.
Fig. 3. Average rice expenditure percentages of rural and urban households in Myanmar (1989-2016)
Source: CSO, 2015 & Theingi Myint et al., 2016.
Among the urban consumers, per capita rice consumption of different income groups was not significantly different from each other in quantity terms, while the lower income landless consumers consumed more rice than higher income landless. However, farmer consumed more rice regardless of their farm size. Therefore, effect of income on rice consumption was found in landless consumer, no income effect in rice consumption of urban and farmer consumers in Myanmar (Theingi Myint et. al., 2016).
Myanmar’S rice export: volume, type and destination
Myanmar’s rice sector is characterized as market oriented whereby farmers and private sector are active stakeholders. Within the context of a market economy, Myanmar has consistently set the highest priority on the rice sector as food security is a first priority, then the social and political significance for the country being not only self-sufficient in rice but also a rice export.
The target of rice production that fulfills both domestic and export requirements was set by of the Myanmar Agricultural Sector. The target is the paddy production must reach at least 19.40 million metric tons, about 60% of which is for local food consumption and 40% for international trade by 2030. The target will be achieved by 7.70 million hectares (ha) of rice harvested area with an annual average yield of at least 4.20 MT/ha per cropping season.
Regarding the liberalizing export policy through border trade, in 2012/13 rice export was reached the highest o 1.3 million ton during 48 years. After that 2015/16, the exports were increased up 1.8 million ton, calling for the continuation of reforms to achieve the above export targets. However, rice export was decrease due to the heavy flood in 2015/16 (Table 3). Even though the export was lagged behind the target, there are good market prospects to accommodate higher rice exports for Myanmar. The global demand for rice is projected to continue growing, at least during the next 10-15 years. China is turning into a large net importer of rice, and the European Union opened its lucrative market for duty-free imports from Myanmar.
Regarding the destination of Myanmar rice export, it was mainly exported to ASEAN plus three group especially to China during 2012/13 to 2014/15. Myanmar rice export to ASEAN plus three group was 53.6% in 2012/13 and it was up to 76.1% total export volume in 2014/15. Some export amount went to EU which was gradually increasing during 2012/13 to 2014/15 from 5.4 % to 11.1% of total export volume (Table 4).
Table 3. National Rice Balance 2008 to 2016 (‘000 tons, milled rice equivalent)
Year
Production
Consumption
Exports
Ending Stocks
2008/2009
11,200
18,800
1,052
548
2009/2010
11,642
10,890
700
600
2010/2011
11,060
10,100
1,075
485
2011/2012
11,473
10,200
1,357
401
2012/2013
11,715
10,400
1,163
553
2013/2014
11,957
10,450
1,688
372
2014/2015
12,600
10,550
1,734
422
2015/2016
12,200
10,650
1,800
518
2016/2017
12,500
10,750
1,600
668
Source: USDA
Table 4. Myanmar rice export by destination, 2012/13 -2014/15
Destination Group
Percentage of rice export destination
2012/13
2013/14
2014/15
EU
5.4
5.7
11.1
ASEAN
18.2
11.8
5.4
(ASEAN) + 3
53.6
73.8
76.1
Middle East
0.7
0.7
1.8
Africa
14.2
0.2
0.2
Other
7.9
7.8
5.4
Total All Trade
100
100
100
Note: Border Trade involves Thailand - under ASEAN Group; China - under (ASEAN) Plus 3 Group; and Bangladesh and India under Other Group.
Source: Ministry of Commerce and Customs via Myanmar Rice Federation
Rice export of Myanmar is mainly made up of white long grain, white short grain and broken rice. However, white long grain export was decreasing trend from 2012/13 to 2015/16 (74.86% to 29.54%), it was increased up again 42.83% of total rice export volume in 2016/17. White short grain and broken rice export were found increasing during these years while glutinous rice and other rice export were decreasing (Table 5).
Table 5. Myanmar rice export by type of rice, 2012/13 -2016/17
Type of rice
2012-13
2013-14
2014-15
2015-16
2016-17
(Percentage)
White Long Grain
74.86
68.47
45.13
29.57
42.83
White Short Grain
15.25
9.44
30.09
43.92
31.66
Parboiled Rice
0.01
0.22
0.98
1.69
0.94
Glutinous Rice
1.63
2.32
0.97
0.52
0.14
Other Rice
0.74
0.00
0.35
0.00
0.00
Broken Rice
7.52
19.55
22.48
24.31
24.42
Total
100
100
100
100
100
Rice export was increased up to around 4 million metric ton in 2017/18. The rice export was mainly to ASEAN by border trade up to 2016/17 however, oversea trade to other destination was also upturn to nearly half of the total export in 2017/18 (Table 6). The major buyers of Myanmar white rice are China, Bangladesh and Cote d'ivoire and the top three importers of broken rice are Belgium, China and Indonesia in 2017/18 (Ministry of Commerce, March 2018).
Table 6. Rice export by Type of trade in 2017/2018 (up to 23 March 2018)
Type of trade
Trade Volume (MT)
Ratio of trade by type
Border Trade
1811747.627
51.62
Oversea Trade
1698266.070
48.38
Total
3510013.697
100.00
Source: Ministry of Commerce, March 2018.
POLICIES TOWARDS VALUE ADDITION AND EXPORT
In the past, Myanmar agricultural policies have targeted to increase productivity through tax reduction, credit extension, seed and fertilizer subsidies, price subsidies and food stockpiling. Trade restrictions have also been enforced to control increased prices of agricultural commodities and to ensure sufficient supplies for domestic markets, as with rice during the 2007-2008 crisis. The above policy responses, however, are no longer considered passable in the face of growing complexities in food security ecosystems. Paddy yields remain low compared to Myanmar’s neighbors because of lower levels of input use, particularly improved seeds and fertilizer, inefficient weed and pest control, and uncertain water management (Denning and others 2013).
Over the last six decades, and up to as recently as three years ago, Myanmar’s food security strategy focused on making sure that rice was available at affordable prices. The motivation behind this strategy was that Myanmar’s urban residents and large rural population of landless poor (estimated at 30 % of the total rural population) are important consumers of rice whom access to affordable rice is critical to their survival from both economic and political perspectives. To pursue this strategy, the low price of rice benefited consumers, but, unfortunately, it also penalized farmers by significantly reducing their incentives to produce.
Fortunately, policies have improved over the last two years. In early 2017, the Ministry of Agriculture, Livestock and Irrigation (MOALI) published a new agricultural sector policy focused on improving farmer incomes and increased competitiveness. Recently in 2018, the minimum reference farm gate price of paddy was set to manage the price volatility during harvesting season. Economic liberalization, sector policy reforms, and greater openness to innovation and international cooperation present encouraging signals for the rice sector and for the agriculture sector as a whole. A recent statement from the Myanmar Rice Federation suggested an export target of 4 million MT is achievable by 2017/18. The challenge now is to work at improving productivity at three critical segments of the rice value chain.
Myanmar should aim to produce and sell increasing quantities of different qualities of rice more efficiently. Higher rice exports necessitate providing public services and a favorable investment climate to all farms, small and large, that would improve farm productivity, efficiency of milling and trade logistics serving both export and domestic markets. This strategy will allow Myanmar’s rice value chain stakeholders to better serve their local and overseas clients, earn higher incomes, capture the growing market of higher value rice, and diversify risks along different markets.
Myanmar’s rice value chain involves many stakeholders and remains largely traditional in nature. Improving the efficiency and quality of postharvest operations to reduce postharvest losses and improve the quality of the rice output will result in increased production of rice for domestic and export markets. For getting better quality paddy, the milling industry would be accelerated by modernization, creating non-farm jobs and stimulating economic growth. Net buyers of rice in rural and urban areas would benefit from the increased supplies and improved quality of rice, potentially at lower prices.
Upgrading rice mills requires access to long term credit, technical and managerial capacity and reliable electricity supply at a reasonable price. Myanmar’s electricity rates have long been subsidized, which has led to inadequate investment in new power sources and maintenance of existing plants and transmission lines. Therefore, planned investments in electricity generation over the next five years indicate supply increases of less than 5 % per year (Dapice 2012), while ADB forecasts that demand will increase by 13 % per annum from 2012 to 2018 (ADB 2012). In the absence of reliable electricity, rice millers were unwilling to invest to upgrade rice mills. The rice milling industry could take advantage of foreign direct investment (FDI) for modernization to overcome the limitation of domestic capital investment.
Improving the efficiency and quality of postharvest operations to reduce losses and improve the quality of rice will result in increased profitability of rice production. The critical interventions of the rice value chain are to improve productivity and efficiency of value chain segments and exporting high-quality rice and value added products. Economic liberalization, sector policy reforms, and better openness to innovation and international cooperation present promising signals for the Myanmar rice industry.
CONCLUSION
In Myanmar’s rice industry, currently, mechanization, communications, and investments in new milling facilities are happening very rapidly. However, the seed system, extension serviceS, finance, land and water management are slowly scaled up. To fulfill the target of rice export requires providing public services and a favorable investment macroclimate to improve farm productivity, efficiency of milling and trade logistics in internal then foreign direct investment from international. A value chain modernization approach will be critically required with institutional innovations through strengthening public private coordination for the future Myanmar rice industry. It should contribute to upgraded rice value chain with the ultimate objective of improving the well-being of present and future generations of rice farmers and consumers, particularly those with low incomes in Myanmar.
REFERENCES
CSO (Central Statistical Organization). 2012. Statistical Yearbook 2015. Ministry of National Planning and Economic Development. Nay Pyi Taw, Myanmar.
CSO (Central Statistical Organization). 2015. Statistical Yearbook 2015. Ministry of National Planning and Economic Development. Nay Pyi Taw, Myanmar
Denning, Glenn, Kye Baroang, Tun Min Sandar and other MDRI and MSU colleagues 2013. “Background Paper No. 2. Rice Productivity Improvement in Myanmar.”
Department of Planning. 2016b. Myanmar Agriculture in Brief. Ministry of Agriculture Livestock and Irrigation, The government of the Republic of the Union of Myanmar, 2016.
DOA (Department of Agriculture) MOALI. 2016. Annual Report. Ministry of Agriculture and Irrigation.Ministry of Commerce and Customs via Myanmar Rice Federation
Ministry of Commerce, March 2018. Official report through Myanmar Rice Federation, Yangon.
Theingi Myint, Nang Ei Mon The, Ei Mon Thidar Kyaw, Yee Mon Aung and Myint Myat Moe. 2016. Study on Per Capita Rice Consumption and Ratio of Household Expenditure in Myanmar (final report). (unpublished manuscript). Department of Agricultural Economics, Yezin Agricultural University, Naypyidaw, Myanmar.
Theingi Myint 2007. Myanmar rice market: Market integration and price causality. Ph.D thesis, Yezin Agricultural University, Yezin, Myanmar.
Wong, L., and Eh Mwee Aye Wai. 2013. Rapid value chain assessment: Structure and dynamics of the rice value chain in Myanmar. Strategic agricultural sector and food security diagnostic for Myanmar. Background paper No. 6. Michigan State University and Myanmar Research and Development Institute.