ABSTRACT
Rice is one of the strategic commodities in Indonesia. Government intervention plays a significant role in Indonesian rice economy. A large input subsidy was delivered to rice farmers. Price policies were introduced annually. However, in Indonesia, rice is currently produced at the highest cost compared to the costs spent by some peers in Asia. From the farm gate to the market, rice is transported through a long supply chain. Uncompetitive markets are dominant along the chain. This study employed field and time-series data of regional rice markets to investigate the marketing efficiency, from both technical and price perspectives. The results show that in general, the value chain still needs many improvements regarding unbalanced marketing margin received by the actors. Price analysis shows the asymmetric condition among the producer and retail markets. The current rice price policy worsens the market situation, thus the Government of Indonesia is suggested to improve the rice price policy.
Keywords: rice competitiveness, supply chain, price transmission
INTRODUCTION
The better fulfillment of food and nutrition for the community has become a global commitment (SDG). The utilization of resources for the achievement of these objectives should be carefully thought out in order to achieve sustainable results, not just for the achievement of temporary goals. This principle should also be implemented along the supply chain, including rice, starting from farmers to products available at the consumers’ tables. The whole process should provide a balanced economic value so that trade fairness can be obtained.
In Indonesia, the rice economy is one of the issues that have continuously been discussed by many for a long time. One important issue is the rice price in the consumer market in Indonesia which is higher than that in many other producer countries. The rice price in the domestic market reaches US $ 1 per kg, one and a half to twice the price in other countries. The causes are long rice supply chain, lack of policy control, and rice farmers' production which has no comparative advantage. Based on the IRRI publication (2006), from six rice producing countries in Asia, it turns out that the farmers in Indonesia have to spend the highest cost to produce 1 kg of harvest dry rice. Overall, the cost incurred by Indonesian farmers is two and a half times the cost paid by the farmers in Vietnam, or nearly twice as many as the cost spent by the farmers in Thailand and India. The largest cost components paid by farmers are for paying labor and land rent (calculated). The expenditure on inputs, such as urea fertilizer which is suspected to be far beyond the recommended limit, is in fact lower, due to large subsidy resulting in a relatively cheap price (second only to India). The competition with other agricultural commodities of higher value, or the increasing land demand from non-agricultural sectors, has also led to the difficulty to lower the high land cost for growing rice paddies.
Another problem is the low land tenure; for example in the three largest rice producing regions in Java, the average land tenure amounts to 2,000 m2 and the average total land is about 0.4 hectares. With the small amount of land tenure, it is often discovered that the bargaining position of farmers is weak against merchants/collectors. In Indonesia, there is Law No. 19 of 2013 which regulates the government's obligation to guarantee the prices of the products benefitting the farmers, one of which is through a balanced market structure. This condition can be interpreted as an ideal trade system arrangement for agricultural products, which happens when a trading condition of healthy, efficient and fair competition for producers, traders and consumers is created. The government's desire for producers to get a decent price, and for consumers to pay a reasonable price, especially for strategic food products such as rice, is certainly very understandable. In developed countries such as the USA (marketing mission), it is the responsibility of the government to conduct an agricultural product marketing policy intervention, i.e. how to decrease the price gap between producer and consumer levels; whether through direct marketing or chain shortening for the necessary conditions (not all the time).
Historically, the monthly rice price movement in Indonesia each year has a similar pattern. The rice price tends to rise from January to February and then gradually decline until June. Starting in July, rice price is on the rise again until the end of the year. The pattern is caused by the harvest time of the rice itself.
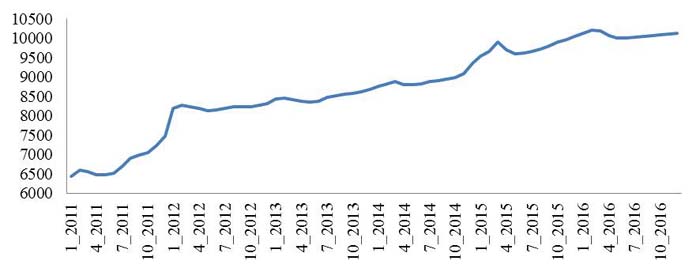
Fig. 1. The Monthly Rice Price Development of Indonesia, 2011-2016
Source: BPS, 2016
Fig. 1 shows that the national rice price tends to increase from year to year. From 2011 to 2016 it is recorded that the rice price has risen by 57 % or the equivalent of Rp3,650/kg. The highest price was recorded in the February 2016 period which amounted to Rp10,214/kg. Meanwhile, the highest price increase occurred in the March 2015 period due to harvest delay and declining production in 2014. Hence, the supply was interrupted.
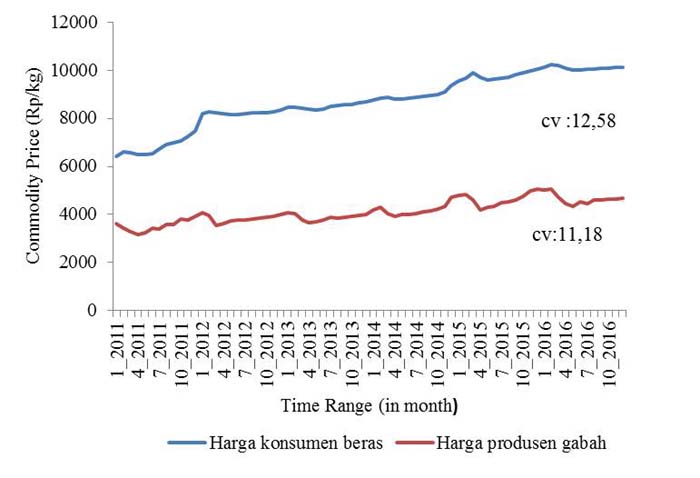
Fig. 2. The Producer and Consumer Rice Price Development of Indonesia, 2011-2016
Source: BPS, 2016
It can be seen in Fig. 2 that rice as a staple commodity tends to have a fluctuative price movement with an increasing trend on the consumer side. On the other hand, the highest producer price occurred in the early period of 2016. Price fluctuations are more volatile on the consumer side than on the producer side. It is proved by the higher value of coefficient of variation (cv) of the consumer price at 12.58, while the cv value of the producer price is only 11.18.
At the provincial level, rice price tends to be more fluctuative than the price at the national level. This is because the supply and distribution of rice of each province vary. This condition raises the price disparity between provinces.
Extreme price disparity between regions may indicate that the rice market is inefficient and the price integration between regions has not been well developed. In fact, the Law No. 7 of 2014 on Trades explains that inter-island trading activities aim to integrate the domestic market. It is suspected that the occurring problems of rice price are due to the asymmetric price transmission. This study aimed to analyze the extent on which the rice value chain has been working in Indonesia. In addition, is the increase of rice price in the consumer market really transmitted well to the producers?
METHODOLOGY
This study implemented two methods. First, to analyze the condition of rice value chain working in Indonesia, descriptive analysis was used. Second, the econometric model was applied to analyze the price transmission from consumers to producers. Both methods were used in two analyses separately.
Asymmetric vertical price transmission
Asymmetric price transmission is the different price responses between positive price shock (price increase) and negative price shock (price decrease). Asymmetric price transmission can be classified into three criteria (Meyer & Von Cramon-Taubadel 2004). The first criterion of asymmetric price transmission can occur vertically or spatially. Vertical price transmission occurs between the marketing levels in one chain, while spatial price transmission occurs between markets that differ geographically. The second criterion is based on the speed of time and the amount of price adjustment.
Vertical price transmission in an asymmetric marketing chain, either positive or negative, occurs not only from upstream to downstream, but also from upstream to downstream. In order to avoid misinterpretation, a positive asymmetric price transmission is a faster and or more perfect price transmission condition occurring when there is a reduction in margin compared to when there is an addition in margin. Margin reduction occurs when there is a price increase upstream or a price decrease downstream, whereas margin addition occurs when there is a price decrease upstream or a price increase downstream.
Von Cramon-Taubadel and Loy Model
The error correction model of Von Cramon-Taubadel and Loy in the price transmission analysis has been declared valid by Hassouneh et al. (2012). Hassouneh et al. (2012) compared several econometric models in a price transmission analysis, taking into account the presence or absence of unit roots and cointegration in two price series data. They concluded that ECM (error correction model) is a valid model to test the price transmission pattern on non-stationary but cointegrated data condition.
ECM concept is used to analyse the asymmetric price transmission introduced by Von Cramon-Taubadel and Fahlbusch (1994) by observing the significance of the deviation (error) of its long-term equilibrium model. In the cointegration concept, if there is a price movement deviation, it will be included as a form of error correction (error correction term/ECT) (Vavra and Goodwin 2005). Pre-cointegration technique for asymmetric price transmission analysis can produce spurious regression because it uses non-stationary data series.
The analysis steps in this study are:
- Data Stationarity Test;
- Optimal (Order) Determination;
- Cointegration Test;
- Causality Test; and
- ECM Implementation on Price Asymmetry Model
The ECM model of price asymmetry
This study examined whether there is a rice price asymmetry at producer and consumer levels by using real values obtained from the nominal price divided by the inflation from each province in 32 provinces of Indonesia. The ECM model was implemented through two stages, namely:
When PP affects PC
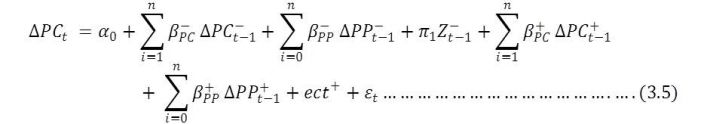
When PC affects PP
.jpg)
Where:
|
PPt
|
= The rice price at producer level of the tth period in province x (Rp/Kg)
|
|
PCt
|
= The rice price at consumer level of the tth period in province x (Rp/Kg)
|
|
PPt-1
|
= The rice price at producer level of the previous period in province x (Rp/Kg)
|
|
PCt-1
|
= The commodity price at consumer lever of the previous period in province x (Rp/Kg)
|
|

|
= Intercept
|
|
P
|
= Lag length
|
|

|
=Error correction term
|
The data used in this research were quantitative secondary data. Monthly data of rice consumer and producer prices from each province were taken from BPS (Statistics Indonesia). The consumer prices used were the monthly consumer prices of premium rice of 33 provinces in Indonesia in the period of 2011-2016. The rice producer prices used were the prices of GKP (Harvest Dry Rice) in the four rice production centre provinces in the same period. CPI and PPI data of agriculture sector were also taken from BPS.
VALUE CHAIN ANALYIS
The rice trade system in Indonesia today is not much different from the trade system in the past few decades, namely implementing a controlled agricultural policy. Both at the present and in the past, farmers still sell grains to collecting merchants or through tebasan system (the produce sold before harvesting). After reaching the collectors, the grains are handed over to the rice mills, which then distribute the products to big merchants and central/city markets. Consumers can buy rice through retailers who buy rice either from big merchants or traders in the central markets. Another trade system channel is farmers selling grains to village cooperatives which are then purchased by Bulog (Indonesian Bureau of Logistics). The existence of village cooperatives in the rice distribution is very strategic for farmers in order to get the prices which are in accordance with government regulations, especially during the great harvest. Rice that has been collected is stored in Bulog warehouses, which is then distributed to the markets through big merchants or central markets, where it is purchased by retailers who sell it to the consumers.
In general, the market structure of grains and rice is not competitive, but rather included within the market structure of oligopsony, oligopoly and monopolistic. The number of farmers is higher than the number of collectors or rice mill entrepreneurs and the number of collectors is higher than the number of rice mill entrepreneurs. Meanwhile, the quantity comparison between hullers and big merchants is almost balanced. The market structure at the consumer level is close to monopolistic because the number of retailers and consumers is relatively high and the rice product is relatively not homogeneous.
This type of market structure allows farmers and consumers in a weak position and mills and rice merchants in a dominant position. The rice mill entrepreneurs and big merchants generally know each other and trust each other. Their position is reinforced by the existence of natural barrier to entry, such as capital and technology control, and also by the grain purchasing policy issued by Bulog as well as the distribution of capital assistance funds to the rice mill entrepreneurs. The domination of hullers and big merchants in the rice trade causes them to become the party that determines the prices (price maker). Therefore, grain price is mostly determined by rice mill entrepreneurs and rice price is determined by big merchants.
Based on further analysis of conduct and performance, there are several factors that are suspected to cause a wider price disparity between the harvest dry rice at farmer level and rice at retailer level, namely:
- The change of floor price to farm-gate reference price since 2003 followed by the policy reform stipulating that Bulog no longer acts as the price stabilizer. This policy has led to an increasingly oligopoly/oligopsony market structure, where strong investors take the opportunity to take over Bulog’s position. These big entrepreneurs move primarily in the inter-region large scale rice milling and trading businesses. This indicates that the policy prevailing before the reform is more effective in improving farmers’ welfare and is effective in reducing price increase at the consumer level;
- The policy in the fund distribution of Rural Economic Enterprises (LUEP), which are pro-rice mills, and Bulog's partnership in the procurement of rice/grain strengthen the dominant position of marketing institutions, namely rice mill entrepreneurs and big merchants, in the markets; and
- The rice trade has not run efficiently and business competition is not healthy, which are indicated by the analysis results of marketing margin, market integration, and behaviour. In marketing margin analysis, the profit margin is greater than the cost margin and there is an uneven distribution of profit margin among the marketing actors. In addition, market integration analysis shows that GKP and rice prices at retailer level are not integrated, whereas the rice prices at wholesale and retailer levels are integrated.
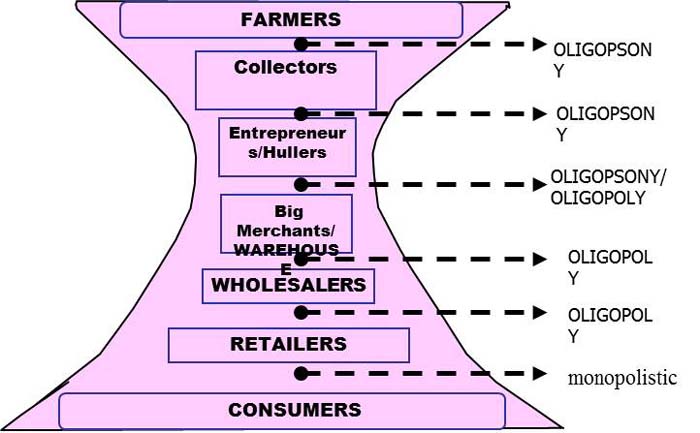
Fig. 3. Grain and Rice Market Structure at Various Market Levels
Source: Firdaus, et al. (2012)
PRICE TRANSMISSION ANALYSIS
Many studies suggested that the market structure of rice is highly asymmetric. The merchants who sometimes double as the rice mill owners are very skilled in managing rice reserves in warehouses. Often rice merchants use information such as the arrival of imported rice to suppress farmer price through collectors. The asymmetric condition above can also be indicated by the price movement responses ranging from farmer level to consumer level. There is the fact that when price increases at the retailer level or at the wholesale level, then the price at the farmer level will also increase but with a lower percentage, compared to if the retailer or wholesale price is down. To put it simply, price increase at the retail level or wholesale level is less likely to affect farmers, but when price decline occurs, farmers will feel the immediate impact. In terms of market competition, this means that the bargaining position of farmers is not equivalent to wholesalers or retailers. To demonstrate this hypothesis, an econometric model is used to show the analysis results as follows.
Data stationarity test
The results of data stationarity test with ADF statistics show that the rice producer price in the production centre provinces tends not to be stationary at the level, but stationary at the first difference. In all provinces the producers are stationary at the first difference. At the consumer level, rice consumer price in 33 provinces tends not to be stationary at the level, but stationary at the first difference. In all provinces consumers are stationary at the first difference.
Cointegration test
The analysis of the integration between the consumer price and the price of the four producing provinces (West Java, Central Java, East Java and Lampung) with the Eangle-Granger procedure indicates that all consumer provinces are cointegrated with producer provinces with a five percent significance level. The highest average value of the degree of integration belongs to the production centre province of East Java. This shows that the consumer price and producer price of East Java move in tandem. From the four production centre provinces, the producer price of West Java has the lowest average value of the degree of integration.
Causality test
The Granger Causality Test in this study was conducted to ensure the direction of price transmission. The direction in question is whether consumer price affects producer price or vice versa. It can also test whether there is a two-way relationship or not. In this study, not all provinces passing the cointegration test stage passed this causality test. Further analysis with ECM was performed for regions passing this causality test.
Rice price asymmetry model analysis
The modelling was conducted after passing through several stages. The price asymmetry analysis was used to see whether the price transmission occurs perfectly between producer price and consumer price. Due to the relatively large number of provinces, several provinces were selected for comparison. The model used in this study was the ECM EG model. This model separates between the short term and the long term price transmissions. For rice, 9 models were modelled to explain the occurring price transmissions (see Table appendix 1).
The analysis results of price asymmetry models show that generally, price asymmetry occurs in the short term and only one finding indicates that price asymmetry occurs in the long run. This is in accordance with the study conducted by Baquedano and Liefert (2014) which stated that in the long-term transmission process, price elasticity is generally small and also the majority of transmission process is incomplete. What determines the asymmetric price transmission is sometimes unclear and difficult to determine. In the study by Aguiar and Santana (2002), both the product shelf life and market concentration variables similarly do not determine whether prices will be asymmetric or not. Even non-durable commodities in the competitive markets show a higher price transmission when price increase occurs.
CONCLUSIONS
This study derives some conclusions as follows:
- The rice supply chain in Indonesia is performed with the important role of middlemen who link farmers to end users. In most cases, the supply chain is relatively long because it has to go through several middlemen, such as village traders, district traders and wholesalers outside the districts, before it gets to end users.
- The rice price movement at the provincial and national levels indicates the trend that tends to be more fluctuative on the consumer side than the producer side. The Eastern Regions of Indonesia, which have a deficit in the production balance, have a more volatile price movement with averagely higher consumer price than other regions.
- In the price asymmetry analysis, there is a case where the producer price determines the price or the consumer price determines the price. Generally, if the consumer price acts as a price determinant, then the model is symmetrical in both the long and short terms. But when producer price acts as a price determinant, then the model is asymmetrical in the short term.
IMPLICATION FOR FURTHER AGENDA
The competitiveness of Indonesian rice is due to the problems of productivity and long chain of trade system. Technology dissemination effort with the help of machines and equipment by the government, if carried out optimally, will definitely be able to reduce the cost of labor. The keywords to increase the rice competitveness in Indonesia are increasing productivity, not increase the number of rice produced. Disseminating technology to farmers should be the focus of the Ministry of Agriculture, such as the provision of seeds from certified superior varieties, irrigation and pest control. Based on the report by the Directorate General of Food Crops in 2016, only 43.5% of paddy farmers have adopted these types of seeds (the number decreased from the condition of 2015) although a lot of research budget has been spent to construct and test these new seeds. This is indicated by the fact that the average cost incurred by the rice farmers in Indonesia for seeds is very low, far below the cost spent by the farmers in other producer countries. IRRI study report states that there are only about 60 % of farmers using certified inbred rice seeds in West Java; the rest use their own seeds. In contrast, 100 %of the farmers in China use hybrid seeds, and more than 90 %of farmers in India have adopted certified inbred rice seeds.
In addition, the access of farmers to information technology and institution strengthening are equally important. Currently, farmers of various strategic commodities in the production centres can directly access the prices in the markets of various cities, by utilizing Android technology. For example, from the author's own survey results, the applications Informasi Pangan Jakarta (Jakarta Food Information) and SiHATi from Bank Indonesia that always update the prices of food every day are perceived as very beneficial to the farmers in Temanggung when negotiating with the collectors in their villages.
Furthermore, in the issue of rice trade system, some improvements absolutely have to be done. Even in a developed country like the USA, the trade system of agricultural products derived from plants (food, fruit and vegetables) still faces many quality standard problems; in contrast to the products from animals which have better quality classification (grading). In addition, there is still a gap in farmer's share between regions in the USA; from the worst condition, namely the farmers only receive about 17% of the consumer price, to the ideal condition (food hubs), where farmers can earn up to 75%.
Government intervention in the rice industry is not only in the form of input subsidies (fertilizers, seeds) as well as facility and infrastructure assistance, which is very large in number; but also in the form of price policies, namely the government's purchase price (farm-gate reference price) and the highest retail price (ceiling price). This intervention is also commonly practiced in other rice producing nations. Both pricing policies are primarily intended as a reference for Bulog as the national food support agency to make purchases to farmers or operations in the consumer market. Though, various obstacles limiting the authority of Bulog have caused assorted problems in the field.
Some discussions have been made well in advance about the effectiveness of farmgate reference price of grains. The farmgate reference price set by the government is thought to be ineffective, and one of the reasons is that the selling price of grains by farmers is always far above the farmgate reference price. Over the past three years, prices have always been well above Rp 4,000. This actually implies that the current farmgate reference price may be lower than the supposed condition. Especially when referring to the results of some researches, which have included components such as land rent and all labour that must be taken into account. This includes the price of urea fertilizer paid by farmers that is always calculated equal to the government’s subsidized price at effective condition; but the reality in the field is not like that. Some research results have shown that only about 10 % of farmers bring grains to the mills (Gapoktan – the association of farmers groups) and then sell them in the form of rice; the rest sell grains to the collectors. This means that the farmgate reference price is important to ensure the welfare of farmers, certainly with the assumption that marketable surplus is still high.
For the ceiling price, it is obvious that at Rp 9,500, let alone Rp 9,000, it is ineffective. BPS publication on rice prices in Indonesian cities or Bank Indonesia publication that can be easily accessed via smartphone show that the prices of IR rice (64) in the retail markets of Jakarta are reported, for grade 1, 2 or 3, to range from almost Rp 12,000 to Rp 9,700. If it is assumed that the rice market share outside this modern retail still dominates the market, it means that the implementation of ceiling price does not occur in the field. In some countries, when this condition occurs, the consumers can report to the local authority, so there will be a follow-up from the government. How about in Indonesia? In addition, the government in their regulations calculate the rice ceiling price (farmers) in the mills at Rp 7,300. If the ceiling price is consumed only at Rp 9,500, it means the the share received by farmers is more than 75%. This has overcome the best condition of the share received by the farmers in the USA. Thus, this ceiling price number seriously needs to be reviewed.
The government has a lot of homework to do. In addition to the serious efforts to improve the productivity of rice farmers, subsidy mechanism, namely inputs such as fertilizers and also prices, and assistance to farmers need to be evaluated. The production data accuracy to the success of food diversification efforts will also greatly determine the goal achievement of food security (food sovereignty). Closer collaborations with Agriculture Higher Education Institutions, independent research institutions, NGOs and the business world, which are implemented in the neighbouring countries and many developed countries, are highly anticipated.
REFERENCES
Aguiar DRD, Santana JA. 2005. Asymmetry in farm to retail price transmission evidence from Brazil. Agribusiness, 21(2): 273-286
Baquedano FG, Liefert WM. Market integration and price transmission in consumer markets of developing countries. Food Policy 44(2014): 103-114.
[BPS] Badan Pusat Statistik. 2016. Statitstik harga konsumen pedesaan Indonesia 2011-2016. Jakarta (ID): BPS
[BPS] Badan Pusat Statistik. 2016. Statitstik harga produsen Indonesia 2011-2016. Jakarta (ID): BPS
Chalil D, Esfahani FA. 2006. Modelling market power in the Indonesia palm oil industry. Agricultural and Resources Economics Faculty of Agriculture, Food and Natural Resources. Sydney (AUS). The University of Sydney
Chen B, Saghaian S .2016. Market integration and price transmission in the world rice export markets. Journal of Agricultural and Resource Economics, 41(3): 444-457
Conforti P. 2004.Price transmission in selected agricultural markets [Working Paper]. FAO Commodity and Trade Policy Research, No 7, March, 2004. Available on: http://www.fao.org/es/ESC.
Jezghani F, Moghaddasi R, Yazdani S, Mohamadinejad A. 2011. Price transmission mechanism in the Iranian rice market. International Journal of Agricultural Science and Research. 2(4):31-38
Johansen S. 1998. Statistical analysis of cointegration vectors. Journal of Economic Dynamics and Control, 12(3): 231-254
Meyer J, von Cramon-Taubadel S. 2004. Price transmission: a survey. Journal of Agricultural Economics, 55(3): 581-611.
NeilMcCulloch. 2008. Rice prices and poverty in Indonesia. Bulletin of Indonesian Economic Studies, 44(1): 45-64
Ngare LW, Wambugu SK, Nzuma JM, Shisanya C. 2013. Asymmetric price transmission in food markets in highland of Central Kenya. 4th International Conference of the African Association of Agricultural Economists, September 22-25, 2013, Hammamet, Tunisia. [Internet]. [Downloaded on December 29, 2017]. Available on: http://ageconsearch.umn.edu/bitstream/161448/2.
Ruslan, JA. 2016. Transmisi harga dan perilaku pasar bawang merah [Thesis]. Bogor (ID): Instititut Pertanian Bogor
Sahara, Wicaksena B. 2013. Asymmetry in farm-retail price transmission: the case of chili industry in Indonesia. Jurnal Ekonomi dan Kebijakan Pembangunan. 2(1): 1-13.
Sapuan. 2000. Perjalanan Bulog 35 Tahun: Refleksi Terhadap Pelaksanaan Tugas Pokoknya. Dalam Bulog: Pergulatan Dalam Pemantapan Peranan dan Penyesuaian Kelembagaan. Kumpulan Naskah Dalam Rangka Menyambut 35 Tahun Bulog. Bogor (ID): IPB Pr.
Varela GJ, Lacovone L, Aldaz-Carroll E. 2013. Determinants of market integration and price transmission in Indonesia. Journal of Southeast Asian Economies, 30(1): 19-44.
Wibowo AD, Moeis AO, Wiguna CB, Chaulan TAC. 2015. Policy model of production and price of rice in Kalimantan Selatan. Agriculture and Agricultural Science Procedia 3, (2015): 266-273
Appendix 1. Estimation of Asymmetric Price Model of Rice in Indonesia
|
Var
|
KDKI- PJTG
|
PJTG- KDKI
|
KPAB- PJTG
|
PJTM- KDKI
|
KDKI- PJTM
|
KDKI- PLMP
|
KDKI- PJBR
|
PJBR- KDKI
|
KPAB- PJBR
|
|
C
|
17,11a
|
15,03
|
74,11
|
16,15
|
31,61
|
121,87
|
53,17
|
12,65
|
82,74
|
| |
(0,71)b
|
(0,66)
|
(0,18)
|
(0,65)
|
(0,45)
|
(0,10)
|
(0,27)
|
(0,72)
|
(0,12)
|
|
dP(t-2)+
|
-0,29
|
0,6
|
0,05
|
0,13
|
0,2
|
0,11
|
-0,29
|
0,6
|
0,02
|
| |
(0,24)
|
(0,004)
|
(0,83)
|
(0,52)
|
(0,34)
|
(0,56)
|
(0,26)
|
(0,004)
|
(0,93)
|
|
dP(t-2)-
|
0,12
|
-0,27
|
0,07
|
-0,19
|
0,13
|
-0,35
|
0,06
|
-0,28
|
0,02
|
| |
(0,35)
|
(0,009)
|
(0,51)
|
(0,18)
|
(0,38)
|
(0,03)
|
(0,64)
|
(0,009)
|
(0,82)
|
|
dK(t-2)+
|
-0,06
|
-0,11
|
0,15
|
-0,1
|
-0,14
|
-0,06
|
-0,04
|
-0,11
|
0,19
|
| |
(0,74)
|
(0,44)
|
(0,35)
|
(0,50)
|
(0,39)
|
(0,83)
|
(0,83)
|
(0,45)
|
(0,26)
|
|
dK(t-2)-
|
-0,08
|
0,14
|
0,22
|
-0,002
|
0,008
|
-0,03
|
-0,07
|
0,14
|
0,26
|
| |
(0,73)
|
(0,47)
|
(0,22)
|
(0,99)
|
(0,97)
|
(0,93)
|
(0,77)
|
(0,45)
|
(0,17)
|
|
dP(t-1)+
|
0,51
|
0,54
|
0,55
|
0,31
|
0,21
|
0,08
|
0,54
|
0,54)
|
0,65
|
| |
(0,04)
|
(0,01)
|
(0,02)
|
(0,14)
|
(0,33)
|
(0,67)
|
(0,03)
|
(0,01)
|
(0,007)
|
|
dP(t-1)-
|
0,34
|
-0,1
|
0,28
|
0,02
|
0,3
|
-0,22
|
0,31
|
-0,11
|
0,28
|
| |
(0,007)
|
(0,35)
|
(0,01)
|
(0,90)
|
(0,08)
|
(0,15)
|
(0,02)
|
(0,34)
|
(0,02)
|
|
dK(t-1)+
|
0,3
|
-0,09
|
0,13
|
-0,08
|
-0,12
|
-0,03
|
0,36
|
-0,09
|
0,06
|
| |
(0,21)
|
(0,51)
|
(0,27)
|
(0,59)
|
(0,56)
|
(0,94)
|
(0,15)
|
(0,53)
|
(0,59)
|
|
dK(t-1)-
|
-0,31
|
0,28
|
-0,11
|
0,18
|
-0,22
|
-0,15
|
-0,34
|
0,29
|
0,06
|
| |
(0,24)
|
(0,15)
|
(0,65)
|
(0,37)
|
(0,35)
|
(0,73)
|
(0,20)
|
(0,15)
|
(0,79)
|
|
dP(t)+
|
|
0,1
|
|
0,19
|
|
|
|
0,1
|
|
| |
|
(0,59)
|
|
(0,34)
|
|
|
|
(0,61)
|
|
|
dP(t)-
|
|
-0,04
|
|
-0,4
|
|
|
|
-0,04
|
|
| |
|
(0,68)
|
|
(0,03)
|
|
|
|
(0,67)
|
|
|
dK(t)+
|
0,27
|
|
0,07
|
|
-0,001
|
0,24
|
0,33
|
|
0,009
|
| |
(0,17)
|
|
(0,53)
|
|
(0,99)
|
(0,44)
|
(0,09)
|
|
(0,94)
|
|
dK(t)-
|
0,34
|
|
-0,28
|
|
-0,05
|
-0,29
|
-0,04
|
|
-0,13
|
| |
(0,16)
|
|
(0,31)
|
|
(0,81)
|
(0,50)
|
(0,83)
|
|
(0,62)
|
|
ECT+
|
0,27
|
0,2
|
0,1
|
0,21
|
0,22
|
0,06
|
0,04
|
0,19
|
-0,01
|
| |
(0,21)
|
(0,09)
|
(0,68)
|
(0,09)
|
(0,25)
|
(0,80)
|
(0,83)
|
(0,09)
|
(0,95)
|
|
ECT-
|
0,34
|
0,21
|
0,67
|
0,24
|
0,43
|
0,81
|
0,38
|
0,18
|
0,56
|
| |
(0,16)
|
(0,17)
|
(0,02)
|
(0,14)
|
(0,04)
|
(0,003)
|
(0,08)
|
(0,24)
|
(0,02)
|
|
R2
|
0,47
|
0,36
|
0,58
|
0,28
|
0,31
|
0,31
|
0,45
|
0,34
|
0,55
|
|
R2ADJ
|
0,36
|
0,22
|
0,49
|
0,13
|
0,17
|
0,16
|
0,33
|
0,2
|
0,45
|
|
FSTAT
|
4,22
|
2,58
|
6,48
|
1,86
|
2,13
|
2,11
|
3,82
|
2,46
|
4,9
|
|
|
(0,0001)
|
(0,008)
|
(0,00000)
|
(0,06)
|
(0,03)
|
0,03)
|
(0,0003)
|
(0,01)
|
(0,00003)
|
Note: a Estimation parameter b p-value, letter (K) at the beginning of the province name describes the consumer price, letter (P) at the beginning of the province name describes the producer price. DKI (DKI Jakarta), JTG (Central Java), PAB (West Papua).JBR (West Java), LMP (Lampung), JTM (East Java)
| (Submitted as a paper for the International Seminar on “Promoting Rice Farmers’ Market through value-adding Activities”, June 6-7, 2018, Kasetsart University, Thailand) |

The Value Chain and Rice Price Policy in Indonesia
ABSTRACT
Rice is one of the strategic commodities in Indonesia. Government intervention plays a significant role in Indonesian rice economy. A large input subsidy was delivered to rice farmers. Price policies were introduced annually. However, in Indonesia, rice is currently produced at the highest cost compared to the costs spent by some peers in Asia. From the farm gate to the market, rice is transported through a long supply chain. Uncompetitive markets are dominant along the chain. This study employed field and time-series data of regional rice markets to investigate the marketing efficiency, from both technical and price perspectives. The results show that in general, the value chain still needs many improvements regarding unbalanced marketing margin received by the actors. Price analysis shows the asymmetric condition among the producer and retail markets. The current rice price policy worsens the market situation, thus the Government of Indonesia is suggested to improve the rice price policy.
Keywords: rice competitiveness, supply chain, price transmission
INTRODUCTION
The better fulfillment of food and nutrition for the community has become a global commitment (SDG). The utilization of resources for the achievement of these objectives should be carefully thought out in order to achieve sustainable results, not just for the achievement of temporary goals. This principle should also be implemented along the supply chain, including rice, starting from farmers to products available at the consumers’ tables. The whole process should provide a balanced economic value so that trade fairness can be obtained.
In Indonesia, the rice economy is one of the issues that have continuously been discussed by many for a long time. One important issue is the rice price in the consumer market in Indonesia which is higher than that in many other producer countries. The rice price in the domestic market reaches US $ 1 per kg, one and a half to twice the price in other countries. The causes are long rice supply chain, lack of policy control, and rice farmers' production which has no comparative advantage. Based on the IRRI publication (2006), from six rice producing countries in Asia, it turns out that the farmers in Indonesia have to spend the highest cost to produce 1 kg of harvest dry rice. Overall, the cost incurred by Indonesian farmers is two and a half times the cost paid by the farmers in Vietnam, or nearly twice as many as the cost spent by the farmers in Thailand and India. The largest cost components paid by farmers are for paying labor and land rent (calculated). The expenditure on inputs, such as urea fertilizer which is suspected to be far beyond the recommended limit, is in fact lower, due to large subsidy resulting in a relatively cheap price (second only to India). The competition with other agricultural commodities of higher value, or the increasing land demand from non-agricultural sectors, has also led to the difficulty to lower the high land cost for growing rice paddies.
Another problem is the low land tenure; for example in the three largest rice producing regions in Java, the average land tenure amounts to 2,000 m2 and the average total land is about 0.4 hectares. With the small amount of land tenure, it is often discovered that the bargaining position of farmers is weak against merchants/collectors. In Indonesia, there is Law No. 19 of 2013 which regulates the government's obligation to guarantee the prices of the products benefitting the farmers, one of which is through a balanced market structure. This condition can be interpreted as an ideal trade system arrangement for agricultural products, which happens when a trading condition of healthy, efficient and fair competition for producers, traders and consumers is created. The government's desire for producers to get a decent price, and for consumers to pay a reasonable price, especially for strategic food products such as rice, is certainly very understandable. In developed countries such as the USA (marketing mission), it is the responsibility of the government to conduct an agricultural product marketing policy intervention, i.e. how to decrease the price gap between producer and consumer levels; whether through direct marketing or chain shortening for the necessary conditions (not all the time).
Historically, the monthly rice price movement in Indonesia each year has a similar pattern. The rice price tends to rise from January to February and then gradually decline until June. Starting in July, rice price is on the rise again until the end of the year. The pattern is caused by the harvest time of the rice itself.
Fig. 1. The Monthly Rice Price Development of Indonesia, 2011-2016
Source: BPS, 2016
Fig. 1 shows that the national rice price tends to increase from year to year. From 2011 to 2016 it is recorded that the rice price has risen by 57 % or the equivalent of Rp3,650/kg. The highest price was recorded in the February 2016 period which amounted to Rp10,214/kg. Meanwhile, the highest price increase occurred in the March 2015 period due to harvest delay and declining production in 2014. Hence, the supply was interrupted.
Fig. 2. The Producer and Consumer Rice Price Development of Indonesia, 2011-2016
Source: BPS, 2016
It can be seen in Fig. 2 that rice as a staple commodity tends to have a fluctuative price movement with an increasing trend on the consumer side. On the other hand, the highest producer price occurred in the early period of 2016. Price fluctuations are more volatile on the consumer side than on the producer side. It is proved by the higher value of coefficient of variation (cv) of the consumer price at 12.58, while the cv value of the producer price is only 11.18.
At the provincial level, rice price tends to be more fluctuative than the price at the national level. This is because the supply and distribution of rice of each province vary. This condition raises the price disparity between provinces.
Extreme price disparity between regions may indicate that the rice market is inefficient and the price integration between regions has not been well developed. In fact, the Law No. 7 of 2014 on Trades explains that inter-island trading activities aim to integrate the domestic market. It is suspected that the occurring problems of rice price are due to the asymmetric price transmission. This study aimed to analyze the extent on which the rice value chain has been working in Indonesia. In addition, is the increase of rice price in the consumer market really transmitted well to the producers?
METHODOLOGY
This study implemented two methods. First, to analyze the condition of rice value chain working in Indonesia, descriptive analysis was used. Second, the econometric model was applied to analyze the price transmission from consumers to producers. Both methods were used in two analyses separately.
Asymmetric vertical price transmission
Asymmetric price transmission is the different price responses between positive price shock (price increase) and negative price shock (price decrease). Asymmetric price transmission can be classified into three criteria (Meyer & Von Cramon-Taubadel 2004). The first criterion of asymmetric price transmission can occur vertically or spatially. Vertical price transmission occurs between the marketing levels in one chain, while spatial price transmission occurs between markets that differ geographically. The second criterion is based on the speed of time and the amount of price adjustment.
Vertical price transmission in an asymmetric marketing chain, either positive or negative, occurs not only from upstream to downstream, but also from upstream to downstream. In order to avoid misinterpretation, a positive asymmetric price transmission is a faster and or more perfect price transmission condition occurring when there is a reduction in margin compared to when there is an addition in margin. Margin reduction occurs when there is a price increase upstream or a price decrease downstream, whereas margin addition occurs when there is a price decrease upstream or a price increase downstream.
Von Cramon-Taubadel and Loy Model
The error correction model of Von Cramon-Taubadel and Loy in the price transmission analysis has been declared valid by Hassouneh et al. (2012). Hassouneh et al. (2012) compared several econometric models in a price transmission analysis, taking into account the presence or absence of unit roots and cointegration in two price series data. They concluded that ECM (error correction model) is a valid model to test the price transmission pattern on non-stationary but cointegrated data condition.
ECM concept is used to analyse the asymmetric price transmission introduced by Von Cramon-Taubadel and Fahlbusch (1994) by observing the significance of the deviation (error) of its long-term equilibrium model. In the cointegration concept, if there is a price movement deviation, it will be included as a form of error correction (error correction term/ECT) (Vavra and Goodwin 2005). Pre-cointegration technique for asymmetric price transmission analysis can produce spurious regression because it uses non-stationary data series.
The analysis steps in this study are:
The ECM model of price asymmetry
This study examined whether there is a rice price asymmetry at producer and consumer levels by using real values obtained from the nominal price divided by the inflation from each province in 32 provinces of Indonesia. The ECM model was implemented through two stages, namely:
When PP affects PC
When PC affects PP
Where:
PPt
= The rice price at producer level of the tth period in province x (Rp/Kg)
PCt
= The rice price at consumer level of the tth period in province x (Rp/Kg)
PPt-1
= The rice price at producer level of the previous period in province x (Rp/Kg)
PCt-1
= The commodity price at consumer lever of the previous period in province x (Rp/Kg)
= Intercept
P
= Lag length
=Error correction term
The data used in this research were quantitative secondary data. Monthly data of rice consumer and producer prices from each province were taken from BPS (Statistics Indonesia). The consumer prices used were the monthly consumer prices of premium rice of 33 provinces in Indonesia in the period of 2011-2016. The rice producer prices used were the prices of GKP (Harvest Dry Rice) in the four rice production centre provinces in the same period. CPI and PPI data of agriculture sector were also taken from BPS.
VALUE CHAIN ANALYIS
The rice trade system in Indonesia today is not much different from the trade system in the past few decades, namely implementing a controlled agricultural policy. Both at the present and in the past, farmers still sell grains to collecting merchants or through tebasan system (the produce sold before harvesting). After reaching the collectors, the grains are handed over to the rice mills, which then distribute the products to big merchants and central/city markets. Consumers can buy rice through retailers who buy rice either from big merchants or traders in the central markets. Another trade system channel is farmers selling grains to village cooperatives which are then purchased by Bulog (Indonesian Bureau of Logistics). The existence of village cooperatives in the rice distribution is very strategic for farmers in order to get the prices which are in accordance with government regulations, especially during the great harvest. Rice that has been collected is stored in Bulog warehouses, which is then distributed to the markets through big merchants or central markets, where it is purchased by retailers who sell it to the consumers.
In general, the market structure of grains and rice is not competitive, but rather included within the market structure of oligopsony, oligopoly and monopolistic. The number of farmers is higher than the number of collectors or rice mill entrepreneurs and the number of collectors is higher than the number of rice mill entrepreneurs. Meanwhile, the quantity comparison between hullers and big merchants is almost balanced. The market structure at the consumer level is close to monopolistic because the number of retailers and consumers is relatively high and the rice product is relatively not homogeneous.
This type of market structure allows farmers and consumers in a weak position and mills and rice merchants in a dominant position. The rice mill entrepreneurs and big merchants generally know each other and trust each other. Their position is reinforced by the existence of natural barrier to entry, such as capital and technology control, and also by the grain purchasing policy issued by Bulog as well as the distribution of capital assistance funds to the rice mill entrepreneurs. The domination of hullers and big merchants in the rice trade causes them to become the party that determines the prices (price maker). Therefore, grain price is mostly determined by rice mill entrepreneurs and rice price is determined by big merchants.
Based on further analysis of conduct and performance, there are several factors that are suspected to cause a wider price disparity between the harvest dry rice at farmer level and rice at retailer level, namely:
Fig. 3. Grain and Rice Market Structure at Various Market Levels
Source: Firdaus, et al. (2012)
PRICE TRANSMISSION ANALYSIS
Many studies suggested that the market structure of rice is highly asymmetric. The merchants who sometimes double as the rice mill owners are very skilled in managing rice reserves in warehouses. Often rice merchants use information such as the arrival of imported rice to suppress farmer price through collectors. The asymmetric condition above can also be indicated by the price movement responses ranging from farmer level to consumer level. There is the fact that when price increases at the retailer level or at the wholesale level, then the price at the farmer level will also increase but with a lower percentage, compared to if the retailer or wholesale price is down. To put it simply, price increase at the retail level or wholesale level is less likely to affect farmers, but when price decline occurs, farmers will feel the immediate impact. In terms of market competition, this means that the bargaining position of farmers is not equivalent to wholesalers or retailers. To demonstrate this hypothesis, an econometric model is used to show the analysis results as follows.
Data stationarity test
The results of data stationarity test with ADF statistics show that the rice producer price in the production centre provinces tends not to be stationary at the level, but stationary at the first difference. In all provinces the producers are stationary at the first difference. At the consumer level, rice consumer price in 33 provinces tends not to be stationary at the level, but stationary at the first difference. In all provinces consumers are stationary at the first difference.
Cointegration test
The analysis of the integration between the consumer price and the price of the four producing provinces (West Java, Central Java, East Java and Lampung) with the Eangle-Granger procedure indicates that all consumer provinces are cointegrated with producer provinces with a five percent significance level. The highest average value of the degree of integration belongs to the production centre province of East Java. This shows that the consumer price and producer price of East Java move in tandem. From the four production centre provinces, the producer price of West Java has the lowest average value of the degree of integration.
Causality test
The Granger Causality Test in this study was conducted to ensure the direction of price transmission. The direction in question is whether consumer price affects producer price or vice versa. It can also test whether there is a two-way relationship or not. In this study, not all provinces passing the cointegration test stage passed this causality test. Further analysis with ECM was performed for regions passing this causality test.
Rice price asymmetry model analysis
The modelling was conducted after passing through several stages. The price asymmetry analysis was used to see whether the price transmission occurs perfectly between producer price and consumer price. Due to the relatively large number of provinces, several provinces were selected for comparison. The model used in this study was the ECM EG model. This model separates between the short term and the long term price transmissions. For rice, 9 models were modelled to explain the occurring price transmissions (see Table appendix 1).
The analysis results of price asymmetry models show that generally, price asymmetry occurs in the short term and only one finding indicates that price asymmetry occurs in the long run. This is in accordance with the study conducted by Baquedano and Liefert (2014) which stated that in the long-term transmission process, price elasticity is generally small and also the majority of transmission process is incomplete. What determines the asymmetric price transmission is sometimes unclear and difficult to determine. In the study by Aguiar and Santana (2002), both the product shelf life and market concentration variables similarly do not determine whether prices will be asymmetric or not. Even non-durable commodities in the competitive markets show a higher price transmission when price increase occurs.
CONCLUSIONS
This study derives some conclusions as follows:
IMPLICATION FOR FURTHER AGENDA
The competitiveness of Indonesian rice is due to the problems of productivity and long chain of trade system. Technology dissemination effort with the help of machines and equipment by the government, if carried out optimally, will definitely be able to reduce the cost of labor. The keywords to increase the rice competitveness in Indonesia are increasing productivity, not increase the number of rice produced. Disseminating technology to farmers should be the focus of the Ministry of Agriculture, such as the provision of seeds from certified superior varieties, irrigation and pest control. Based on the report by the Directorate General of Food Crops in 2016, only 43.5% of paddy farmers have adopted these types of seeds (the number decreased from the condition of 2015) although a lot of research budget has been spent to construct and test these new seeds. This is indicated by the fact that the average cost incurred by the rice farmers in Indonesia for seeds is very low, far below the cost spent by the farmers in other producer countries. IRRI study report states that there are only about 60 % of farmers using certified inbred rice seeds in West Java; the rest use their own seeds. In contrast, 100 %of the farmers in China use hybrid seeds, and more than 90 %of farmers in India have adopted certified inbred rice seeds.
In addition, the access of farmers to information technology and institution strengthening are equally important. Currently, farmers of various strategic commodities in the production centres can directly access the prices in the markets of various cities, by utilizing Android technology. For example, from the author's own survey results, the applications Informasi Pangan Jakarta (Jakarta Food Information) and SiHATi from Bank Indonesia that always update the prices of food every day are perceived as very beneficial to the farmers in Temanggung when negotiating with the collectors in their villages.
Furthermore, in the issue of rice trade system, some improvements absolutely have to be done. Even in a developed country like the USA, the trade system of agricultural products derived from plants (food, fruit and vegetables) still faces many quality standard problems; in contrast to the products from animals which have better quality classification (grading). In addition, there is still a gap in farmer's share between regions in the USA; from the worst condition, namely the farmers only receive about 17% of the consumer price, to the ideal condition (food hubs), where farmers can earn up to 75%.
Government intervention in the rice industry is not only in the form of input subsidies (fertilizers, seeds) as well as facility and infrastructure assistance, which is very large in number; but also in the form of price policies, namely the government's purchase price (farm-gate reference price) and the highest retail price (ceiling price). This intervention is also commonly practiced in other rice producing nations. Both pricing policies are primarily intended as a reference for Bulog as the national food support agency to make purchases to farmers or operations in the consumer market. Though, various obstacles limiting the authority of Bulog have caused assorted problems in the field.
Some discussions have been made well in advance about the effectiveness of farmgate reference price of grains. The farmgate reference price set by the government is thought to be ineffective, and one of the reasons is that the selling price of grains by farmers is always far above the farmgate reference price. Over the past three years, prices have always been well above Rp 4,000. This actually implies that the current farmgate reference price may be lower than the supposed condition. Especially when referring to the results of some researches, which have included components such as land rent and all labour that must be taken into account. This includes the price of urea fertilizer paid by farmers that is always calculated equal to the government’s subsidized price at effective condition; but the reality in the field is not like that. Some research results have shown that only about 10 % of farmers bring grains to the mills (Gapoktan – the association of farmers groups) and then sell them in the form of rice; the rest sell grains to the collectors. This means that the farmgate reference price is important to ensure the welfare of farmers, certainly with the assumption that marketable surplus is still high.
For the ceiling price, it is obvious that at Rp 9,500, let alone Rp 9,000, it is ineffective. BPS publication on rice prices in Indonesian cities or Bank Indonesia publication that can be easily accessed via smartphone show that the prices of IR rice (64) in the retail markets of Jakarta are reported, for grade 1, 2 or 3, to range from almost Rp 12,000 to Rp 9,700. If it is assumed that the rice market share outside this modern retail still dominates the market, it means that the implementation of ceiling price does not occur in the field. In some countries, when this condition occurs, the consumers can report to the local authority, so there will be a follow-up from the government. How about in Indonesia? In addition, the government in their regulations calculate the rice ceiling price (farmers) in the mills at Rp 7,300. If the ceiling price is consumed only at Rp 9,500, it means the the share received by farmers is more than 75%. This has overcome the best condition of the share received by the farmers in the USA. Thus, this ceiling price number seriously needs to be reviewed.
The government has a lot of homework to do. In addition to the serious efforts to improve the productivity of rice farmers, subsidy mechanism, namely inputs such as fertilizers and also prices, and assistance to farmers need to be evaluated. The production data accuracy to the success of food diversification efforts will also greatly determine the goal achievement of food security (food sovereignty). Closer collaborations with Agriculture Higher Education Institutions, independent research institutions, NGOs and the business world, which are implemented in the neighbouring countries and many developed countries, are highly anticipated.
REFERENCES
Aguiar DRD, Santana JA. 2005. Asymmetry in farm to retail price transmission evidence from Brazil. Agribusiness, 21(2): 273-286
Baquedano FG, Liefert WM. Market integration and price transmission in consumer markets of developing countries. Food Policy 44(2014): 103-114.
[BPS] Badan Pusat Statistik. 2016. Statitstik harga konsumen pedesaan Indonesia 2011-2016. Jakarta (ID): BPS
[BPS] Badan Pusat Statistik. 2016. Statitstik harga produsen Indonesia 2011-2016. Jakarta (ID): BPS
Chalil D, Esfahani FA. 2006. Modelling market power in the Indonesia palm oil industry. Agricultural and Resources Economics Faculty of Agriculture, Food and Natural Resources. Sydney (AUS). The University of Sydney
Chen B, Saghaian S .2016. Market integration and price transmission in the world rice export markets. Journal of Agricultural and Resource Economics, 41(3): 444-457
Conforti P. 2004.Price transmission in selected agricultural markets [Working Paper]. FAO Commodity and Trade Policy Research, No 7, March, 2004. Available on: http://www.fao.org/es/ESC.
Jezghani F, Moghaddasi R, Yazdani S, Mohamadinejad A. 2011. Price transmission mechanism in the Iranian rice market. International Journal of Agricultural Science and Research. 2(4):31-38
Johansen S. 1998. Statistical analysis of cointegration vectors. Journal of Economic Dynamics and Control, 12(3): 231-254
Meyer J, von Cramon-Taubadel S. 2004. Price transmission: a survey. Journal of Agricultural Economics, 55(3): 581-611.
NeilMcCulloch. 2008. Rice prices and poverty in Indonesia. Bulletin of Indonesian Economic Studies, 44(1): 45-64
Ngare LW, Wambugu SK, Nzuma JM, Shisanya C. 2013. Asymmetric price transmission in food markets in highland of Central Kenya. 4th International Conference of the African Association of Agricultural Economists, September 22-25, 2013, Hammamet, Tunisia. [Internet]. [Downloaded on December 29, 2017]. Available on: http://ageconsearch.umn.edu/bitstream/161448/2.
Ruslan, JA. 2016. Transmisi harga dan perilaku pasar bawang merah [Thesis]. Bogor (ID): Instititut Pertanian Bogor
Sahara, Wicaksena B. 2013. Asymmetry in farm-retail price transmission: the case of chili industry in Indonesia. Jurnal Ekonomi dan Kebijakan Pembangunan. 2(1): 1-13.
Sapuan. 2000. Perjalanan Bulog 35 Tahun: Refleksi Terhadap Pelaksanaan Tugas Pokoknya. Dalam Bulog: Pergulatan Dalam Pemantapan Peranan dan Penyesuaian Kelembagaan. Kumpulan Naskah Dalam Rangka Menyambut 35 Tahun Bulog. Bogor (ID): IPB Pr.
Varela GJ, Lacovone L, Aldaz-Carroll E. 2013. Determinants of market integration and price transmission in Indonesia. Journal of Southeast Asian Economies, 30(1): 19-44.
Wibowo AD, Moeis AO, Wiguna CB, Chaulan TAC. 2015. Policy model of production and price of rice in Kalimantan Selatan. Agriculture and Agricultural Science Procedia 3, (2015): 266-273
Appendix 1. Estimation of Asymmetric Price Model of Rice in Indonesia
Var
KDKI- PJTG
PJTG- KDKI
KPAB- PJTG
PJTM- KDKI
KDKI- PJTM
KDKI- PLMP
KDKI- PJBR
PJBR- KDKI
KPAB- PJBR
C
17,11a
15,03
74,11
16,15
31,61
121,87
53,17
12,65
82,74
(0,71)b
(0,66)
(0,18)
(0,65)
(0,45)
(0,10)
(0,27)
(0,72)
(0,12)
dP(t-2)+
-0,29
0,6
0,05
0,13
0,2
0,11
-0,29
0,6
0,02
(0,24)
(0,004)
(0,83)
(0,52)
(0,34)
(0,56)
(0,26)
(0,004)
(0,93)
dP(t-2)-
0,12
-0,27
0,07
-0,19
0,13
-0,35
0,06
-0,28
0,02
(0,35)
(0,009)
(0,51)
(0,18)
(0,38)
(0,03)
(0,64)
(0,009)
(0,82)
dK(t-2)+
-0,06
-0,11
0,15
-0,1
-0,14
-0,06
-0,04
-0,11
0,19
(0,74)
(0,44)
(0,35)
(0,50)
(0,39)
(0,83)
(0,83)
(0,45)
(0,26)
dK(t-2)-
-0,08
0,14
0,22
-0,002
0,008
-0,03
-0,07
0,14
0,26
(0,73)
(0,47)
(0,22)
(0,99)
(0,97)
(0,93)
(0,77)
(0,45)
(0,17)
dP(t-1)+
0,51
0,54
0,55
0,31
0,21
0,08
0,54
0,54)
0,65
(0,04)
(0,01)
(0,02)
(0,14)
(0,33)
(0,67)
(0,03)
(0,01)
(0,007)
dP(t-1)-
0,34
-0,1
0,28
0,02
0,3
-0,22
0,31
-0,11
0,28
(0,007)
(0,35)
(0,01)
(0,90)
(0,08)
(0,15)
(0,02)
(0,34)
(0,02)
dK(t-1)+
0,3
-0,09
0,13
-0,08
-0,12
-0,03
0,36
-0,09
0,06
(0,21)
(0,51)
(0,27)
(0,59)
(0,56)
(0,94)
(0,15)
(0,53)
(0,59)
dK(t-1)-
-0,31
0,28
-0,11
0,18
-0,22
-0,15
-0,34
0,29
0,06
(0,24)
(0,15)
(0,65)
(0,37)
(0,35)
(0,73)
(0,20)
(0,15)
(0,79)
dP(t)+
0,1
0,19
0,1
(0,59)
(0,34)
(0,61)
dP(t)-
-0,04
-0,4
-0,04
(0,68)
(0,03)
(0,67)
dK(t)+
0,27
0,07
-0,001
0,24
0,33
0,009
(0,17)
(0,53)
(0,99)
(0,44)
(0,09)
(0,94)
dK(t)-
0,34
-0,28
-0,05
-0,29
-0,04
-0,13
(0,16)
(0,31)
(0,81)
(0,50)
(0,83)
(0,62)
ECT+
0,27
0,2
0,1
0,21
0,22
0,06
0,04
0,19
-0,01
(0,21)
(0,09)
(0,68)
(0,09)
(0,25)
(0,80)
(0,83)
(0,09)
(0,95)
ECT-
0,34
0,21
0,67
0,24
0,43
0,81
0,38
0,18
0,56
(0,16)
(0,17)
(0,02)
(0,14)
(0,04)
(0,003)
(0,08)
(0,24)
(0,02)
R2
0,47
0,36
0,58
0,28
0,31
0,31
0,45
0,34
0,55
R2ADJ
0,36
0,22
0,49
0,13
0,17
0,16
0,33
0,2
0,45
FSTAT
4,22
2,58
6,48
1,86
2,13
2,11
3,82
2,46
4,9
(0,0001)
(0,008)
(0,00000)
(0,06)
(0,03)
0,03)
(0,0003)
(0,01)
(0,00003)
Note: a Estimation parameter b p-value, letter (K) at the beginning of the province name describes the consumer price, letter (P) at the beginning of the province name describes the producer price. DKI (DKI Jakarta), JTG (Central Java), PAB (West Papua).JBR (West Java), LMP (Lampung), JTM (East Java)