ABSTRACT
Under the requirements of the AMS reduction and competitiveness improvement in the rice sector, the government has been implementing the Rice Production and Marketing Areas (RPMA) program in Taiwan since 2005. It rewarded operation units with price that is higher than the guaranteed price of government through making contact with rice farmers, and to run a business model by integrated value chain. The purposes of this study are to evaluate the policy performance in terms of government expenditure and farmers’ income, and estimate profit efficiency of operation unit in the RPMA program. It found that the program of the government’s purchasing paddy reduction and expenditure savings has some effects. Farmers’ income would be extra increased from participating in the program. Besides, profit efficiency of operation units which participated in the program is also higher compared to than non-RPMA. It revealed that the core strategy for the RPMA program is to enhance rice value-added.
Keywords: rice, price support, profit efficiency, metafrontier model
INTRODUCTION
Rice is the most important industry in the agricultural sector in Taiwan, and it is also an industry that invests the most resources and government expenditures. However, thr government purchases rice at a guaranteed price that distorts market mechanism, reduces efficiency of resource allocation, and causes a heavy financial burden on the government. At the same time, it also faces pressure from the WTO to reduce AMS. Therefore, the government started to implement the "Rice Production and Marketing Area"(RPMA) program in 2005, hoping to reduce the government's purchase expenditure and AMS through reward payment for grain merchants to encourage making production contract with rice farmers. The RPMA program is accompanied by the common production operations and marketing activities and it can ensure the quality of domestic rice and establish its own brand. It is expected to benefit to the rice industry in terms ofupgrading quality standards and competiveness.
The purpose of this paper is to evaluate the RPMA program performance in terms of government expenditure, farmer’ revenue and profit efficiency of grain merchants, so as to provide a reference basis for rice industry development and policy reforms in Taiwan. The rest of the paper is organized as follows. The next section briefly describes the features and current situation of RPMA. Section 3 evaluates RPMA by rice policy review and its influence on government’s purchasing quantity and expenditures and farmers’ revenue. Section 4, on the other hand, focuses on profit efficiency estimation and its determinations for grain merchants who participated in the RPMA program. Finally, the last section is the conclusion and outlook for the RPMA program.
I. Rice Production and Marketing Area (RPMA)
Features
In order to avoid the impact from importing rice in the domestic rice industry Taiwan has the joined World Trade Organization in 2002 and emphasized domestic rice production with its own brand that symbolizes good quality. The government has been trying to do rice industry adjustment since 2005. The promotion of the RPMA program is one of the adjustment strategies. Government encourages Farmers’ Associations and grain merchants as operation unit to coordinate with local rice farmers, nursery operators and millers to establish a RPMA which at least 50 hectares. It is expected to have advantages in in terms of the RPMA’s production integration and economic scale.
The most important thing is that operation units have to make contract with participating farmers at higher price compared to the guaranteed price of government purchases. It could raise farmers’ income and reduce government purchasing rice and expenditure. On the other hand, operation units can get reward payment from the government to implement the RPMA program to support higher price under contract and related spending on production integration, farmers’ education and product marketing.
Although there are multiple meanings for rice farmers, the government, grain merchants and even consumers, the final target of the RPMA program is to enhance competitiveness and value-added for rice industry in Taiwan.
Implementation
The RPMA program has been in operation since 2005. It started with 27 operation units which included Farmers’ Associations and grain merchants with 4,908 hectares total, then increasing to 63 operation units with a total of 23,292 hectares as shown in Table 1. Because of affording payment at higher contract price to participating farmers, the number of operation units failed to increase as expected. It still less than 7% in terms of total rice plant hectares. Fortunately, the number of operation units and participating hectares had significantly increased in the past two years.
Table 1. Implementation of the RPMA program during 2005-2017
|
Year
|
Participated area
|
Participated farmers
|
Reward payment
|
Contract price
|
Guaranteed price
|
Production
|
|
Unit
|
Hectares
|
People
|
NTD 10 thousand
|
NTD/KG
|
NTD/KG
|
MT
|
|
2005
|
4,908
|
2,301
|
3,873
|
22.37
|
19.88
|
26,863
|
|
2006
|
8,023
|
2,915
|
5,626
|
23.14
|
19.88
|
40,490
|
|
2007
|
10,480
|
4,828
|
4,854
|
22.79
|
19.88
|
57,582
|
|
2008
|
9,897
|
6,731
|
4,513
|
23.72
|
19.88
|
56,994
|
|
2009
|
10,487
|
4,170
|
4,859
|
23.67
|
21.88
|
59,881
|
|
2010
|
13,978
|
4,911
|
6,653
|
23.83
|
21.88
|
80,299
|
|
2011
|
14,356
|
5,329
|
6,838
|
26.53
|
21.88
|
90,913
|
|
2012
|
14,556
|
4,281
|
8,676
|
25.26
|
24.91
|
93,698
|
|
2013
|
15,103
|
4,555
|
8,465
|
26.21
|
24.91
|
79,471
|
|
2014
|
15,721
|
4,304
|
11,335
|
26.64
|
24.91
|
92,797
|
|
2015
|
16,451
|
5,180
|
7,159
|
26.40
|
24.91
|
98,943
|
|
2016
|
19,503
|
7,668
|
8,601
|
26.73
|
24.91
|
95,547
|
|
2017
|
23,292
|
12,974
|
12,778
|
25.05
|
24.91
|
136,049
|
Source: Agriculture and Food Agency, Council of Agriculture.
Basically, the reward payment provided by the government is a key factor to attract Farmers’ Associations and grain merchants to participate in the RPMA program. The correlation coefficient is 0.86 between reward payment and participated hectares. The government could have a balance consideration on the reward payment and purchasing expenditure saving to decide whether to increase reward payment for expansion and exclusion of the participated hectares.
The operation units could be Farmers’ Association and grain merchant with different business culture and objectives. There were 21 Farmers’ Associations and grain merchants and 42 grain merchants who participated in the RPMA program in 2017. Under the consideration of market size and capital stock, Farmers’ Association and grain merchants sell milled rice mainly and partly from what it purchased paddy rice from the RPMA, respectively.
Table 2 indicates that average contract price of Farmers’ Association is 27.13 NTD/Kg, which is higher than grain merchants, 25.28 NTD/Kg. It reveals that Farmers’ Association has been supporting farmers’ income instead of just searching for profit maximization. The average participated area for Farmers’ Association is 289 hectares, which is smaller than grain merchants, 413 hectares. It would affect benefit of economic scale. The average scale for each participated farmers’ of Farmers’ Association is 1.62 hectares, which is lower than grain merchants, 1.86 hectares, as well.
Table 2. Current situation of the RPMA program in 2017
|
|
Number
|
Participated area
|
Production
|
Participated farmers
|
Reward payment
|
Contract price
|
Participated area
|
Farmerspated a
|
|
Unit
|
Hectares
|
%
|
MT
|
%
|
People
|
NTD thousand
|
NTD/KG
|
Unit
|
Hectares
|
|
Farmers’ Association
|
21
|
6,070
|
26
|
36,055
|
27
|
3,739
|
29,010
|
27.13
|
289
|
1.62
|
|
Grain Merchant
|
42
|
17,337
|
74
|
100,660
|
74
|
9,342
|
99,350
|
25.28
|
413
|
1.86
|
|
Total
|
63
|
23,292
|
100
|
136,049
|
100
|
12,974
|
127,780
|
25.98
|
370
|
1.80
|
|
North
|
12
|
1,362
|
6
|
7,571
|
6
|
652
|
13,890
|
25.27
|
113
|
2.09
|
|
Central
|
22
|
6,299
|
27
|
40,397
|
30
|
5,576
|
51,260
|
23.08
|
286
|
1.13
|
|
South
|
8
|
2,100
|
9
|
14,718
|
11
|
1,209
|
7,690
|
24.46
|
263
|
1.74
|
|
East
|
21
|
13,531
|
58
|
73,363
|
54
|
5,537
|
54,940
|
25.49
|
644
|
2.44
|
Source: Agriculture and Food Agency, Council of Agriculture.
The RPMA program is a kind of contract farming which is based on mutual benefit for farmers and operation units participation. It has been in existence for many years as a means of organizing the commercial agricultural production of both large-scale and small-scale farmers. Eaton and Shephered (2001) pointed out contract farming is beneficial to farmers’ price risk that is often reduced as many contracts specify prices in advance and can open up new markets which would otherwise be unavailable to small farmers. Operation units also gained more consistent quality and quantity which can be obtained than if purchases were made in the open market. There are more than 70% of operation units using brand that is endorsed by the RPMA program to increase rice price and competitiveness (Chen and Yang, 2007).
Since there are different production condition in Taiwan, there is only one crop season in the Northern part that is different from other parts with two crop seasons. Western farmers have been searching for quantity increase, unlike eastern farmers who emphasize quality improvement. Therefore, for regional distribution of participating in the RPMA program, the East part participate most, 58%, and contract price, 25.49 NT/Kg, which is also higher than other parts.
II. Policy evaluation
Rice industry and policy
Rice is staple food and the most important crop in Taiwan. Harvested area is 273,837 hectares, where first crop is 168,872 hectares and second crop is 104,965 hectares in 2017. Production quantity in terms of paddy rice is 1,587,776 MT.
For ensuring food security and raising farmers’ income, government has been implementing policy of purchasing paddy rice at guaranteed price which is higher than market price. The purchasing system is made up of three layers: planned purchase, guidance purchase and surplus purchase with different guaranteed price and quantities. The weighted average guaranteed price is 24.91 NT/Kg, which is higher than farm gate price 23.91 NT/Kg, as shown in Table 3. Government purchased paddy rice for 312,033 MT, which accounted for nearly 20% of total production in 2017.
Theoretically, quantity purchased by government depends on guaranteed price and price difference between guaranteed price and farm gate price. In the past, government raised guaranteed price several times to raise farmers’ income. It also stimulated rice plant area and production expansion which resulted in the problem of much purchasing quantity and excess inventory. In 2011, government raised guaranteed price by 3 NT/KG. It brought about significant jumps in purchasing quantity 406,223 MT and expenditure over 10 billion NTD in 2013.
Although there were many contributions on food security and farmers’ income, there have also been many criticisms always on the policy of purchasing paddy rice at guaranteed price, including market mechanism distortion, government financial burden, resources allocation inefficiency and crops production imbalance, etc. However, due to political consideration, it is hard to terminate the policy. The reason for promoting the RPMA program is trying to partially substitute purchasing paddy rice at guaranteed price and solve some related problems.
Table 3. Government paddy purchase price and quantity
|
Year
|
Harvested area
|
Production
|
Quantity
|
Expenditure
|
Purchased price
|
Farm gate price
|
| |
Hectares
|
MT
|
MT
|
NTD thousand
|
NT/KG
|
NT/KG
|
|
2004
|
237,015
|
1,433,610
|
259,386
|
5,255,997
|
19.88
|
18.70
|
|
2005
|
269,023
|
1,467,138
|
207,230
|
4,232,397
|
19.88
|
19.49
|
|
2006
|
263,188
|
1,558,048
|
245,414
|
5,065,428
|
19.88
|
18.93
|
|
2007
|
260,116
|
1,363,458
|
215,246
|
4,390,569
|
19.88
|
18.38
|
|
2008
|
252,292
|
1,457,175
|
204,793
|
4,584,728
|
21.88
|
21.87
|
|
2009
|
254,590
|
1,578,169
|
182,452
|
4,171,559
|
21.88
|
22.12
|
|
2010
|
243,862
|
1,451,011
|
190,453
|
4,327,709
|
21.88
|
20.77
|
|
2011
|
254,255
|
1,666,273
|
345,400
|
8,678,807
|
24.91
|
21.60
|
|
2012
|
260,762
|
1,700,229
|
375,438
|
9,425,589
|
24.91
|
23.10
|
|
2013
|
270,165
|
1,589,564
|
406,223
|
10,192,801
|
24.91
|
22.17
|
|
2014
|
271,051
|
1,732,210
|
367,124
|
9,218,938
|
24.91
|
24.03
|
|
2015
|
251,861
|
1,581,732
|
294,686
|
7,403,341
|
24.91
|
23.08
|
|
2016
|
273,837
|
1,587,776
|
312,033
|
7,819,173
|
24.91
|
23.91
|
Source: Agriculture and Food Agency, Council of Agriculture (2017), Taiwan Food Statistics Book.
Policy evaluation on the RPMA program
Since emphasizing on quantity increase rather than quality improvement under oriented by the policy of purchasing paddy rice at guaranteed price in Taiwan, the government continually promotes a series of rice industry adjustments, which includes the RPMA program. Based on experiences of farmers who participated in the planned purchase and guidance purchase, the estimated reduction of the government’s purchasing paddy rice was 46,584 MT with expenditure saving 1.1 billion in 2017 as shown in Table 4. Compared with reward payment 0.12 billion. The government benefitted from a net expenditure savings of about 1 billion NTD.
Besides, farmers’ income would be extra increased from contract price, which is higher than government’s guaranteed price, by at least 0.1billin total. For instance, farmers’ income increased by 0.145 billion NTD total in 2017; in other words, each farmer’s income increased by 11,178 NTD average, or each hectare increased by 6,227 NTD average.
Table 4. Policy benefit of the RPMA program
|
Year
|
Participated area
|
Equivalent of
government purchase
|
Expenditure
saving
|
Reward payment
|
Increase farmersasethe r
|
|
Total
|
Per hectare
|
Per farmer
|
| |
Hectare
|
MT
|
NTD
thousand
|
NTD thousand
|
NTD
thousand
|
NTD/Hectare
|
NTD/Farmer
|
|
2005
|
4,908
|
9,541
|
191,539
|
38,730
|
66,969
|
13,644
|
29,104
|
|
2006
|
8,023
|
15,597
|
313,105
|
56,260
|
132,040
|
16,457
|
45,297
|
|
2007
|
10,480
|
20,373
|
408,981
|
48,540
|
167,527
|
15,985
|
34,701
|
|
2008
|
9,897
|
19,239
|
424,695
|
45,130
|
219,006
|
22,129
|
32,537
|
|
2009
|
10,487
|
20,387
|
450,028
|
48,590
|
107,039
|
10,207
|
25,669
|
|
2010
|
13,978
|
27,172
|
599,816
|
66,530
|
156,411
|
11,190
|
31,849
|
|
2011
|
14,356
|
28,712
|
699,792
|
68,380
|
423,089
|
29,470
|
79,394
|
|
2012
|
14,556
|
29,112
|
709,520
|
86,760
|
33,027
|
2,269
|
7,715
|
|
2013
|
15,103
|
30,206
|
736,186
|
84,650
|
102,999
|
6,820
|
22,612
|
|
2014
|
15,721
|
31,442
|
766,324
|
113,350
|
160,823
|
10,230
|
37,366
|
|
2015
|
16,451
|
32,901
|
801,876
|
71,590
|
147,330
|
8,956
|
28,442
|
|
2016
|
19,503
|
39,005
|
950,651
|
86,010
|
174,300
|
8,937
|
22,731
|
|
2017
|
23,292
|
46,584
|
1,135,352
|
127,780
|
145,029
|
6,227
|
11,178
|
Note: Experience of participation rate of planned purchase and guidance purchase is 80% and 60%, respectively. Policy requirement on 1st crop and 2nd crop of planned purchase is 2,000 KG and 1,500 KG, respectively, and on 1st crop and 2nd crop of guidance purchase is 1,200 KG and 800 KG, respectively,
Source: the author’s estimation.
OPERATION PERFORAMNCE EVALUATION
Considerations of operation units
Participants of the RPMA program are government, farmers, operation units (i.e. Farmers’ Association and grain merchants). In the above analysis, the program is beneficial to government’s expenditure saving and raising of farmers’ income. However, the key factor is operation unit participation. If operation units would improve their efficiency and profit, it is expected that more operation units would participate in the RPMA program in the future.
Contrast to production efficiency estimation used inputs and out data, this paper emphasizes profit efficiency estimation used cost and revenue data, which is consistent with operation units consideration about profit objective.
O’Donnell, Battese and Rao (2008) suggested application of Metafrontier model to estimate profit efficiency of operation units with different scale, area and business culture.
Model specification
Assume the form of profit function of operation units is random translog. We can build a profit Metafrontier function as follow (Battese et al., 2004; O’Donnell et al., 2008):
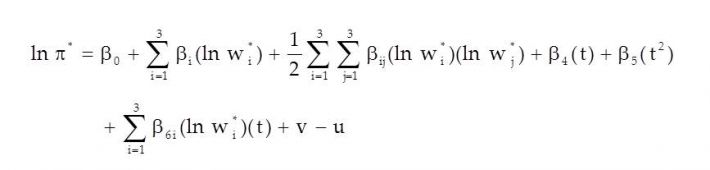
Where πis operation unit’s standardized profit deflated by milled rice sale price, W1 , W2 and W3 are standardized paddy rice purchase price, process cost and salary, respectively. βare parameters. Error term consists of random error (vit(j)) and profit inefficiency (uit(j)), the former assumed to be normal distribution and the latter is actual profit for the i operation unit in t year which might deviate from optimal profit in the group j; i.e, it means profit inefficiency. It is assumed that vit(j) is independent of uit(j).
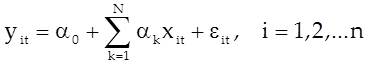
We will estimate profit efficiency step by step. Firstly, application of Stochastic Frontier Analysis (SFA) and Maximum Likelihood Estimation (MLE) to estimate profit efficiency of the i operation unit in group j. Secondly, constitute random profit function of each group as follow:
Where i=1,2,… Nj, t=1,2,…T, and j=1,2, …K represent different operation unit, time and group, respectively.
The purposes of random profit function are to estimate profit efficiency of the RPMA or not and its profit efficiency ratio. Thirdly, we then judge estimated profit efficiency difference by Likelihood ratio. If reject null hypothesis, it means there is different profit efficiency in participation of the RPMA program or not. Finally, application of GAUSS software suggested by Battese et al. (2004) incorporate estimated parameters of each group into linear programming (LP) and quadratic programming (QP) to estimate optimal parameter of profit Metafrontier as follow:
.jpg)
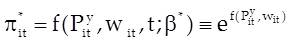
Where πit is profit on Metafrontier. It represents potential profit for operation unit with opitimal resource allocation and as a basis for Metaprofit efficiency and Metaprofit ratio calculation.
Empirical results
Profit efficiency
Estimated parameters of operation units in the PRAM, non-PRAM and total are shown in appendix table A1. There are 8-9 estimated parameters are 10% significant, and 1% significant by likelihood ratio testing on total operation units. It means that there is significant difference among operation units. Therefore, it is inappropriate estimation by random profit function and should apply profit meta-frontier model for profit efficiency analysis.
We used LP and QP to estimate parameters in the profit meta-frontier model. Since both results are similarity, hereafter, we will only show empirical results by LP estimation.
Because of operation units purchased paddy rice mostly/partially from contract production under the RPMA program, we can divide them into RPMA and non-RPMA with different production and marketing mode. It is assumed both modes have different profit performance and group profit efficiency frontier. Then, there is a frontier that is an envelope in both groups’ profit efficiency frontiers. The Group Profit Efficiency (GPE) is ratio of operation unit’s actual profit to optimal profit on their group profit frontier. Table 5 shows that the GPE of operation unit in RPMA and non-RPMA is 0.9100 and 0.7242, respectively. In other words, operation unit used non-RPMA mode with lower profit efficiency. It should do something in both increasing price and lowering cost to shorten the distance to optimal profit.
Table 5. Total and group profit efficiency estimation and testing
|
Group
|
GPE
|
MPE
|
Testing
|
MPE/GPE
|
Testing
|
|
RPMA
|
0.9100
|
0.8065
|
RPMA>non-RPMA***
|
0.8863
|
RPMA>non-RPMA***
|
|
Non-RPMA
|
0.7242
|
0.5760
|
0.7954
|
|
Total
|
0.8148
|
0.6913
|
|
0.8484
|
|
Note:*, **, *** represent 10%、5%、1% significance.
Source: the author’s estimation.
Since belonging to different group frontier, both group’s GPE cannot directly make comparison. We consider Meta Profit Efficiency (MPE) which is able to incorporate all operation units together. MPE is ratio of operation unit’s actual profit to potential profit on profit meta-frontier. The MPE is 0.6913 which means there is 30.87% of profit inefficiency to be improved. On the other hand, the MPE of operation unit in RPMA and non-RPMA is 0.8065 and 0.5760, respectively. Based on non-parametric Mann-Whitney testing, MPE in RPMA is significantly higher than in non-RPMA. Although contract price and processing cost are higher in RPMA than in non-RPMA, sale price is much higher in RPMA than in non-RPMA. The key factor is how to increase rice value-added. It could be a core strategy for developing the RPMA program in the future.
The MPE/GPE ratio also estimated for operation unit in RPMA and non-RPMA is 0.8863 and 0.7954, respectively. It indicates that Farmers’ Association and grain merchant both participating in the RPMA program could significantly improve their profit performance.
Determinants of profit efficiency
For exploring determinants of profit efficiency, it is supposed to be relevant to number of rice species, brands, channels, and channel types. We specified Tobit regression equation as follow:
Where yit is a vector of GPE, MPE and GPE/MPE of i operation unit in t year, xit is vector of rice species, brands, channels, and channel types, respectively. αk are coefficients of relevant variables. 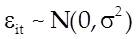 is error disturbance.
Regression results are shown in Table 6. We learned that variety of rice species, brand concentration and home delivery would enhance GPE of operation unit in the RPMA and non-RPMA program. In addition, variety of rice species and less brands of operation unit would improve its MPE and MPE/GPE. Those channels located in department stores, organic stores, and home delivery has better performance in terms of profit efficiency. We can conclude that the RPMA program not only emphasize business model innovation, but also has to consider rice species, focus branding and choice of channel type in order to achieve the core objective, profit maximization, of operation unit.
Table 6. Results of Tobin regression: determinants of GPE and MPE
|
|
GPE
|
MPE
|
MPE/GPE
|
|
RPMA
|
Non-RPMA
|
|
Constant
|
0.8614
|
***
|
0.7972
|
***
|
0.5361
|
***
|
0.6950
|
***
|
|
(0.1224)
|
|
(0.1910)
|
|
(0.1552)
|
|
(0.2401)
|
|
|
Rice species
|
0.0243
|
**
|
-0.0024
|
|
0.0612
|
*
|
0.0295
|
*
|
|
(0.0096)
|
|
(0.0393)
|
|
(0.0320)
|
|
(0.0160)
|
|
|
Brands
|
-0.0163
|
*
|
-0.0234
|
*
|
-0.0136
|
*
|
0.0339
|
|
|
(0.0092)
|
|
(0.0140)
|
|
(0.0072)
|
|
(0.0256)
|
|
|
Channels
|
0.0068
|
|
0.0253
|
*
|
0.0135
|
|
0.0256
|
*
|
|
(0.0055)
|
|
(0.0134)
|
|
(0.0105)
|
|
(0.0145)
|
|
|
E-commerce
|
0.0430
|
|
0.0488
|
|
0.1536
|
|
0.0531
|
|
|
(0.0337)
|
|
(0.0371)
|
|
(0.1053)
|
|
(0.0474)
|
|
|
Home delivery
|
0.0156
|
*
|
0.1177
|
|
0.1183
|
**
|
-0.0100
|
|
|
(0.0085)
|
|
(0.1071)
|
|
(0.0497)
|
|
(0.0361)
|
|
|
Department stores & organic stores
|
-0.0217
|
|
|
|
0.0909
|
*
|
0.0195
|
*
|
|
(0.0301)
|
|
|
|
(0.0493)
|
|
(0.0113)
|
|
Note: Number in parenthesis is standard error. Dummy variables for e-commerce, home delivery, department stores & organic stores, respectively. *, **, *** represent 10%、5%、1% significance.
Source: the author’s estimation.
CONCLUSIONS AND OUTLOOK
Rice industry is the most important industry in Taiwan’s agricultural sector. The government has been spending a lot by purchasing rice at guaranteed price, which causes financial burden, market mechanism distortion and resources misallocation. Under requirements of AMS reduction and competitiveness improvement, the government began implementing the Rice Production and Marketing Areas (RPMA) program in 2005. It rewarded operation units to make contact with rice farmers at a higher price than the government’s guaranteed price, and to run a business model by integrated value chain. The purposes of this study are to evaluate policy performance in terms of government expenditure and farmers’ income, and estimate profit efficiency of operation unit in the RPMA program.
The RPMA program has been in operations since 2005. It started with 27 operation units which included Farmers’ Associations and grain merchants and 4,908 hectares total, then increasing to 63 operation units with a total of 23,292 hectares total. Basically, the reward payment provided by the government is a key factor to attract Farmers’ Associations and grain merchants to participate in the RPMA program. The correlation coefficient is 0.86 between reward payment and participated hectares. Government could have a balance consideration on reward payment and purchasing expenditure saving to decide whether to increase the reward payment for participated hectares expansion or not.
Regarding the policy evaluation on the RPMA program, it has achieved the objectives of government’s purchasing paddy rice reduction. For example, we estimated reduction of government purchasing paddy rice at 46,584 MT and expenditure saving 1.1 billion in 2017. Government benefitted from a net expenditure saving of about 1 billion compared to 0.12 billion from reward payment. Besides, farmers’ income would be extra increased from contract price, which is higher than government guaranteed price by at least 0.1billin total. For instance, farmers’ income increased by 0.145 billion NTD total in 2017; in other words, each farmer’s income increased by 11,178 NTD average, or each hectare increased by 6,227 NTD average.
Participants of the RPMA program are government, farmers, operation units (i.e. Farmers’ Association and grain merchants). As analysis above, the program is beneficial to government’s expenditure saving and farmers’ income raising. However, the key factor is operation unit participation. If operation units would improve their efficiency and profit, it is expected that more operation units would participate in the RPMA program in the future.
We applied the Metafrontier model to estimate profit efficiency of operation units. Empirical results showed that the GPE of operation unit in RPMA and non-RPMA is 0.9100 and 0.7242, respectively. In other words, operation unit used non-RPMA mode with lower profit efficiency. It should do something in both increasing price and lowering cost to shorten the distance to optimal profit.
In addition, we consider Meta Profit Efficiency (MPE) which is able to incorporate all operation units together. MPE is ratio of operation unit’s actual profit to potential profit on profit meta-frontier. The MPE is 0.6913 which means there is 30.87% of profit inefficiency to be improved. On the other hand, the MPE of operation unit in RPMA and non-RPMA is 0.8065 and 0.5760, respectively. Based on non-parametric Mann-Whitney testing, MPE in RPMA is significantly higher than in non-RPMA. Although contract price and processing cost are higher in RPMA than in non-RPMA, sale price is much higher in RPMA than in non-RPMA. The key factor is how to increase rice value-added. It could be a core strategy for developing the RPMA program in the future.
This paper made regression on profit inefficiency, it showed that variety of rice species, brand concentration and home delivery would enhance GPE of operation unit in the RPMA and non-RPMA program. Those channels located in department stores, organic stores, and home delivery have better performance in terms of profit efficiency. We can conclude that the RPMA program not only emphasize business model innovation, but also has to consider rice species, focus branding and choice of channel type in order to achieve the core objective, profit maximization, of operation unit.
The RPMA program has been running for 14 years in Taiwan. Participation of grain merchants, farmers, and areas has constantly grown. However, participated area is only 8.5% of rice plant area. Since the program has effects of government purchasing paddy rice reduction, government expenditure saving and farmers’ income raise, government should actively encourage more grain merchants to participate in the program. Grain merchants will also improve its profit efficiency, build its own brand and have a better business performance after participating the program. We can say the RPMA program is a win-win-win program which is beneficial to government, farmers and grain merchants. Furthermore, products under the RPMA should be required by Taiwan Good Aquaculture Practice (TGPA), which ensures rice quality and safety. Actually, the RPMA program is also good for consumers.
From this year, the Taiwan government started implementing rice direct payment program, which is an alternative to government purchasing paddy at guaranteed price for farmers. This is if more rice farmers decide to take direct payment instead of selling to government at guaranteed price. The influence of government purchasing paddy at guaranteed price on purchased quantity and expenditure will decrease. We can expect that rice industry would move towards high quality and value-added development.
REFERENCES
Agriculture and Food Agency, Council of Agriculture (2017), Taiwan Food Statistics Book.
Battese, G. E., Rao, D. S. P. and O’Donnell, C. J.(2004), “A Metafrontier Production Function for Estimation of Technical Efficiencies and Technology Gaps for Firms Operating Under Different Technologies,” Journal of Productivity Analysis, 21(1), 91-103.
Chen, J. L. and M.H. Yang (2007), Study on Operation and Performance of Rice Production and Marketing Area, Project Report supported by the Agriculture and Food Agency, Council of Agriculture.
Eaton, E. and Shephered, A. W. (2001), “Contract Farming,” FAO Agricultural Services Bulletin, Rome.
O’Donnell, C. J., Battese, G. E. and Rao, D. S. P. (2008), “Metafrontier Frameworks for The Study of Firm-level Efficiencies and Technology Ratios,” Empirical Economics, 34(2), 231-255.
APPENDIX
Table A1. Estimation results of parameters and its standard error
.jpg)
Note: number in parenthesis is standard error, and *, **, *** represent 10%、5%、1% significance. Standard errors in LP and QP are estimated by Booth-strapping method.
Source: the author’s estimation.
|
(Submitted as a paper for the International Seminar on “Promoting Rice Farmers’ Market through value-adding Activities”, June 6-7, 2018, Kasetsart University, Thailand)
|

Evaluation of Policy Performance and Profit Efficiency of Rice Production and Marketing Areas in Taiwan
ABSTRACT
Under the requirements of the AMS reduction and competitiveness improvement in the rice sector, the government has been implementing the Rice Production and Marketing Areas (RPMA) program in Taiwan since 2005. It rewarded operation units with price that is higher than the guaranteed price of government through making contact with rice farmers, and to run a business model by integrated value chain. The purposes of this study are to evaluate the policy performance in terms of government expenditure and farmers’ income, and estimate profit efficiency of operation unit in the RPMA program. It found that the program of the government’s purchasing paddy reduction and expenditure savings has some effects. Farmers’ income would be extra increased from participating in the program. Besides, profit efficiency of operation units which participated in the program is also higher compared to than non-RPMA. It revealed that the core strategy for the RPMA program is to enhance rice value-added.
Keywords: rice, price support, profit efficiency, metafrontier model
INTRODUCTION
Rice is the most important industry in the agricultural sector in Taiwan, and it is also an industry that invests the most resources and government expenditures. However, thr government purchases rice at a guaranteed price that distorts market mechanism, reduces efficiency of resource allocation, and causes a heavy financial burden on the government. At the same time, it also faces pressure from the WTO to reduce AMS. Therefore, the government started to implement the "Rice Production and Marketing Area"(RPMA) program in 2005, hoping to reduce the government's purchase expenditure and AMS through reward payment for grain merchants to encourage making production contract with rice farmers. The RPMA program is accompanied by the common production operations and marketing activities and it can ensure the quality of domestic rice and establish its own brand. It is expected to benefit to the rice industry in terms ofupgrading quality standards and competiveness.
The purpose of this paper is to evaluate the RPMA program performance in terms of government expenditure, farmer’ revenue and profit efficiency of grain merchants, so as to provide a reference basis for rice industry development and policy reforms in Taiwan. The rest of the paper is organized as follows. The next section briefly describes the features and current situation of RPMA. Section 3 evaluates RPMA by rice policy review and its influence on government’s purchasing quantity and expenditures and farmers’ revenue. Section 4, on the other hand, focuses on profit efficiency estimation and its determinations for grain merchants who participated in the RPMA program. Finally, the last section is the conclusion and outlook for the RPMA program.
I. Rice Production and Marketing Area (RPMA)
Features
In order to avoid the impact from importing rice in the domestic rice industry Taiwan has the joined World Trade Organization in 2002 and emphasized domestic rice production with its own brand that symbolizes good quality. The government has been trying to do rice industry adjustment since 2005. The promotion of the RPMA program is one of the adjustment strategies. Government encourages Farmers’ Associations and grain merchants as operation unit to coordinate with local rice farmers, nursery operators and millers to establish a RPMA which at least 50 hectares. It is expected to have advantages in in terms of the RPMA’s production integration and economic scale.
The most important thing is that operation units have to make contract with participating farmers at higher price compared to the guaranteed price of government purchases. It could raise farmers’ income and reduce government purchasing rice and expenditure. On the other hand, operation units can get reward payment from the government to implement the RPMA program to support higher price under contract and related spending on production integration, farmers’ education and product marketing.
Although there are multiple meanings for rice farmers, the government, grain merchants and even consumers, the final target of the RPMA program is to enhance competitiveness and value-added for rice industry in Taiwan.
Implementation
The RPMA program has been in operation since 2005. It started with 27 operation units which included Farmers’ Associations and grain merchants with 4,908 hectares total, then increasing to 63 operation units with a total of 23,292 hectares as shown in Table 1. Because of affording payment at higher contract price to participating farmers, the number of operation units failed to increase as expected. It still less than 7% in terms of total rice plant hectares. Fortunately, the number of operation units and participating hectares had significantly increased in the past two years.
Table 1. Implementation of the RPMA program during 2005-2017
Year
Participated area
Participated farmers
Reward payment
Contract price
Guaranteed price
Production
Unit
Hectares
People
NTD 10 thousand
NTD/KG
NTD/KG
MT
2005
4,908
2,301
3,873
22.37
19.88
26,863
2006
8,023
2,915
5,626
23.14
19.88
40,490
2007
10,480
4,828
4,854
22.79
19.88
57,582
2008
9,897
6,731
4,513
23.72
19.88
56,994
2009
10,487
4,170
4,859
23.67
21.88
59,881
2010
13,978
4,911
6,653
23.83
21.88
80,299
2011
14,356
5,329
6,838
26.53
21.88
90,913
2012
14,556
4,281
8,676
25.26
24.91
93,698
2013
15,103
4,555
8,465
26.21
24.91
79,471
2014
15,721
4,304
11,335
26.64
24.91
92,797
2015
16,451
5,180
7,159
26.40
24.91
98,943
2016
19,503
7,668
8,601
26.73
24.91
95,547
2017
23,292
12,974
12,778
25.05
24.91
136,049
Source: Agriculture and Food Agency, Council of Agriculture.
Basically, the reward payment provided by the government is a key factor to attract Farmers’ Associations and grain merchants to participate in the RPMA program. The correlation coefficient is 0.86 between reward payment and participated hectares. The government could have a balance consideration on the reward payment and purchasing expenditure saving to decide whether to increase reward payment for expansion and exclusion of the participated hectares.
The operation units could be Farmers’ Association and grain merchant with different business culture and objectives. There were 21 Farmers’ Associations and grain merchants and 42 grain merchants who participated in the RPMA program in 2017. Under the consideration of market size and capital stock, Farmers’ Association and grain merchants sell milled rice mainly and partly from what it purchased paddy rice from the RPMA, respectively.
Table 2 indicates that average contract price of Farmers’ Association is 27.13 NTD/Kg, which is higher than grain merchants, 25.28 NTD/Kg. It reveals that Farmers’ Association has been supporting farmers’ income instead of just searching for profit maximization. The average participated area for Farmers’ Association is 289 hectares, which is smaller than grain merchants, 413 hectares. It would affect benefit of economic scale. The average scale for each participated farmers’ of Farmers’ Association is 1.62 hectares, which is lower than grain merchants, 1.86 hectares, as well.
Table 2. Current situation of the RPMA program in 2017
Number
Participated area
Production
Participated farmers
Reward payment
Contract price
Participated area
Farmerspated a
Unit
Hectares
%
MT
%
People
NTD thousand
NTD/KG
Unit
Hectares
Farmers’ Association
21
6,070
26
36,055
27
3,739
29,010
27.13
289
1.62
Grain Merchant
42
17,337
74
100,660
74
9,342
99,350
25.28
413
1.86
Total
63
23,292
100
136,049
100
12,974
127,780
25.98
370
1.80
North
12
1,362
6
7,571
6
652
13,890
25.27
113
2.09
Central
22
6,299
27
40,397
30
5,576
51,260
23.08
286
1.13
South
8
2,100
9
14,718
11
1,209
7,690
24.46
263
1.74
East
21
13,531
58
73,363
54
5,537
54,940
25.49
644
2.44
Source: Agriculture and Food Agency, Council of Agriculture.
The RPMA program is a kind of contract farming which is based on mutual benefit for farmers and operation units participation. It has been in existence for many years as a means of organizing the commercial agricultural production of both large-scale and small-scale farmers. Eaton and Shephered (2001) pointed out contract farming is beneficial to farmers’ price risk that is often reduced as many contracts specify prices in advance and can open up new markets which would otherwise be unavailable to small farmers. Operation units also gained more consistent quality and quantity which can be obtained than if purchases were made in the open market. There are more than 70% of operation units using brand that is endorsed by the RPMA program to increase rice price and competitiveness (Chen and Yang, 2007).
Since there are different production condition in Taiwan, there is only one crop season in the Northern part that is different from other parts with two crop seasons. Western farmers have been searching for quantity increase, unlike eastern farmers who emphasize quality improvement. Therefore, for regional distribution of participating in the RPMA program, the East part participate most, 58%, and contract price, 25.49 NT/Kg, which is also higher than other parts.
II. Policy evaluation
Rice industry and policy
Rice is staple food and the most important crop in Taiwan. Harvested area is 273,837 hectares, where first crop is 168,872 hectares and second crop is 104,965 hectares in 2017. Production quantity in terms of paddy rice is 1,587,776 MT.
For ensuring food security and raising farmers’ income, government has been implementing policy of purchasing paddy rice at guaranteed price which is higher than market price. The purchasing system is made up of three layers: planned purchase, guidance purchase and surplus purchase with different guaranteed price and quantities. The weighted average guaranteed price is 24.91 NT/Kg, which is higher than farm gate price 23.91 NT/Kg, as shown in Table 3. Government purchased paddy rice for 312,033 MT, which accounted for nearly 20% of total production in 2017.
Theoretically, quantity purchased by government depends on guaranteed price and price difference between guaranteed price and farm gate price. In the past, government raised guaranteed price several times to raise farmers’ income. It also stimulated rice plant area and production expansion which resulted in the problem of much purchasing quantity and excess inventory. In 2011, government raised guaranteed price by 3 NT/KG. It brought about significant jumps in purchasing quantity 406,223 MT and expenditure over 10 billion NTD in 2013.
Although there were many contributions on food security and farmers’ income, there have also been many criticisms always on the policy of purchasing paddy rice at guaranteed price, including market mechanism distortion, government financial burden, resources allocation inefficiency and crops production imbalance, etc. However, due to political consideration, it is hard to terminate the policy. The reason for promoting the RPMA program is trying to partially substitute purchasing paddy rice at guaranteed price and solve some related problems.
Table 3. Government paddy purchase price and quantity
Year
Harvested area
Production
Quantity
Expenditure
Purchased price
Farm gate price
Hectares
MT
MT
NTD thousand
NT/KG
NT/KG
2004
237,015
1,433,610
259,386
5,255,997
19.88
18.70
2005
269,023
1,467,138
207,230
4,232,397
19.88
19.49
2006
263,188
1,558,048
245,414
5,065,428
19.88
18.93
2007
260,116
1,363,458
215,246
4,390,569
19.88
18.38
2008
252,292
1,457,175
204,793
4,584,728
21.88
21.87
2009
254,590
1,578,169
182,452
4,171,559
21.88
22.12
2010
243,862
1,451,011
190,453
4,327,709
21.88
20.77
2011
254,255
1,666,273
345,400
8,678,807
24.91
21.60
2012
260,762
1,700,229
375,438
9,425,589
24.91
23.10
2013
270,165
1,589,564
406,223
10,192,801
24.91
22.17
2014
271,051
1,732,210
367,124
9,218,938
24.91
24.03
2015
251,861
1,581,732
294,686
7,403,341
24.91
23.08
2016
273,837
1,587,776
312,033
7,819,173
24.91
23.91
Source: Agriculture and Food Agency, Council of Agriculture (2017), Taiwan Food Statistics Book.
Policy evaluation on the RPMA program
Since emphasizing on quantity increase rather than quality improvement under oriented by the policy of purchasing paddy rice at guaranteed price in Taiwan, the government continually promotes a series of rice industry adjustments, which includes the RPMA program. Based on experiences of farmers who participated in the planned purchase and guidance purchase, the estimated reduction of the government’s purchasing paddy rice was 46,584 MT with expenditure saving 1.1 billion in 2017 as shown in Table 4. Compared with reward payment 0.12 billion. The government benefitted from a net expenditure savings of about 1 billion NTD.
Besides, farmers’ income would be extra increased from contract price, which is higher than government’s guaranteed price, by at least 0.1billin total. For instance, farmers’ income increased by 0.145 billion NTD total in 2017; in other words, each farmer’s income increased by 11,178 NTD average, or each hectare increased by 6,227 NTD average.
Table 4. Policy benefit of the RPMA program
Year
Participated area
Equivalent of
government purchase
Expenditure
saving
Reward payment
Increase farmersasethe r
Total
Per hectare
Per farmer
Hectare
MT
NTD
thousand
NTD thousand
NTD
thousand
NTD/Hectare
NTD/Farmer
2005
4,908
9,541
191,539
38,730
66,969
13,644
29,104
2006
8,023
15,597
313,105
56,260
132,040
16,457
45,297
2007
10,480
20,373
408,981
48,540
167,527
15,985
34,701
2008
9,897
19,239
424,695
45,130
219,006
22,129
32,537
2009
10,487
20,387
450,028
48,590
107,039
10,207
25,669
2010
13,978
27,172
599,816
66,530
156,411
11,190
31,849
2011
14,356
28,712
699,792
68,380
423,089
29,470
79,394
2012
14,556
29,112
709,520
86,760
33,027
2,269
7,715
2013
15,103
30,206
736,186
84,650
102,999
6,820
22,612
2014
15,721
31,442
766,324
113,350
160,823
10,230
37,366
2015
16,451
32,901
801,876
71,590
147,330
8,956
28,442
2016
19,503
39,005
950,651
86,010
174,300
8,937
22,731
2017
23,292
46,584
1,135,352
127,780
145,029
6,227
11,178
OPERATION PERFORAMNCE EVALUATION
Considerations of operation units
Participants of the RPMA program are government, farmers, operation units (i.e. Farmers’ Association and grain merchants). In the above analysis, the program is beneficial to government’s expenditure saving and raising of farmers’ income. However, the key factor is operation unit participation. If operation units would improve their efficiency and profit, it is expected that more operation units would participate in the RPMA program in the future.
Contrast to production efficiency estimation used inputs and out data, this paper emphasizes profit efficiency estimation used cost and revenue data, which is consistent with operation units consideration about profit objective.
O’Donnell, Battese and Rao (2008) suggested application of Metafrontier model to estimate profit efficiency of operation units with different scale, area and business culture.
Model specification
Assume the form of profit function of operation units is random translog. We can build a profit Metafrontier function as follow (Battese et al., 2004; O’Donnell et al., 2008):
Where πis operation unit’s standardized profit deflated by milled rice sale price, W1 , W2 and W3 are standardized paddy rice purchase price, process cost and salary, respectively. βare parameters. Error term consists of random error (vit(j)) and profit inefficiency (uit(j)), the former assumed to be normal distribution and the latter is actual profit for the i operation unit in t year which might deviate from optimal profit in the group j; i.e, it means profit inefficiency. It is assumed that vit(j) is independent of uit(j).
We will estimate profit efficiency step by step. Firstly, application of Stochastic Frontier Analysis (SFA) and Maximum Likelihood Estimation (MLE) to estimate profit efficiency of the i operation unit in group j. Secondly, constitute random profit function of each group as follow:
Where i=1,2,… Nj, t=1,2,…T, and j=1,2, …K represent different operation unit, time and group, respectively.
The purposes of random profit function are to estimate profit efficiency of the RPMA or not and its profit efficiency ratio. Thirdly, we then judge estimated profit efficiency difference by Likelihood ratio. If reject null hypothesis, it means there is different profit efficiency in participation of the RPMA program or not. Finally, application of GAUSS software suggested by Battese et al. (2004) incorporate estimated parameters of each group into linear programming (LP) and quadratic programming (QP) to estimate optimal parameter of profit Metafrontier as follow:
Where πit is profit on Metafrontier. It represents potential profit for operation unit with opitimal resource allocation and as a basis for Metaprofit efficiency and Metaprofit ratio calculation.
Empirical results
Profit efficiency
Estimated parameters of operation units in the PRAM, non-PRAM and total are shown in appendix table A1. There are 8-9 estimated parameters are 10% significant, and 1% significant by likelihood ratio testing on total operation units. It means that there is significant difference among operation units. Therefore, it is inappropriate estimation by random profit function and should apply profit meta-frontier model for profit efficiency analysis.
We used LP and QP to estimate parameters in the profit meta-frontier model. Since both results are similarity, hereafter, we will only show empirical results by LP estimation.
Because of operation units purchased paddy rice mostly/partially from contract production under the RPMA program, we can divide them into RPMA and non-RPMA with different production and marketing mode. It is assumed both modes have different profit performance and group profit efficiency frontier. Then, there is a frontier that is an envelope in both groups’ profit efficiency frontiers. The Group Profit Efficiency (GPE) is ratio of operation unit’s actual profit to optimal profit on their group profit frontier. Table 5 shows that the GPE of operation unit in RPMA and non-RPMA is 0.9100 and 0.7242, respectively. In other words, operation unit used non-RPMA mode with lower profit efficiency. It should do something in both increasing price and lowering cost to shorten the distance to optimal profit.
Table 5. Total and group profit efficiency estimation and testing
Group
GPE
MPE
Testing
MPE/GPE
Testing
RPMA
0.9100
0.8065
RPMA>non-RPMA***
0.8863
RPMA>non-RPMA***
Non-RPMA
0.7242
0.5760
0.7954
Total
0.8148
0.6913
0.8484
Note:*, **, *** represent 10%、5%、1% significance.
Source: the author’s estimation.
Since belonging to different group frontier, both group’s GPE cannot directly make comparison. We consider Meta Profit Efficiency (MPE) which is able to incorporate all operation units together. MPE is ratio of operation unit’s actual profit to potential profit on profit meta-frontier. The MPE is 0.6913 which means there is 30.87% of profit inefficiency to be improved. On the other hand, the MPE of operation unit in RPMA and non-RPMA is 0.8065 and 0.5760, respectively. Based on non-parametric Mann-Whitney testing, MPE in RPMA is significantly higher than in non-RPMA. Although contract price and processing cost are higher in RPMA than in non-RPMA, sale price is much higher in RPMA than in non-RPMA. The key factor is how to increase rice value-added. It could be a core strategy for developing the RPMA program in the future.
The MPE/GPE ratio also estimated for operation unit in RPMA and non-RPMA is 0.8863 and 0.7954, respectively. It indicates that Farmers’ Association and grain merchant both participating in the RPMA program could significantly improve their profit performance.
Determinants of profit efficiency
For exploring determinants of profit efficiency, it is supposed to be relevant to number of rice species, brands, channels, and channel types. We specified Tobit regression equation as follow:
Where yit is a vector of GPE, MPE and GPE/MPE of i operation unit in t year, xit is vector of rice species, brands, channels, and channel types, respectively. αk are coefficients of relevant variables. is error disturbance.
Regression results are shown in Table 6. We learned that variety of rice species, brand concentration and home delivery would enhance GPE of operation unit in the RPMA and non-RPMA program. In addition, variety of rice species and less brands of operation unit would improve its MPE and MPE/GPE. Those channels located in department stores, organic stores, and home delivery has better performance in terms of profit efficiency. We can conclude that the RPMA program not only emphasize business model innovation, but also has to consider rice species, focus branding and choice of channel type in order to achieve the core objective, profit maximization, of operation unit.
Table 6. Results of Tobin regression: determinants of GPE and MPE
GPE
MPE
MPE/GPE
RPMA
Non-RPMA
Constant
0.8614
***
0.7972
***
0.5361
***
0.6950
***
(0.1224)
(0.1910)
(0.1552)
(0.2401)
Rice species
0.0243
**
-0.0024
0.0612
*
0.0295
*
(0.0096)
(0.0393)
(0.0320)
(0.0160)
Brands
-0.0163
*
-0.0234
*
-0.0136
*
0.0339
(0.0092)
(0.0140)
(0.0072)
(0.0256)
Channels
0.0068
0.0253
*
0.0135
0.0256
*
(0.0055)
(0.0134)
(0.0105)
(0.0145)
E-commerce
0.0430
0.0488
0.1536
0.0531
(0.0337)
(0.0371)
(0.1053)
(0.0474)
Home delivery
0.0156
*
0.1177
0.1183
**
-0.0100
(0.0085)
(0.1071)
(0.0497)
(0.0361)
Department stores & organic stores
-0.0217
0.0909
*
0.0195
*
(0.0301)
(0.0493)
(0.0113)
Note: Number in parenthesis is standard error. Dummy variables for e-commerce, home delivery, department stores & organic stores, respectively. *, **, *** represent 10%、5%、1% significance.
Source: the author’s estimation.
CONCLUSIONS AND OUTLOOK
Rice industry is the most important industry in Taiwan’s agricultural sector. The government has been spending a lot by purchasing rice at guaranteed price, which causes financial burden, market mechanism distortion and resources misallocation. Under requirements of AMS reduction and competitiveness improvement, the government began implementing the Rice Production and Marketing Areas (RPMA) program in 2005. It rewarded operation units to make contact with rice farmers at a higher price than the government’s guaranteed price, and to run a business model by integrated value chain. The purposes of this study are to evaluate policy performance in terms of government expenditure and farmers’ income, and estimate profit efficiency of operation unit in the RPMA program.
The RPMA program has been in operations since 2005. It started with 27 operation units which included Farmers’ Associations and grain merchants and 4,908 hectares total, then increasing to 63 operation units with a total of 23,292 hectares total. Basically, the reward payment provided by the government is a key factor to attract Farmers’ Associations and grain merchants to participate in the RPMA program. The correlation coefficient is 0.86 between reward payment and participated hectares. Government could have a balance consideration on reward payment and purchasing expenditure saving to decide whether to increase the reward payment for participated hectares expansion or not.
Regarding the policy evaluation on the RPMA program, it has achieved the objectives of government’s purchasing paddy rice reduction. For example, we estimated reduction of government purchasing paddy rice at 46,584 MT and expenditure saving 1.1 billion in 2017. Government benefitted from a net expenditure saving of about 1 billion compared to 0.12 billion from reward payment. Besides, farmers’ income would be extra increased from contract price, which is higher than government guaranteed price by at least 0.1billin total. For instance, farmers’ income increased by 0.145 billion NTD total in 2017; in other words, each farmer’s income increased by 11,178 NTD average, or each hectare increased by 6,227 NTD average.
Participants of the RPMA program are government, farmers, operation units (i.e. Farmers’ Association and grain merchants). As analysis above, the program is beneficial to government’s expenditure saving and farmers’ income raising. However, the key factor is operation unit participation. If operation units would improve their efficiency and profit, it is expected that more operation units would participate in the RPMA program in the future.
We applied the Metafrontier model to estimate profit efficiency of operation units. Empirical results showed that the GPE of operation unit in RPMA and non-RPMA is 0.9100 and 0.7242, respectively. In other words, operation unit used non-RPMA mode with lower profit efficiency. It should do something in both increasing price and lowering cost to shorten the distance to optimal profit.
In addition, we consider Meta Profit Efficiency (MPE) which is able to incorporate all operation units together. MPE is ratio of operation unit’s actual profit to potential profit on profit meta-frontier. The MPE is 0.6913 which means there is 30.87% of profit inefficiency to be improved. On the other hand, the MPE of operation unit in RPMA and non-RPMA is 0.8065 and 0.5760, respectively. Based on non-parametric Mann-Whitney testing, MPE in RPMA is significantly higher than in non-RPMA. Although contract price and processing cost are higher in RPMA than in non-RPMA, sale price is much higher in RPMA than in non-RPMA. The key factor is how to increase rice value-added. It could be a core strategy for developing the RPMA program in the future.
This paper made regression on profit inefficiency, it showed that variety of rice species, brand concentration and home delivery would enhance GPE of operation unit in the RPMA and non-RPMA program. Those channels located in department stores, organic stores, and home delivery have better performance in terms of profit efficiency. We can conclude that the RPMA program not only emphasize business model innovation, but also has to consider rice species, focus branding and choice of channel type in order to achieve the core objective, profit maximization, of operation unit.
The RPMA program has been running for 14 years in Taiwan. Participation of grain merchants, farmers, and areas has constantly grown. However, participated area is only 8.5% of rice plant area. Since the program has effects of government purchasing paddy rice reduction, government expenditure saving and farmers’ income raise, government should actively encourage more grain merchants to participate in the program. Grain merchants will also improve its profit efficiency, build its own brand and have a better business performance after participating the program. We can say the RPMA program is a win-win-win program which is beneficial to government, farmers and grain merchants. Furthermore, products under the RPMA should be required by Taiwan Good Aquaculture Practice (TGPA), which ensures rice quality and safety. Actually, the RPMA program is also good for consumers.
From this year, the Taiwan government started implementing rice direct payment program, which is an alternative to government purchasing paddy at guaranteed price for farmers. This is if more rice farmers decide to take direct payment instead of selling to government at guaranteed price. The influence of government purchasing paddy at guaranteed price on purchased quantity and expenditure will decrease. We can expect that rice industry would move towards high quality and value-added development.
REFERENCES
Agriculture and Food Agency, Council of Agriculture (2017), Taiwan Food Statistics Book.
Battese, G. E., Rao, D. S. P. and O’Donnell, C. J.(2004), “A Metafrontier Production Function for Estimation of Technical Efficiencies and Technology Gaps for Firms Operating Under Different Technologies,” Journal of Productivity Analysis, 21(1), 91-103.
Chen, J. L. and M.H. Yang (2007), Study on Operation and Performance of Rice Production and Marketing Area, Project Report supported by the Agriculture and Food Agency, Council of Agriculture.
Eaton, E. and Shephered, A. W. (2001), “Contract Farming,” FAO Agricultural Services Bulletin, Rome.
O’Donnell, C. J., Battese, G. E. and Rao, D. S. P. (2008), “Metafrontier Frameworks for The Study of Firm-level Efficiencies and Technology Ratios,” Empirical Economics, 34(2), 231-255.
APPENDIX
Table A1. Estimation results of parameters and its standard error
Note: number in parenthesis is standard error, and *, **, *** represent 10%、5%、1% significance. Standard errors in LP and QP are estimated by Booth-strapping method.
Source: the author’s estimation.
(Submitted as a paper for the International Seminar on “Promoting Rice Farmers’ Market through value-adding Activities”, June 6-7, 2018, Kasetsart University, Thailand)