INTRODUCTION
The ASEAN stands for the Association of Southeast Asian Nations. It comprises ten countries that include Malaysia, Indonesia, Singapore, Philippines, Vietnam, Thailand, Brunei, Cambodia, Myanmar and Laos. This association was formed in 1967, mainly out of concern for political security in Southeast Asia. Currently, the political aspect is still relevant, but other dimensions of the organization and its activities, such as environment conservation and trade have increased their relative importance. During the early establishment of this association, ASEAN countries are competing with each other to export raw materials to the same industrialized markets and competing to attract foreign capital, technology transfer and management know-how. However, ASEAN started its economic co-operation in 1976 when the leaders of the member countries signed the trade declaration. Following this, is the ASEAN Free Trade Area (AFTA) which was signed in 1992, a trade bloc agreement aimed to support local manufacturing in ASEAN countries. The intra-ASEAN trade has increased tremendously after the declaration was signed. The tariff and non-tariff barriers to products produced in the member countries have been reduced gradually. This paper explores the impacts of trade liberalization between Malaysia and Singapore, Brunei and Vietnam, the other three ASEAN countries that participated in the Trans-Pacific Partnership (TPP). It aims to investigate commodities traded, the trend of trading by Singapore, Brunei and Vietnam; and the potential business should Malaysia would like to enhance its agriculture trade to these countries.
Agriculture trade in ASEAN
In general, all countries in ASEAN are well endowed with natural resources. Agriculture is one of the main sectors of the ASEAN economies. Almost all countries export agricultural produce within and outside ASEAN (Table 1).
Table 1. ASEAN Trade 2014-2015 (US$)
|
Country
|
2014
|
2015
|
Year-on-year change
|
|
Exports
|
Imports
|
Total trade
|
Exports
|
Imports
|
Total trade
|
Exports
|
Imports
|
Total trade
|
|
(US$ million)
|
(US$ million)
|
(in pecent)
|
|
Brunei Darussalam
|
10,584
|
3,597
|
14,181
|
6,354
|
3,238
|
9,592
|
(40.0)
|
(10.0)
|
(32.4)
|
|
Cambodia
|
10,681
|
18,973
|
29,655
|
8,839
|
10,838
|
19,676
|
(17.3)
|
(42.9)
|
(33.6)
|
|
Indonesia
|
176,293
|
178,179
|
354,471
|
150,366
|
142,695
|
293,061
|
(14.7)
|
(19.9)
|
(17.3)
|
|
Lao PDR
|
2,640
|
2,749
|
5,389
|
3,714
|
3,049
|
6,763
|
40.7
|
10.9
|
25.5
|
|
Malaysia
|
233,927
|
208,850
|
442,778
|
199,158
|
176,011
|
375,169
|
(14.9)
|
(15.7)
|
(15.3)
|
|
Myanmar
|
11,452
|
16,220
|
27,672
|
12,197
|
16,907
|
29,104
|
6.5
|
4.2
|
5.2
|
|
Philippines
|
61,810
|
67,757
|
129,567
|
58,648
|
70,295
|
128,944
|
(5.1)
|
3.7
|
(0.5)
|
|
Singapore
|
409,769
|
366,247
|
776,016
|
366,344
|
296,765
|
663,109
|
(10.6)
|
(19.0)
|
(14.5)
|
|
Thailand
|
227,574
|
227,952
|
455,526
|
214,396
|
202,751
|
417,147
|
(5.8)
|
(11.1)
|
(8.4)
|
|
Viet Nam
|
148,092
|
145,686
|
293,777
|
162,014
|
165,730
|
327,744
|
9.4
|
13.8
|
11.6
|
|
ASEAN
|
1,292,821
|
1,236,210
|
2,529,031
|
1,182,031
|
1,088,279
|
2,270,310
|
(8.6)
|
(12.0)
|
(10.2)
|
|
|
|
|
|
|
|
|
|
|
|
|
Source : ASEAN Secretariat
|
|
|
|
|
|
|
|
|
One of the important agricultural crops cultivated in ASEAN countries is rice. Most countries cultivate rice as their source of carbohydrate for its people. However, with the exception of Thailand and Vietnam, all other countries have traditionally been rice deficit in rice production. As a region, ASEAN is the net exporters of rice in the world markets. At the same time, the ASEAN countries are the main importers of rice. Besides rice, other sub-commodities under the agriculture sector are traded as well. These include meat and meat-based products, fish, crustaceans, mollusks including other aquatic invertebrates, edible vegetables, edible fruit and nuts, as well as live trees and other plants. In addition, processed food products are also traded in large quantities.
Trade with ASEAN cum TPP member countries
The TPP is a free trade agreement among 12 countries in the Asia Pacific region including Malaysia. The TPP aims to promote growth through a more liberalized trade environment between its member countries. Among the ASEAN countries, Malaysia, Singapore, Brunei and Vietnam are members of the TPP. In relation to the agriculture industry, TPP covers 21 areas of negotiations that include market access in goods, sanitary and phytosanitary (SPS), technical barriers to trade, rules of origin, customs cooperation, competition, e-commerce, trade remedies and capacity building (Rozhan, 2016). The market access in goods chapter deals with tariff elimination scheduled by TPP member countries, which would reduce the costs of trading in goods. Projections were made on the benefits that Malaysia will gain from the TPP. Among others, Malaysia's Gross Domestic Product (GDP) is projected to increase by US$107bil (RM444bil) to US$211bil (RM876bil) over 2018-2027, which would raise GDP growth between 0.6 and 1.15% in 2027. Investments were projected to rise by US$136bil (RM565bil) to US$239bil (RM993bil) over 2018-2027 - attributable largely to higher investment growth in textiles, construction and distributive trade. More than 90% of the economic gains will be attributable to lower non-tariff measures. Hike in export growth is projected to be outpaced by increase in import growth. Therefore trade surplus is projected to narrow between 4.3 and 5.2% of GDP in 2027 (PwC, 2015). Export-oriented firms will benefit from greater market access, especially with countries that Malaysia is yet to have a trade agreement, namely Peru, Mexico, Canada and the USA.
ASEAN remained an important and strategic trading partner for Malaysia, accounting for more than a quarter or 27.4% share of Malaysia’s global trade. It was boosted by growing trading activities, increased inter-company linkages, cross-border investments and outsourcing activities within the region. In 2015, total trade with the ASEAN was valued at US$54.02 billion (RM401.33 billion), an increase of 3.2% from 2014. Singapore is Malaysia’s largest trading partner in the ASEAN, with 47.5% share of total trade, followed by Thailand, Indonesia, and Vietnam (MATRADE, 2016).
Malaysia’s exports to the ASEAN in 2015 totaled RM219.29 billion, an increase of 2.8 % from RM213.40 billion in 2014. Exports to ASEAN accounted for 28.1 % of Malaysia’s total exports, making ASEAN Malaysia’s single largest regional export destination. The individual ASEAN economies of Singapore, Thailand and Indonesia, were ranked among Malaysia’s top ten export destinations and collectively account for 83.1 %of Malaysia’s total exports to the ASEAN.
Trade with Selected ASEAN cum TPP member countries
The four countries in the ASEAN that participated in the TPP agreement are Malaysia, Brunei, Singapore and Vietnam. This paper analyses the trade between Malaysia and the other three countries (Fig. 1).
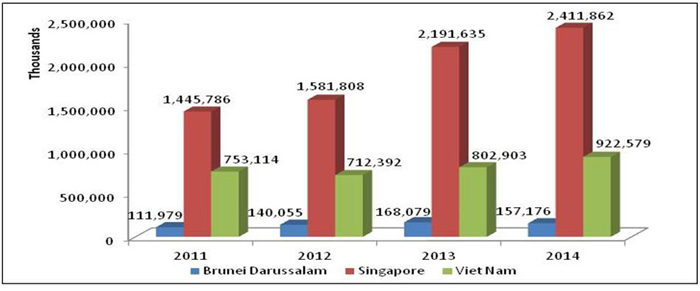
Fig. 1. Malaysia Exports to Vietnam, Singapore and Brunei (US$)
Source : UNCOMTRADE, 2016
The major export market of agricultural and agro-based products from Malaysia is Singapore. In 2014, its export value of agricultural products to Singapore amounted to US$2.4 billion, an increase from US$2.1 billion in 2013. The export value of agricultural products to Vietnam was US$922 million in 2014, slightly higher than in 2013. Meanwhile, exports to Brunei declined slightly from US$168 million in 2013 to US$157 million in 2014.
Malaysia and Singapore
Singapore's economy was rated to be among the ten most open, competitive and innovative in the world (World Economic Forum, 2016). Immigrants from various countries reside in Singapore and worked in various multinational sectors. Its strategic location in the South China Sea makes the country a vibrant regional hub port for trade, finance and logistics. Singapore provides a variety of aviation and port facilities which are complete and sophisticated, to serve as a transit for ships and commercial aircrafts.
Singapore adopts an open market but emphasizes very much on food security. In 2015, Singapore has a gross domestic product (GDP) per capita which was rated as the highest in the world, amounting to US$55.888/person (Trading Economics, 2016). The level of food consumption per capita was also recorded the highest in Asia with a budget of US$1.445 per year (2013). The high value of its currency gives its population high purchasing power, which enables them to shop luxuriously and imports almost 90% of food products to fulfill the needs of its population (AVA, 2015). Singapore's total consumer spending is expected to grow at an average rate of 3.4% per year between 2013 and 2020.
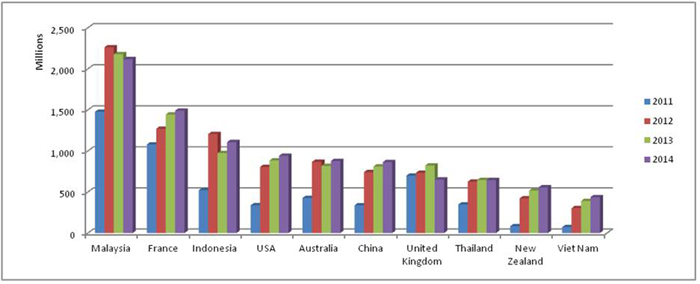
Fig. 2. Trade trends to Singapore (US$)
Source : UNCOMTRADE, 2016
Malaysia is Singapore's main source of agricultural products, and still dominates the market (Fig. 2). However, there was a slight decline in the rate of agriculture exports to Singapore in recent years. The need to strengthen Malaysia’s position by improving the quality and diversity of its goods is important, in order to maintain a strong market share in Singapore.
Singapore remains Malaysia’s largest trading partner in the ASEAN, garnering a 13.9% share of Malaysia’s total export in 2015 valued at US$ 25.09 billion. (MITI, 2016 ). The export value in 2015 has slightly decreased by 0.3% from US$ 25.15 billion in 2014. The weakening currency or “looming crisis” in late 2014 had depreciated ringgit into “significantly undervalued” and consequently, dropped the total export value (Alaa, 2015).
In 2014, the agriculture sector was classified as the third largest sector, amounting to 8.6% of total exports from Malaysia to Singapore (MITI, 2015). Data analysis indicated that Malaysia has been leading and has competitive advantage in some sub-commodities under the agriculture sector as depicted in Figure 3 to 6. These include HS 06- live trees, plants; bulb, roots; cutflowers and ornamental foliages, HS 08- edible fruit and nuts; citrus fruit or melon peel , HS 07- edible vegetables and certain roots and tubers and HS 16- edible preparations of meat, fish, crustaceans, mollusks or other aquatic invertebrate.
Export of live trees, plants, bulb, roots, cut flowers and ornamental foliages were traded in large amounts to Singapore in 2014 (Fig. 3). The trend shows that Malaysia has a competitive advantage for export under the HS 06 chapter. This code involves a few subheadings and Malaysia leads in two categories of HS 060290 (live plant including roots, cutting and slip) , and HS 060390 (, flower bulb, dried and preserved). Singapore is very strict on the issue of SPS requirements, especially for live plants. Thus, the requirement to fulfill the phytosanitary certificate is a must for exporters. Agri-Food and Veterinary Authority (AVA) is the national authority that ensures food safety and security in Singapore, whereby exporters will have to follow the procedure set by the AVA.
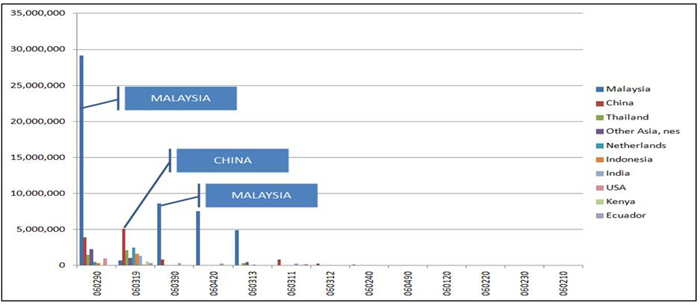
Fig. 3. Top commodities exported to Singapore, 2014 (US$)- (HS 06-Live Trees, Other Plants; Bulb, Roots; Cut Flowers and Ornamental Foliages)
Source : UNCOMTRADE, 2016
Malaysia is known as the major exporter of fresh agriculture produce to Singapore. These include vegetables, tropical fruits, fish, seafood and meat preparations as depicted in Fig. 4, Fig. 5 and Fig. 6. For vegetable and fruit products, Malaysia enjoys preferential treatment in the form of exemption from the need to submit a Phyto-certificate. A packing list is sufficient with every consignment. Having this advantage of trust, Malaysia should keep and maintain its reputation as the major contributor of fresh fruits and vegetables to Singapore. However, the MRL (minimum residue level) issue is the main hurdle faced by exporters thus needs to be overcome.
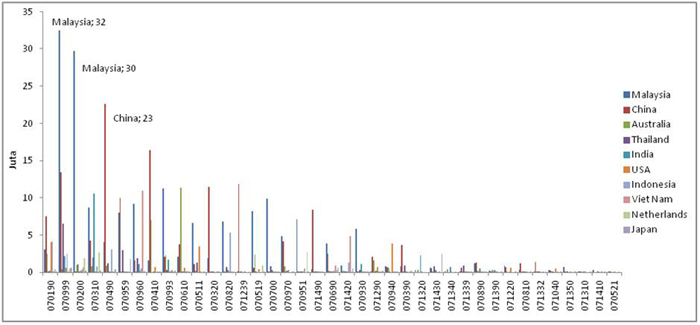
Fig. 4. Top commodities exported to Singapore, 2014 (US$)- (HS 07-Edible Vegetables, Certain Roots and Tubers)
Source : UNCOMTRADE, 2016
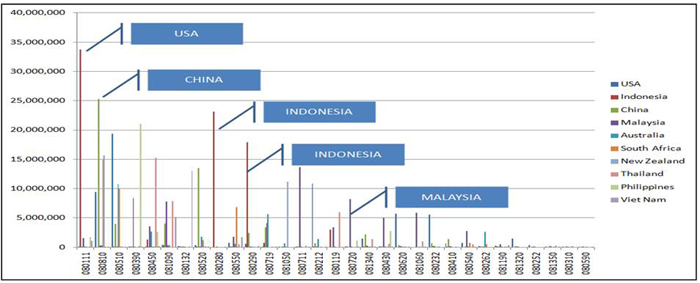
Fig. 5. Top commodities exported to Singapore, 2014 (US$) - (HS 08-Edible Fruit & Nuts; Citrus Fruit or Melon Peel)
Source : UNCOMTRADE, 2016
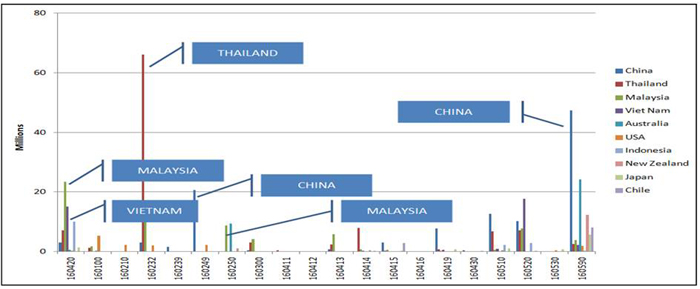
Fig. 6. Top commodities exported to Singapore, 2014 (US$)- (HS 16-Preparations of Meat, Fish, Crustaceans, Mollusks or other Aquatic Invertebrate)
Source : UNCOMTRADE, 2016
Malaysia and Brunei
Brunei is located on the north coast of the island of Borneo in Southeast Asia. Apart from its coastline with the South China Sea, the country is completely surrounded by the Malaysian state of Sarawak. Brunei has a population density of 423,000 inhabitants. The main city of Brunei is Bandar Seri Begawan with a population of 14,000 people. Per capita GDP for Brunei is relatively stable despite a decline in the last 15 years, but slightly increased at an average rate of US$40, 979.6 for the last five years (2011-2015). The annual growth rate of Brunei's GDP for 2014 is -2.3% (World Bank).
Trade trend showed Brunei's export rate for 2013 was US$ 11,447 million with an import value of US$ 3,612.4 million. The Brunei trade balance showed a surplus of US 7,834.8 million. Brunei's largest export trading partners for 2014 are Japan (39.8%), Korea (16.3%) and India (7.5%). On the other hand, the largest import trading partners for Brunei are Malaysia (21.9%), Singapore (19.1%), and the United States (11.9%). In terms of production of fresh products, especially fruits and vegetables, 10% of its supply is locally sourced, whilst 90% is dependent on imports. Most of its fresh produce are certified with Brunei’s Good Agriculture Practice (BruneiGAP). The Ministry of Industry and Primary Resources of Brunei has introduced the BruneiGAP logo as a symbol and guarantee that Brunei's produce is in compliance with national and ASEAN standards. It is one way of ensuring the quality and safety of its fruits and vegetable products.
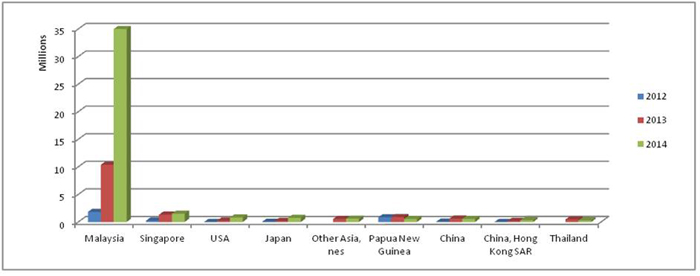
Fig. 7. Trade trends to Brunei (US$)
Source : UNCOMTRADE, 2016
Malaysia is a major source for Brunei’s agricultural products. There has been a high increase in exports in 2014 (Fig. 7). Malaysia may strengthen and sustain its position by improving the quality of its products or the diversity of its product lines exported to Brunei. Interestingly, while most of Brunei’s fresh and processed meat products are from India, pork meat is largely sourced from Malaysia (Fig. 8). Most plants and floriculture products are also imported from Malaysia such as foliages, branches and ornamental plants, cut flowers, cuttings and slips, and other types of floriculture products suitable for decorative or landscaping purposes (Fig. 9). Similarly with Singapore, Malaysia is also known as the major exporter of fresh agriculture produce to Brunei. These include vegetables, tropical fruits, fish, seafood and meat preparations as depicted in Fig. 10, Fig. 11 and Fig. 12. In addition, the trend shows that Malaysia has a competitive advantage for export share to Brunei under the following chapters; HS 17 (Sugars and sugar confectionery), HS 18 (Cocoa and cocoa preparations), HS 19 (Preparations of cereal, flour, milk and pastry products).
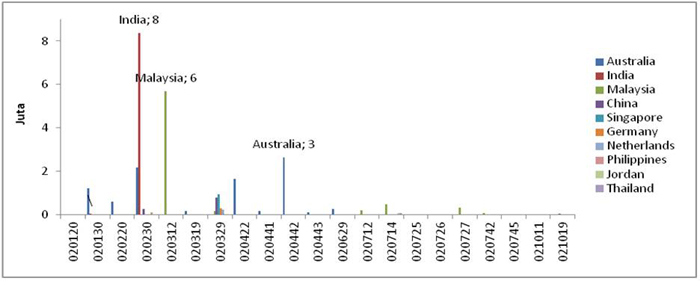
Fig. 8. Top commodities exported to Brunei, 2014 (US$)- (HS 02–Meat and edible meat offal)
Source : UNCOMTRADE, 2016
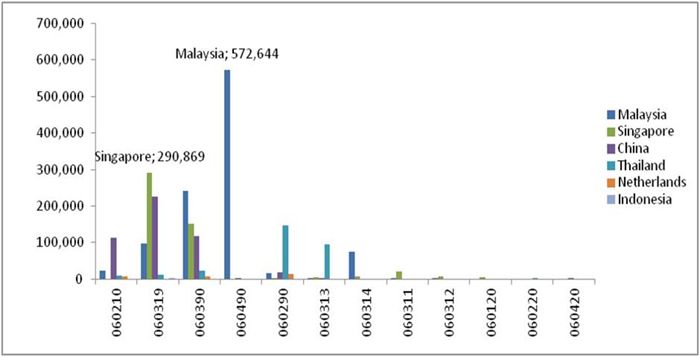
Fig. 9. Top commodities exported to Brunei, 2014 (US$)- (HS 06-Live Trees, Other Plants; Bulb, Roots; Cut Flowers and Ornamental Foliages)
Source : UNCOMTRADE, 2016
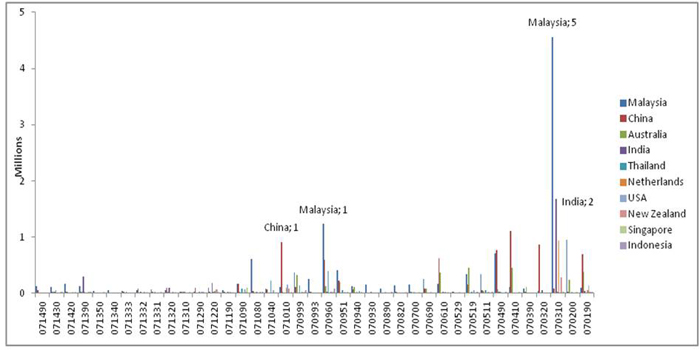
Fig. 10. Top commodities exported to Brunei, 2014 (US$)- (HS 07-Edible Vegetables, Certain Roots and Tubers)
Source : UNCOMTRADE, 2016
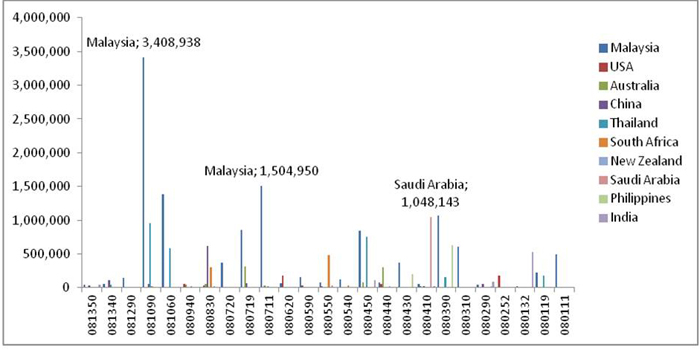
Fig. 11. Top commodities exported to Brunei, 2014 (US$) - (HS 08-Edible Fruit & Nuts; Citrus Fruit or Melon Peel)
Source : UNCOMTRADE, 2016
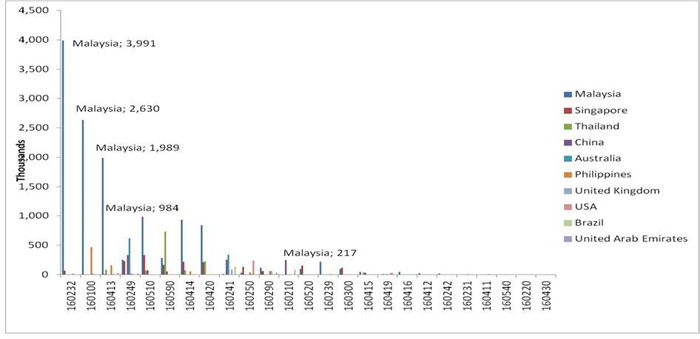
Fig. 12. Top commodities exported to Brunei, 2014 (US$) - (HS 16-Preparations of Meat, Fish, Crustaceans, Mollusks or other Aquatic Invertebrate)
Source : UNCOMTRADE, 2016
Malaysia and Vietnam
The Vietnam economy has grown rapidly within the past 25 years after its economic transformation towards liberalization. Vietnam joined the World Trade Organization (WTO) and began to engage in trade agreements with other countries. Nearly two-thirds of Vietnamese residents are involved in agricultural activities. Various crops are cultivated including rice, rubber, beans, coffee and tea. Rice is a major crop in Vietnam and is rapidly becoming the largest rice producer and exporter in the world after Thailand. Vietnam has advantages in food security and export advantage due to its low labor costs, increased foreign investment and low food prices.
Malaysia is listed among the countries that are given flexibility in the approval of bilateral agreements due to AFTA which helped a lot in terms of import duties, to make Malaysian products more competitive than products from other countries. AFTA and the ASEAN Economic Community (AEC) have much lower barriers to trade and facilitate Malaysian companies to enter the Vietnam market, thus giving advantage to Malaysian food entrepreneurs and exporters. Furthermore, Malaysia will enjoy the benefit through TPP because of the tariffs that will be reduced or abolished, and thus the demand for Malaysian products in Vietnam’s domestic market will inevitably increase (Mohd Zaffrie et al., 2017).
Most of the tariffs imposed on agricultural exports will be eliminated under the TPP. Vietnam will eliminate tariffs immediately on 28.5% of trade in agricultural products once TPPA is implemented, whereby the balance of up to 99.1% will be reduced within 15 years. Export taxes are prohibited under the TPPA. Vietnam imposed export taxes on some of their agricultural goods, therefore once the TPP enters into force, all the export taxes should be abolished within the agreed time period.
Malaysia was ranked number seven in 2014, after the United States, Argentina, Brazil, Australia, China and India for the importation of agricultural products in Vietnam (Fig. 13). There has been a significant increase in exports from major countries, from 2011 to 2014. This suggests that there is potential for agriculture and agro-based products from Malaysia to further penetrate the market in Vietnam.
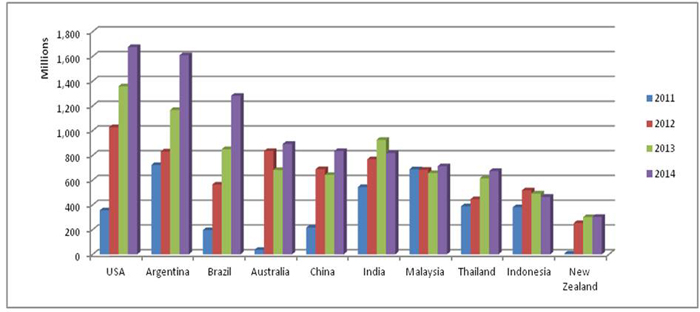
Fig. 13. Trade trends to Vietnam (US$)
Source : UNCOMTRADE, 2016
Based on secondary data and observations conducted in the Vietnam market, most of the processed food using meat, fish and marine products are imported from Thailand and Malaysia (Fig. 14). Cocoa and cocoa confectionery is also another sector whereby Malaysia marks its presence in Vietnam market (Fig. 15). Malaysia is the main source of imports for most cocoa products and cocoa confectionery such as cocoa powder, chocolates and other cocoa-based confectionery.
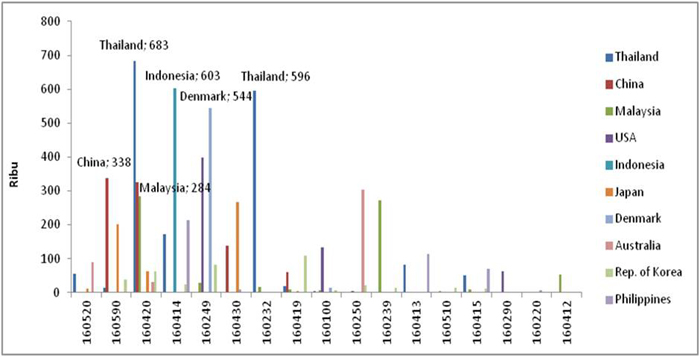
Fig. 14. Top commodities exported to Vietnam, 2014 (US$) - (HS 16-Preparations of Meat, Fish, Crustaceans, Mollusks or other Aquatic Invertebrate)
Source : UNCOMTRADE, 2016
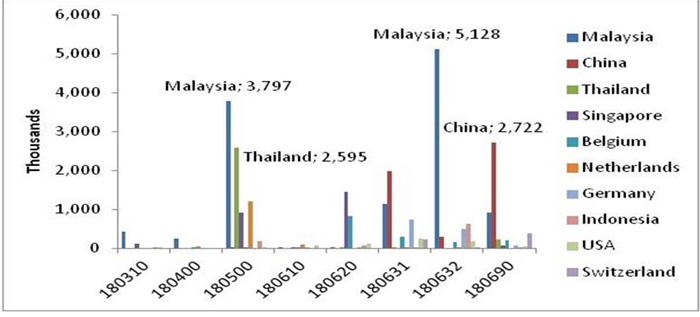
Fig. 15. Top commodities exported to Vietnam, 2014 (US$)- (HS 18-Cocoa and cocoa preparations)
Source : UNCOMTRADE, 2016
CONCLUSION
Malaysia, having a population of only slightly more than 30 million, is considered a small domestic market and needs to expand to new markets to spur exports and seek new investments. The aim is for Malaysia to find ways to leverage on its existing economic relationship and trade agreements such as AFTA and the TPP, to further impel its trade in agricultural goods and agro-based products.
Questions were often raised on how trade liberalization via trade agreements may boost trade with existing markets like Singapore, Brunei and Vietnam. The ratification of the TPP agreement not only provides a transparent trading environment but also opportunities to widen market access and benefit from reduction of trading costs due to tariff elimination. Even more so, is the reduction in non-tariff barriers. Strategies need to be identified for Malaysia to strengthen the presence of its existing products, as well as new products to be developed following market needs. It is important to note though, that bilateral or multilateral trade agreements also opens up similar opportunities to other member countries. This may intensify competition. Therefore, the agriculture industry players which include exporters, traders and entrepreneurs should be ready to increase its efforts to maximize the preferential treatment received to boost the competitiveness of agriculture and agro-based products in the global market.
REFERENCES
Alaa. S. (2015). Zeti Syas Ringgit Significantly Undervalued Amid Growth. Retrieved 11 November 2017, from http://www.bloomberg.com/news/articles/2015-11-11/zeti-says-ringgit-significantly-undervalued-amid-economic-growth
AVA. (2015). The Food We Eat. Singapore’s Food Supply. Retrieved on 11 June 2017 from http://www.ava.gov.sg/explore-by-sections/food/singapore-food-supply/the-food-we-eat
Christine. M., and Erica. M. (1994), A Framework for Utilizing Marketing Expertise in Strategy Design
Index Mundi (2016). Singapore Demographics Profile 2016. Retrieved on 8 June 2016 from http://www.indexmundi.com/singapore/demographics_profilehtml
MATRADE (2016). Retrieved on 10 Nov 2017 from http://www.matrade.gov.my/en/malaysia-exporters- section/253-asean/4669-malaysias-trade-with-asean
MITI (2016) . MITI Report 2015. Malaysia : Sasyaz Holdings Sdn. Bhd.
Mohd Zaffrie, M. A., Mohd Hafizudin, Z. And Nik Rozana, N.M.M (2017). The Potential of Malaysian Fresh Agriculture Products in Vietnam Market. Retrieved 28 March 2017 from http://ap.fftc.agnet.org/ap_db.php?id=760
PwC. (2015). Study on Potential Economic Impact of TPPA on the Malaysian Economy and Selected Key Economic Sectors. Retrieved on 15 Nov 2017 from http://fta.miti.gov.my/miti-fta/resources/TPPA_PwC_CBA_- Final_Report_021215_FINAL_(corrected).pdf on.
Rozhan. A.D. (2016). Potential Benefits of TPPA on Malaysia’s Agrofood Sector. FFTC Agricultural Policy Platform (FFTC-AP). Retrieved on 10 November 2017 from http://ap.fftc.agnet.org/ap_db.php?id=670
Singapore Expats (2016). About Singapore. Retrieved on 8 June 2017 from http://www.singaporeexpats.com/about-singapore/about-singapore.htm
Tom. O. (2015). Coca-cola: Ansoff matrix, The Marketing Report. Retrieved on 10 November 2016 from https://themarketingagenda.com/2015/03/28/coca-cola-ansoff-matrix/
Trading Economics. (2016). Singapore GDP. Retrieved on 10 June 2017 from http://www.tradingeconomics.com/singapore/gdp
United Nations. (2016). UN Comtrade database.
World Customs Organization (WCO). (2016). What is the Harmonized System (HS). Retrived on 9 November 2016 from http://www.wcoomd.org/en/topics/nomenclature/overview/what-is-the-harmonized-system.aspx
World Economic Forum. (2016). Global Competitiveness Report 2014-2015. Retrieved on 10 June 2017 from http://reports.weforum.org/global-competitiveness-report-2014- 2015/top-10/
|
Date submitted: April 9, 2018
Reviewed, edited and uploaded: April 26, 2018
|

Overview of Agro-Food Trade Between Malaysia and Selected Asean Countries
INTRODUCTION
The ASEAN stands for the Association of Southeast Asian Nations. It comprises ten countries that include Malaysia, Indonesia, Singapore, Philippines, Vietnam, Thailand, Brunei, Cambodia, Myanmar and Laos. This association was formed in 1967, mainly out of concern for political security in Southeast Asia. Currently, the political aspect is still relevant, but other dimensions of the organization and its activities, such as environment conservation and trade have increased their relative importance. During the early establishment of this association, ASEAN countries are competing with each other to export raw materials to the same industrialized markets and competing to attract foreign capital, technology transfer and management know-how. However, ASEAN started its economic co-operation in 1976 when the leaders of the member countries signed the trade declaration. Following this, is the ASEAN Free Trade Area (AFTA) which was signed in 1992, a trade bloc agreement aimed to support local manufacturing in ASEAN countries. The intra-ASEAN trade has increased tremendously after the declaration was signed. The tariff and non-tariff barriers to products produced in the member countries have been reduced gradually. This paper explores the impacts of trade liberalization between Malaysia and Singapore, Brunei and Vietnam, the other three ASEAN countries that participated in the Trans-Pacific Partnership (TPP). It aims to investigate commodities traded, the trend of trading by Singapore, Brunei and Vietnam; and the potential business should Malaysia would like to enhance its agriculture trade to these countries.
Agriculture trade in ASEAN
In general, all countries in ASEAN are well endowed with natural resources. Agriculture is one of the main sectors of the ASEAN economies. Almost all countries export agricultural produce within and outside ASEAN (Table 1).
Table 1. ASEAN Trade 2014-2015 (US$)
Country
2014
2015
Year-on-year change
Exports
Imports
Total trade
Exports
Imports
Total trade
Exports
Imports
Total trade
(US$ million)
(US$ million)
(in pecent)
Brunei Darussalam
10,584
3,597
14,181
6,354
3,238
9,592
(40.0)
(10.0)
(32.4)
Cambodia
10,681
18,973
29,655
8,839
10,838
19,676
(17.3)
(42.9)
(33.6)
Indonesia
176,293
178,179
354,471
150,366
142,695
293,061
(14.7)
(19.9)
(17.3)
Lao PDR
2,640
2,749
5,389
3,714
3,049
6,763
40.7
10.9
25.5
Malaysia
233,927
208,850
442,778
199,158
176,011
375,169
(14.9)
(15.7)
(15.3)
Myanmar
11,452
16,220
27,672
12,197
16,907
29,104
6.5
4.2
5.2
Philippines
61,810
67,757
129,567
58,648
70,295
128,944
(5.1)
3.7
(0.5)
Singapore
409,769
366,247
776,016
366,344
296,765
663,109
(10.6)
(19.0)
(14.5)
Thailand
227,574
227,952
455,526
214,396
202,751
417,147
(5.8)
(11.1)
(8.4)
Viet Nam
148,092
145,686
293,777
162,014
165,730
327,744
9.4
13.8
11.6
ASEAN
1,292,821
1,236,210
2,529,031
1,182,031
1,088,279
2,270,310
(8.6)
(12.0)
(10.2)
Source : ASEAN Secretariat
One of the important agricultural crops cultivated in ASEAN countries is rice. Most countries cultivate rice as their source of carbohydrate for its people. However, with the exception of Thailand and Vietnam, all other countries have traditionally been rice deficit in rice production. As a region, ASEAN is the net exporters of rice in the world markets. At the same time, the ASEAN countries are the main importers of rice. Besides rice, other sub-commodities under the agriculture sector are traded as well. These include meat and meat-based products, fish, crustaceans, mollusks including other aquatic invertebrates, edible vegetables, edible fruit and nuts, as well as live trees and other plants. In addition, processed food products are also traded in large quantities.
Trade with ASEAN cum TPP member countries
The TPP is a free trade agreement among 12 countries in the Asia Pacific region including Malaysia. The TPP aims to promote growth through a more liberalized trade environment between its member countries. Among the ASEAN countries, Malaysia, Singapore, Brunei and Vietnam are members of the TPP. In relation to the agriculture industry, TPP covers 21 areas of negotiations that include market access in goods, sanitary and phytosanitary (SPS), technical barriers to trade, rules of origin, customs cooperation, competition, e-commerce, trade remedies and capacity building (Rozhan, 2016). The market access in goods chapter deals with tariff elimination scheduled by TPP member countries, which would reduce the costs of trading in goods. Projections were made on the benefits that Malaysia will gain from the TPP. Among others, Malaysia's Gross Domestic Product (GDP) is projected to increase by US$107bil (RM444bil) to US$211bil (RM876bil) over 2018-2027, which would raise GDP growth between 0.6 and 1.15% in 2027. Investments were projected to rise by US$136bil (RM565bil) to US$239bil (RM993bil) over 2018-2027 - attributable largely to higher investment growth in textiles, construction and distributive trade. More than 90% of the economic gains will be attributable to lower non-tariff measures. Hike in export growth is projected to be outpaced by increase in import growth. Therefore trade surplus is projected to narrow between 4.3 and 5.2% of GDP in 2027 (PwC, 2015). Export-oriented firms will benefit from greater market access, especially with countries that Malaysia is yet to have a trade agreement, namely Peru, Mexico, Canada and the USA.
ASEAN remained an important and strategic trading partner for Malaysia, accounting for more than a quarter or 27.4% share of Malaysia’s global trade. It was boosted by growing trading activities, increased inter-company linkages, cross-border investments and outsourcing activities within the region. In 2015, total trade with the ASEAN was valued at US$54.02 billion (RM401.33 billion), an increase of 3.2% from 2014. Singapore is Malaysia’s largest trading partner in the ASEAN, with 47.5% share of total trade, followed by Thailand, Indonesia, and Vietnam (MATRADE, 2016).
Malaysia’s exports to the ASEAN in 2015 totaled RM219.29 billion, an increase of 2.8 % from RM213.40 billion in 2014. Exports to ASEAN accounted for 28.1 % of Malaysia’s total exports, making ASEAN Malaysia’s single largest regional export destination. The individual ASEAN economies of Singapore, Thailand and Indonesia, were ranked among Malaysia’s top ten export destinations and collectively account for 83.1 %of Malaysia’s total exports to the ASEAN.
Trade with Selected ASEAN cum TPP member countries
The four countries in the ASEAN that participated in the TPP agreement are Malaysia, Brunei, Singapore and Vietnam. This paper analyses the trade between Malaysia and the other three countries (Fig. 1).
Fig. 1. Malaysia Exports to Vietnam, Singapore and Brunei (US$)
Source : UNCOMTRADE, 2016
The major export market of agricultural and agro-based products from Malaysia is Singapore. In 2014, its export value of agricultural products to Singapore amounted to US$2.4 billion, an increase from US$2.1 billion in 2013. The export value of agricultural products to Vietnam was US$922 million in 2014, slightly higher than in 2013. Meanwhile, exports to Brunei declined slightly from US$168 million in 2013 to US$157 million in 2014.
Malaysia and Singapore
Singapore's economy was rated to be among the ten most open, competitive and innovative in the world (World Economic Forum, 2016). Immigrants from various countries reside in Singapore and worked in various multinational sectors. Its strategic location in the South China Sea makes the country a vibrant regional hub port for trade, finance and logistics. Singapore provides a variety of aviation and port facilities which are complete and sophisticated, to serve as a transit for ships and commercial aircrafts.
Singapore adopts an open market but emphasizes very much on food security. In 2015, Singapore has a gross domestic product (GDP) per capita which was rated as the highest in the world, amounting to US$55.888/person (Trading Economics, 2016). The level of food consumption per capita was also recorded the highest in Asia with a budget of US$1.445 per year (2013). The high value of its currency gives its population high purchasing power, which enables them to shop luxuriously and imports almost 90% of food products to fulfill the needs of its population (AVA, 2015). Singapore's total consumer spending is expected to grow at an average rate of 3.4% per year between 2013 and 2020.
Fig. 2. Trade trends to Singapore (US$)
Source : UNCOMTRADE, 2016
Malaysia is Singapore's main source of agricultural products, and still dominates the market (Fig. 2). However, there was a slight decline in the rate of agriculture exports to Singapore in recent years. The need to strengthen Malaysia’s position by improving the quality and diversity of its goods is important, in order to maintain a strong market share in Singapore.
Singapore remains Malaysia’s largest trading partner in the ASEAN, garnering a 13.9% share of Malaysia’s total export in 2015 valued at US$ 25.09 billion. (MITI, 2016 ). The export value in 2015 has slightly decreased by 0.3% from US$ 25.15 billion in 2014. The weakening currency or “looming crisis” in late 2014 had depreciated ringgit into “significantly undervalued” and consequently, dropped the total export value (Alaa, 2015).
In 2014, the agriculture sector was classified as the third largest sector, amounting to 8.6% of total exports from Malaysia to Singapore (MITI, 2015). Data analysis indicated that Malaysia has been leading and has competitive advantage in some sub-commodities under the agriculture sector as depicted in Figure 3 to 6. These include HS 06- live trees, plants; bulb, roots; cutflowers and ornamental foliages, HS 08- edible fruit and nuts; citrus fruit or melon peel , HS 07- edible vegetables and certain roots and tubers and HS 16- edible preparations of meat, fish, crustaceans, mollusks or other aquatic invertebrate.
Export of live trees, plants, bulb, roots, cut flowers and ornamental foliages were traded in large amounts to Singapore in 2014 (Fig. 3). The trend shows that Malaysia has a competitive advantage for export under the HS 06 chapter. This code involves a few subheadings and Malaysia leads in two categories of HS 060290 (live plant including roots, cutting and slip) , and HS 060390 (, flower bulb, dried and preserved). Singapore is very strict on the issue of SPS requirements, especially for live plants. Thus, the requirement to fulfill the phytosanitary certificate is a must for exporters. Agri-Food and Veterinary Authority (AVA) is the national authority that ensures food safety and security in Singapore, whereby exporters will have to follow the procedure set by the AVA.
Fig. 3. Top commodities exported to Singapore, 2014 (US$)- (HS 06-Live Trees, Other Plants; Bulb, Roots; Cut Flowers and Ornamental Foliages)
Source : UNCOMTRADE, 2016
Malaysia is known as the major exporter of fresh agriculture produce to Singapore. These include vegetables, tropical fruits, fish, seafood and meat preparations as depicted in Fig. 4, Fig. 5 and Fig. 6. For vegetable and fruit products, Malaysia enjoys preferential treatment in the form of exemption from the need to submit a Phyto-certificate. A packing list is sufficient with every consignment. Having this advantage of trust, Malaysia should keep and maintain its reputation as the major contributor of fresh fruits and vegetables to Singapore. However, the MRL (minimum residue level) issue is the main hurdle faced by exporters thus needs to be overcome.
Fig. 4. Top commodities exported to Singapore, 2014 (US$)- (HS 07-Edible Vegetables, Certain Roots and Tubers)
Source : UNCOMTRADE, 2016
Fig. 5. Top commodities exported to Singapore, 2014 (US$) - (HS 08-Edible Fruit & Nuts; Citrus Fruit or Melon Peel)
Source : UNCOMTRADE, 2016
Fig. 6. Top commodities exported to Singapore, 2014 (US$)- (HS 16-Preparations of Meat, Fish, Crustaceans, Mollusks or other Aquatic Invertebrate)
Source : UNCOMTRADE, 2016
Malaysia and Brunei
Brunei is located on the north coast of the island of Borneo in Southeast Asia. Apart from its coastline with the South China Sea, the country is completely surrounded by the Malaysian state of Sarawak. Brunei has a population density of 423,000 inhabitants. The main city of Brunei is Bandar Seri Begawan with a population of 14,000 people. Per capita GDP for Brunei is relatively stable despite a decline in the last 15 years, but slightly increased at an average rate of US$40, 979.6 for the last five years (2011-2015). The annual growth rate of Brunei's GDP for 2014 is -2.3% (World Bank).
Trade trend showed Brunei's export rate for 2013 was US$ 11,447 million with an import value of US$ 3,612.4 million. The Brunei trade balance showed a surplus of US 7,834.8 million. Brunei's largest export trading partners for 2014 are Japan (39.8%), Korea (16.3%) and India (7.5%). On the other hand, the largest import trading partners for Brunei are Malaysia (21.9%), Singapore (19.1%), and the United States (11.9%). In terms of production of fresh products, especially fruits and vegetables, 10% of its supply is locally sourced, whilst 90% is dependent on imports. Most of its fresh produce are certified with Brunei’s Good Agriculture Practice (BruneiGAP). The Ministry of Industry and Primary Resources of Brunei has introduced the BruneiGAP logo as a symbol and guarantee that Brunei's produce is in compliance with national and ASEAN standards. It is one way of ensuring the quality and safety of its fruits and vegetable products.
Fig. 7. Trade trends to Brunei (US$)
Source : UNCOMTRADE, 2016
Malaysia is a major source for Brunei’s agricultural products. There has been a high increase in exports in 2014 (Fig. 7). Malaysia may strengthen and sustain its position by improving the quality of its products or the diversity of its product lines exported to Brunei. Interestingly, while most of Brunei’s fresh and processed meat products are from India, pork meat is largely sourced from Malaysia (Fig. 8). Most plants and floriculture products are also imported from Malaysia such as foliages, branches and ornamental plants, cut flowers, cuttings and slips, and other types of floriculture products suitable for decorative or landscaping purposes (Fig. 9). Similarly with Singapore, Malaysia is also known as the major exporter of fresh agriculture produce to Brunei. These include vegetables, tropical fruits, fish, seafood and meat preparations as depicted in Fig. 10, Fig. 11 and Fig. 12. In addition, the trend shows that Malaysia has a competitive advantage for export share to Brunei under the following chapters; HS 17 (Sugars and sugar confectionery), HS 18 (Cocoa and cocoa preparations), HS 19 (Preparations of cereal, flour, milk and pastry products).
Fig. 8. Top commodities exported to Brunei, 2014 (US$)- (HS 02–Meat and edible meat offal)
Source : UNCOMTRADE, 2016
Fig. 9. Top commodities exported to Brunei, 2014 (US$)- (HS 06-Live Trees, Other Plants; Bulb, Roots; Cut Flowers and Ornamental Foliages)
Source : UNCOMTRADE, 2016
Fig. 10. Top commodities exported to Brunei, 2014 (US$)- (HS 07-Edible Vegetables, Certain Roots and Tubers)
Source : UNCOMTRADE, 2016
Fig. 11. Top commodities exported to Brunei, 2014 (US$) - (HS 08-Edible Fruit & Nuts; Citrus Fruit or Melon Peel)
Source : UNCOMTRADE, 2016
Fig. 12. Top commodities exported to Brunei, 2014 (US$) - (HS 16-Preparations of Meat, Fish, Crustaceans, Mollusks or other Aquatic Invertebrate)
Source : UNCOMTRADE, 2016
Malaysia and Vietnam
The Vietnam economy has grown rapidly within the past 25 years after its economic transformation towards liberalization. Vietnam joined the World Trade Organization (WTO) and began to engage in trade agreements with other countries. Nearly two-thirds of Vietnamese residents are involved in agricultural activities. Various crops are cultivated including rice, rubber, beans, coffee and tea. Rice is a major crop in Vietnam and is rapidly becoming the largest rice producer and exporter in the world after Thailand. Vietnam has advantages in food security and export advantage due to its low labor costs, increased foreign investment and low food prices.
Malaysia is listed among the countries that are given flexibility in the approval of bilateral agreements due to AFTA which helped a lot in terms of import duties, to make Malaysian products more competitive than products from other countries. AFTA and the ASEAN Economic Community (AEC) have much lower barriers to trade and facilitate Malaysian companies to enter the Vietnam market, thus giving advantage to Malaysian food entrepreneurs and exporters. Furthermore, Malaysia will enjoy the benefit through TPP because of the tariffs that will be reduced or abolished, and thus the demand for Malaysian products in Vietnam’s domestic market will inevitably increase (Mohd Zaffrie et al., 2017).
Most of the tariffs imposed on agricultural exports will be eliminated under the TPP. Vietnam will eliminate tariffs immediately on 28.5% of trade in agricultural products once TPPA is implemented, whereby the balance of up to 99.1% will be reduced within 15 years. Export taxes are prohibited under the TPPA. Vietnam imposed export taxes on some of their agricultural goods, therefore once the TPP enters into force, all the export taxes should be abolished within the agreed time period.
Malaysia was ranked number seven in 2014, after the United States, Argentina, Brazil, Australia, China and India for the importation of agricultural products in Vietnam (Fig. 13). There has been a significant increase in exports from major countries, from 2011 to 2014. This suggests that there is potential for agriculture and agro-based products from Malaysia to further penetrate the market in Vietnam.
Fig. 13. Trade trends to Vietnam (US$)
Source : UNCOMTRADE, 2016
Based on secondary data and observations conducted in the Vietnam market, most of the processed food using meat, fish and marine products are imported from Thailand and Malaysia (Fig. 14). Cocoa and cocoa confectionery is also another sector whereby Malaysia marks its presence in Vietnam market (Fig. 15). Malaysia is the main source of imports for most cocoa products and cocoa confectionery such as cocoa powder, chocolates and other cocoa-based confectionery.
Fig. 14. Top commodities exported to Vietnam, 2014 (US$) - (HS 16-Preparations of Meat, Fish, Crustaceans, Mollusks or other Aquatic Invertebrate)
Source : UNCOMTRADE, 2016
Fig. 15. Top commodities exported to Vietnam, 2014 (US$)- (HS 18-Cocoa and cocoa preparations)
Source : UNCOMTRADE, 2016
CONCLUSION
Malaysia, having a population of only slightly more than 30 million, is considered a small domestic market and needs to expand to new markets to spur exports and seek new investments. The aim is for Malaysia to find ways to leverage on its existing economic relationship and trade agreements such as AFTA and the TPP, to further impel its trade in agricultural goods and agro-based products.
Questions were often raised on how trade liberalization via trade agreements may boost trade with existing markets like Singapore, Brunei and Vietnam. The ratification of the TPP agreement not only provides a transparent trading environment but also opportunities to widen market access and benefit from reduction of trading costs due to tariff elimination. Even more so, is the reduction in non-tariff barriers. Strategies need to be identified for Malaysia to strengthen the presence of its existing products, as well as new products to be developed following market needs. It is important to note though, that bilateral or multilateral trade agreements also opens up similar opportunities to other member countries. This may intensify competition. Therefore, the agriculture industry players which include exporters, traders and entrepreneurs should be ready to increase its efforts to maximize the preferential treatment received to boost the competitiveness of agriculture and agro-based products in the global market.
REFERENCES
Alaa. S. (2015). Zeti Syas Ringgit Significantly Undervalued Amid Growth. Retrieved 11 November 2017, from http://www.bloomberg.com/news/articles/2015-11-11/zeti-says-ringgit-significantly-undervalued-amid-economic-growth
AVA. (2015). The Food We Eat. Singapore’s Food Supply. Retrieved on 11 June 2017 from http://www.ava.gov.sg/explore-by-sections/food/singapore-food-supply/the-food-we-eat
Christine. M., and Erica. M. (1994), A Framework for Utilizing Marketing Expertise in Strategy Design
Index Mundi (2016). Singapore Demographics Profile 2016. Retrieved on 8 June 2016 from http://www.indexmundi.com/singapore/demographics_profilehtml
MATRADE (2016). Retrieved on 10 Nov 2017 from http://www.matrade.gov.my/en/malaysia-exporters- section/253-asean/4669-malaysias-trade-with-asean
MITI (2016) . MITI Report 2015. Malaysia : Sasyaz Holdings Sdn. Bhd.
Mohd Zaffrie, M. A., Mohd Hafizudin, Z. And Nik Rozana, N.M.M (2017). The Potential of Malaysian Fresh Agriculture Products in Vietnam Market. Retrieved 28 March 2017 from http://ap.fftc.agnet.org/ap_db.php?id=760
PwC. (2015). Study on Potential Economic Impact of TPPA on the Malaysian Economy and Selected Key Economic Sectors. Retrieved on 15 Nov 2017 from http://fta.miti.gov.my/miti-fta/resources/TPPA_PwC_CBA_- Final_Report_021215_FINAL_(corrected).pdf on.
Rozhan. A.D. (2016). Potential Benefits of TPPA on Malaysia’s Agrofood Sector. FFTC Agricultural Policy Platform (FFTC-AP). Retrieved on 10 November 2017 from http://ap.fftc.agnet.org/ap_db.php?id=670
Singapore Expats (2016). About Singapore. Retrieved on 8 June 2017 from http://www.singaporeexpats.com/about-singapore/about-singapore.htm
Tom. O. (2015). Coca-cola: Ansoff matrix, The Marketing Report. Retrieved on 10 November 2016 from https://themarketingagenda.com/2015/03/28/coca-cola-ansoff-matrix/
Trading Economics. (2016). Singapore GDP. Retrieved on 10 June 2017 from http://www.tradingeconomics.com/singapore/gdp
United Nations. (2016). UN Comtrade database.
World Customs Organization (WCO). (2016). What is the Harmonized System (HS). Retrived on 9 November 2016 from http://www.wcoomd.org/en/topics/nomenclature/overview/what-is-the-harmonized-system.aspx
World Economic Forum. (2016). Global Competitiveness Report 2014-2015. Retrieved on 10 June 2017 from http://reports.weforum.org/global-competitiveness-report-2014- 2015/top-10/
Date submitted: April 9, 2018
Reviewed, edited and uploaded: April 26, 2018