Introduction
Increased productivity and profitability of farming is an important pathway to reduce poverty in the rural areas of Myanmar. After land, water and human resources, fertilizer is undoubtedly one of the agricultural inputs to increase the high yield when used in proper time and proper nutrient balance. It is one of the agricultural technologies that have huge potential for raising the productivity of poor smallholders, enabling them to increase income, accumulate assets, and set themselves economically on a pathway out of poverty.
Proper and adequate access of fertilizers is very crucial to enhance agricultural productivity. An efficient fertilizer distribution system requires access to fertilizer at the right time and the right form of nutrients for farmers. Compared to the vast land resources in Myanmar, the level of agrochemicals used in the agricultural sector are considerably low. Chemical fertilizers were first introduced to Myanmar in 1956, but widespread use did not occur until 1978 when the government encouraged fertilizer use by subsidizing fertilizer prices. Therefore, fertilizer prices were heavily subsidized by the government before 1990s. Since then, the government had removed all subsidies. Subsequently, the market prices have risen to international level and the government has also allowed the private sector to import and distribute fertilizers. Despite the increases in prices, few private companies were willing to import and distribute fertilizers because of uncertain domestic demand and unclear importing procedures. Therefore, the fertilizer price was totally free market price based on the international fertilizer price, transportation cost and exchange rate between currency of Myanmar and trade partners after 2003 (Hnin Yu Lwin et al. 2013).
Fertilizer supply chain and market structure are evolving rapidly to meet farmers' demand. Supply of inputs including fertilizers are needed and are considered as one of the most important factors for increasing yield. In Myanmar, the supply of chemical fertilizers is less than the required amount and demand is increasing (MOAI 2008). This decline of fertilizer supply comes mainly from the decrease of urea fertilizer production. There is no private fertilizer manufacturer in Myanmar not only for urea fertilizer but also for compound fertilizers. As Myanmar does not have enough fertilizer production, the government attempts to boost private imports by providing import duty exemption, and private sector continued to be the main importer.
The domestic fertilizer industry in Myanmar is concentrated around the production of urea fertilizer from the abundant sources of natural gas in the country. Fertilizer plants in Myanmar are scattered in Salay, Kyunchaung and Kyaw Swa, and another production of urea fertilizer from two new fertilizer plants, Myaung Daga in Hmawbi Township and another in Kan Gyi Dauk of Pathein Township, will support domestic requirements in the future (Tin Maung Shwe 2011). Those are all State Owned Enterprises (SOEs). Myanmar produced only 100,000 tons of fertilizer annually at home and another 900,000 tons are needed to meet the heavy demand of 1 million tons for crop cultivation (en.trend.az/capital/business/1386274.html).
In 2012 and 2013, 208,615 and 156,586 metric tons (MT) of urea fertilizer was produced (MOALI, 2014). In 2012, fertilizer imports in Myanmar were 35,858 tons of nitrogen fertilizer, 21,750 tons of phosphate fertilizer, and 16,547 tons of potassium fertilizer (FAO, online database). The distribution of fertilizer by MOALI was 13,612 MT in 2006-07, and it was decreased to 5,707 MT in 2010-11 (CSO, 2011).
Rationale
The major problem of the fertilizer sector in Myanmar is marketing management along the supply chain. The performance of market participants in the fertilizer marketing can influence the marketing efficiency. In Nay Pyi Taw Council area, Tatkon Township is situated between latitude 20˚20' north and east longitudes 96˚ 30'. The area of Tatkon Township was 180,237 hectares and the cultivated areas were 43,780 hectares, 24.3% of total areas. The area of paddy land (Le) was about 21,145 hectares and dry land (Ya) was about 22,627 hectares (DoA, 2014). Paddy and various kinds of vegetables were grown by most of the farmers in Tatkon Township. The study area is one of the largest agricultural production areas and income from agricultural sector mainly influenced the households’ income. In order to improve the agricultural sector, well- functioning fertilizer markets are needed to carry out in Tatkon Township. This Township is one of the most fertilizer marketing Townships in the Mandalay region. Thus, investigating fertilizer supply chain and market structure to develop an efficient fertilizer marketing system is crucial in this township. There are two main objectives in this study:
- To identify marketing activities of market participants along the fertilizer supply chain including end users (farmers) in Tatkon Township; and
- To examine fertilizer market structure including marketing channel, marketing cost and marketing margin in Tatkon Township.
Results and Discussion
Business Size of Local Wholesalers
In this study, six local wholesalers were interviewed to determine the fertilizer marketing functions and marketing channels in Tatkon Township. Business sizes of local wholesalers were distinguished according to the annual sale amounts of fertilizers (Table 1). In the fertilizer market, Tatkon Township, local wholesalers were marketing only registered urea fertilizers, and additional selling of both registered and unregistered compound fertilizers. Based on the survey data, the amounts of total annual sale by the sampled local wholesalers were (2,934.04) MT in which the sales of registered urea fertilizers, registered compound fertilizers and unregistered compound fertilizers were 60%, 32% and 8% respectively.
Local wholesalers (LW1) and (LW2), the largest local wholesalers mostly sold registered urea fertilizers which were 64% and 70% of total annual sale. About half of the total annual sale of local wholesalers (LW3) and (LW5) were registered compound fertilizers. Local wholesalers (LW4) were distinctly handling the registered and unregistered compound fertilizers which were 36% each of total annual sale. The smallest local wholesalers (LW6) mainly sold registered urea fertilizer which accounted for 67% of the total annual sale. According to this result, registered urea fertilizers was one of the most supplies in the fertilizer market and the registered compound fertilizers was the second most important fertilizers in the study area. The supplies of unregistered compound fertilizers were the lowest among the fertilizers in the study area.
Table1. Annual sale amount of fertilizers by local wholesalers in Tatkon Township
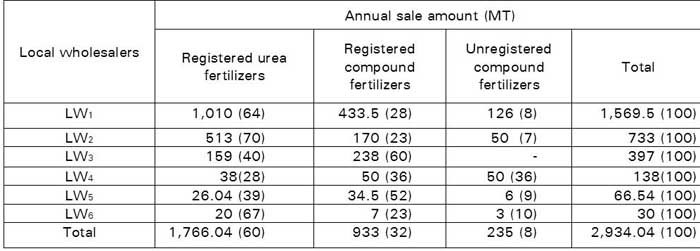
Note: Figures in the parentheses represent percentage.
Marketing Functions of Local Wholesalers
The local wholesalers were the main intermediaries and usually operated large - scale business activities in the study area. Marketing activities of local wholesalers developed a market or demand for fertilizers, and then sold them to the potential buyers such as village retailers, retailers in Tatkon Township and farmers. Table 2 showed annual sales of registered urea fertilizers in terms of trading brands by local wholesalers in Tatkon Township. All local wholesalers sold registered urea fertilizers imported from China and domestically produced urea. In the urea fertilizer market, there were four trading brands sold by local wholesalers Shwe Taung (97%), Shwe Nagar-1 (2%), Shwe Nagar-2 (0.8%) and domestically produced urea (0.2%). Therefore, the most popular brand Shwe Taung urea fertilizer occupied the largest amounts of total annual sale 1,766.04 MT.
The marketing of registered compound fertilizers by the sample local wholesalers in Tatkon Township was investigated as shown in Table 3. The local wholesaler (LW1) was a dealer of Awba products therefore mainly sold products of Awba (65. 7% of total annual sale). And local wholesaler (LW3) was a dealer of products of Golden Cock (53%) and Zar Ma Ni (31%). The top sales of local wholesaler (LW2) were products of Armo, Golden Key and Golden Lion which were 29%, 20% and 15% of total annual sale respectively. Local wholesalers (LW4 and LW5) mostly sold Awba and Armo products which were almost one-third of the total sales. Products from Awba again occupied a big share of 62% of the total annual sales by the smallest local wholesaler (LW6).
In the case of selling of unregistered compound fertilizers, there were only two trading brands (local name), Butterfly and Lu Yine Khaung compound fertilizers. All local wholesalers except for local wholesalers (Lw3) sold unregistered compound fertilizers. According to the survey data, Butterfly was the top seller (51%) followed by Lu Yine Khaung (49%) of total sales of unregistered compound fertilizers (Table 4).
Table 2. Annual sales of registered urea fertilizers by local wholesalers in Tatkon Township
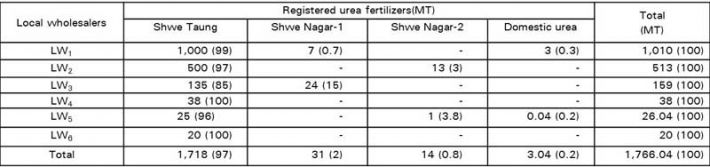
Note: Figures in the parentheses represent percentage.
Table 3. Annual sales of registered compound fertilizers by local wholesalers in Tatkon Township
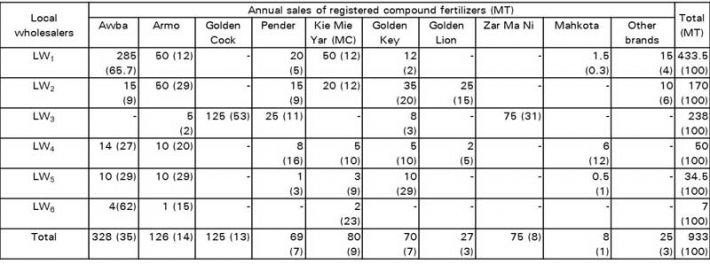
Note: Figures in the parentheses represent percentage.
Table 4. Annual sale of unregistered compound fertilizers by local wholesalers in Tatkon Township

Note: Figures in the parentheses represent percentage.
Business Size of Village Retailers
Village retailers were the second most important intermediaries in the fertilizer marketing channel through which fertilizers were reached to the final users or farmers. They reported that fertilizers were purchased mostly from the local wholesalers in Tatkon Township, from other markets and sometimes from company agents in Tatkon Township. Compared to business sizes of local wholesalers, village retailers' business sizes were also varied according to their annual sale amounts of fertilizers (Table 5). In the selected villages of Tatkon Township, two out of five village retailers were selling registered urea fertilizers. Furthermore registered compound fertilizers were marketing by all village retailers and unregistered compound fertilizers were sold by one out of five village retailers. According to the survey outcome, total annual sales of fertilizers by the sampled village retailers were 192.5 MT in which the sales of registered urea fertilizer, registered and unregistered compound fertilizers were 64.9%, 35% and 0.1% respectively.
Among the sampled village retailers; (VR1 and VR2) were the largest retailers who mostly sold registered urea fertilizer which were 72% and 63.3% of total annual sale. Only registered compound fertilizers were sold by village retailers (VR3), (VR4) and (VR5). According to this finding, registered urea fertilizer especially Shwe Taung was one of the most sold supplies and registered compound fertilizers came in second.
Table 5. Annual sale amount of fertilizers by village retailers in Tatkon Township
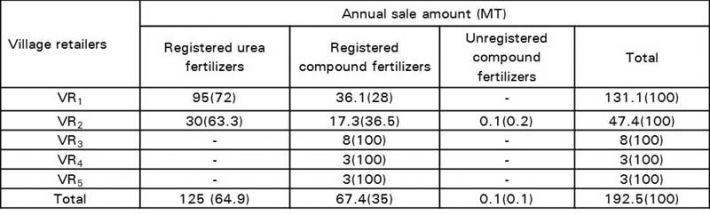
Note: Figures in the parentheses represent percentage.
Marketing Functions of Village Retailers
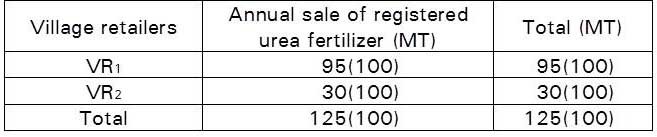
Table 6 presented annual sales of registered urea fertilizers in terms of trading brands by village retailers in Tatkon Township. Only the largest village retailers (VR1 and VR2) sold registered urea fertilizers (95 and 30 MT) imported from China, locally named, Shwe Taung. The rest of the village retailers did not sell because farmers in those villages purchased mainly from the local wholesalers in Tatkon Township.
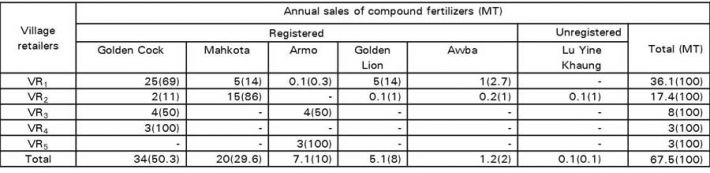
The marketing of registered compound fertilizers by the sample retailers in selected villages at Tatkon Township was investigated as shown in Table 7. The largest village retailer (VR1) mainly sold products of Golden Cock which occupied 69% of the total annual sales of the total annual sales, 86% were products of Mahkota which was the majority commodity for the second largest village retailers (VR2). Only the products from Golden Cock and Armo were considered the majority sale by village retailer (VR3). Village retailer (VR4) was a dealer of products of Golden Cock. Furthermore, the smallest village retailer (VR5) sold Armo because of a dealer of Armo product. Unregistered compound fertilizer was not much deal in the marketing. Only Lu Yine Khaung unregistered compound fertilizer was sold by village retailer (VR2).
Table 6. Annual sales of registered urea fertilizers by retailers in selected villages
Note: Figures in the parentheses represent percentage.
Table 7. Annual sales of registered and unregistered compound fertilizers by retailers in the selected villages
Note: Figures in the parentheses represent percentage.
Marketing Activities of Local Wholesalers and Village Retailers
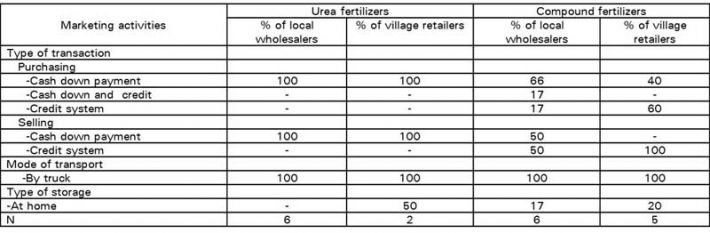
The market participants purchased not only urea from China but also domestically produced urea fertilizers from Mandalay market by cash down payment transaction. And they also used cash down payment transaction in selling urea fertilizer. In case of imported compound fertilizers market, the registered and unregistered compound fertilizers were available in the local market. Of the 66% of local wholesalers who purchased fertilizers by cash down payment transaction, 17% of them utilized both cash and credit system and the rest (17%) purchased only by credit system. For those who purchased by credit system, an interest rate of 3% per month has to be paid. About 50% of the local wholesalers sold fertilizers by cash down payment transaction and the rest 50% sold by credit system. Credit-based sales applied an interest rate of 5% per month. In case of compound fertilizers, market for village retailers, 60% of them used to purchase by credit system. Those who purchased by credit system, had to pay an interest rate of 3% per month. All village retailers utilized credit system to sell fertilizers with an interest rate of 5% per month. They totally used truck in mode of transport in the study area (Table 8).
Table 8. Marketing activities of the local wholesalers and village retailers for fertilizers market in Tatkon Township
Marketing Behavior of Diamond Star Company Limited
Tatkon Township was one of the most demanded fertilizers in the Mandalay region. And trading fertilizer brands [(15:15:15), (10:10:5), (19:9:19), (potash only) and (phosphate only)] from Diamond star Company Limited were the most popular in the study area. The company agents mainly distributed their products about 97% of total annual sales to local wholesalers and local retailers, and 3% of total annual sales flowed to the farmers. The following Table 9 showed the amounts of annual sale from Diamond Star company agents in Tatkon Township. Imported five trading brands were marketing in the study area. Among them, the nutrient (N, P, K) ratio (15:15:15) (65%) and (10:10:5) (20%) of total annual sales were the top sale brands in the market. In fertilizer marketing, the company agent mostly sold by cash transaction but sometimes sold with credit system which was paid about one week with no interest rate depending upon the relationship with market participants.
Table 9. Amounts of annual sales of fertilizer by Diamond Star Company Limited in Tatkon Township

Note: Figures in the parentheses represent percentage.
Marketing Behavior of Golden Lion High Tech Agricultural Resources Company Limited
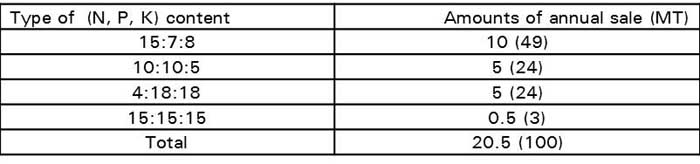
Trading fertilizer brands [(15:7:8), (10:10:5), (4:18:18) and (15:15:15)] from Golden Lion High Tech Agricultural Resources Company Limited were also the most popular in the study area. The company agents mainly distributed their products of which about 61% of the total annual sales go to marketing intermediaries such as wholesalers and retailers in Tatkon Township. About 39% of the total annual sales were spread to the retailers in villages. The following Table (10) explained the amounts of annual sales from Golden Lion company agents in Tatkon Township. Four imported trading brands were selling in the study area. The nutrient (N, P, K) ratio (15:7:8) which was 49% of the total annual sales, the rest trading brands (10:10:5) and (4:18:18) which were 24% each of the total annual sales were the peak sale brands in the local market. In terms of fertilizer marketing, the company agents mostly used cash transaction but occasionally sold using the credit system to pay back within one week or one month with no interest rate depending upon the relationship with market participants.
Table 10. Amounts of annual sales of fertilizers by Golden Lion High Tech Agricultural Resources Company Limited in Tatkon Township
Note: Figures in the parentheses represent percentage.
Sources and Types of Buying Fertilizers by Farmers
Farmers could get fertilizers easily in their villages and in Tatkon Township. Therefore, farmers bought from different sources of fertilizer dealers. As shown in the Figure 1, 50% each of farmers bought urea fertilizer from village retailers and local wholesalers in Tatkon Town. In the case of compound fertilizers, 65% of sample farmers purchased from village retailers whereas 35% of them purchased from local wholesalers.
Two types of transactions occurred in purchasing fertilizers by farmers in the study area. In the case of urea fertilizer, 50% of farmers bought in cash down transaction type and the rest 50% purchased by credit system transaction. About 40% of farmers bought compound fertilizers in cash down system and the rest 60% of them used credit system (Fig. 2). Credit-based system transaction had an interest rate of 5 % per month. Even though the price of fertilizers using the credit system was higher than cash down system, most farmers chose buying fertilizers with credit system probably due to lack of capital for fertilizer demand.
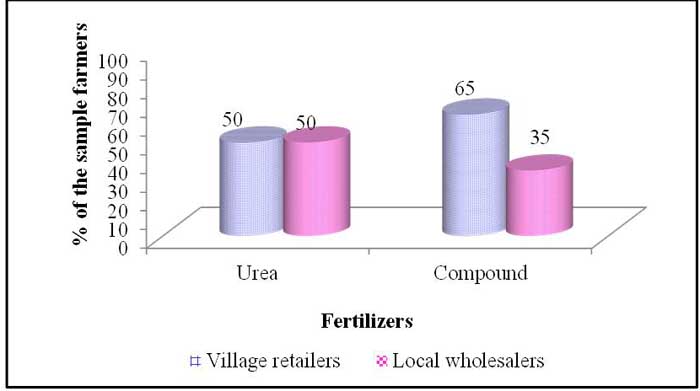
Fig. 1. Sources of fertilizer suppliers for sample farmers
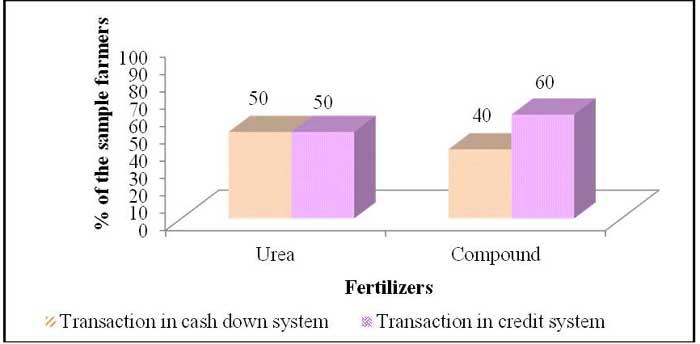
Fig. 2. Types of buying fertilizers by sample farmers
Marketing Channels of Fertilizer in Tatkon Township
Marketing channels are set of interdependent organizations involved in the process of making a product or service available for use (Kolter, 2003). Fertilizer marketing channels were observed for understanding the commodity flow from other markets or company agents to market intermediaries and to final user farmers. Figure 3 showed the fertilizer marketing channels in the study area. There were three main marketing channels of fertilizer in Tatkon Township. The fertilizer marketing channel (1) was the major channel and marketing the largest amount of fertilizers which flowed from other markets (Mandalay, Yangon and Myingyan) and company agents to local wholesalers and resold to final user farmers. In addition, local wholesalers sold to village retailers and then to end user farmers. Another way, retailers in Tatkon Township also purchased from local wholesalers and then traded to farmers. In this channel local wholesalers were the main players and had market power. In the fertilizer marketing channel (2), fertilizers flowed from other markets and company agents directly to village retailers and are then sold to the farmers. Compared to channel (1) and (2), the marketing channel (3) was marketing the lowest amounts of fertilizers which reached only directly from company agents and then to local wholesalers and village retailers and finally, to farmers. Therefore, among these three marketing channels, channel (1) which had more market participants, were selected for calculating the marketing margin, cost and profit of fertilizer marketing in the study area.
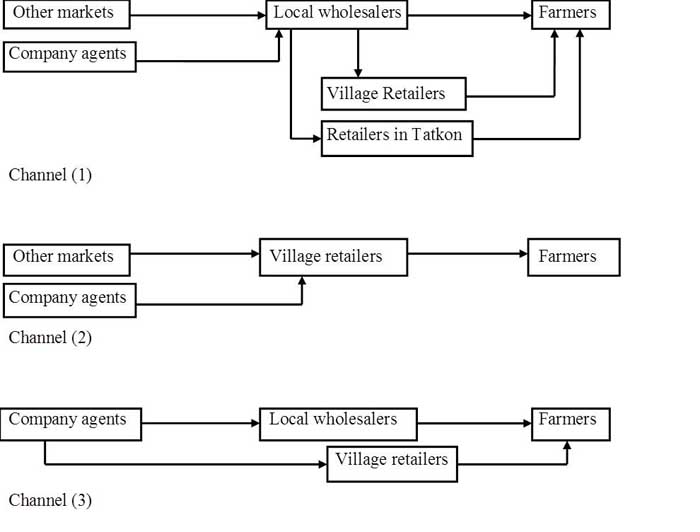
Fig. 3. Marketing channels of fertilizers in Tatkon Township
Marketing Margin, Cost and Profit of Fertilizer Market
Marketing margins is defined as the price of a collection of marketing services which is the outcome of the demand for and the supply of such services. The amount can be interpreted as the cost of providing a mix of marketing services (Tomek and Robison, 1981).
In the first channel, urea, Armo and Golden Lion fertilizers from Mandalay market were calculated to investigate costs and profits of local wholesalers along the fertilizer market in the study area. Total marketing cost (transportation and labor cost) of urea, Armo and Golden Lion were 3.23%, 3.47% and 2.47% of farmgate price, respectively. Average profits of local wholesalers were 3.23% in urea, 8.38% in Armo and 7.82% of farmgate price in Golden Lion. Therefore, local wholesalers obtained the average profit for Armo was relatively higher than that of profit for urea and Golden Lion fertilizers in the study area. Awba and Kie Mie Yar compound fertilizers flowed to local wholesalers from Yangon market. According to this figure, average profit for Awba (3.16%) was rather higher than that of Kie Mie Yar (1.17%) which was occupied by local wholesalers. For Myingyan market, the average profit of Lu Yine Khaung (11.32%) was higher than that of Butterfly profit (9.09%) which was occupied by local wholesalers (Fig. 4).
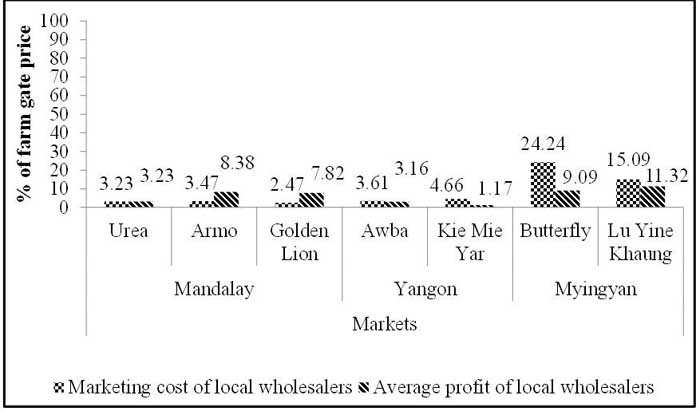
Fig. 4. Marketing costs and profits of local wholesalers in channel (1)
Conclusion and Policy Implication
The fertilizer supply chain was well composed of four main market intermediaries: local wholesalers; village retailers; company agents; and farmers. In the fertilizer market structure, Mandalay market was the key player for the distribution of imported urea fertilizer from China and domestically produced urea as local market participants such as local wholesalers and village retailers mainly relied on this market. Therefore, the means to promote the commodity (fertilizers) flow in the Mandalay market is through reduction of transportation cost or relaxation of some restrictions on trade. These will enhance the fertilizer market access by the market participants or end users, farmers. On the other hand, the monitoring or evaluation on the holding market power by the Mandalay market needs to be assessed in order to prevent market distortion by misconducting of big dealers in Mandalay market or to secure the consumers’ rights especially end users, farmers.
Among the imported (registered) urea fertilizers, local trading brand, Shwe Taung occupied a large share of local wholesalers and village retailers' sales. Although imported compound fertilizers were accessible in the study area, urea fertilizers were largely utilized by farmers. They should be trained to use appropriate and balanced fertilizer application to conserve poor soil condition. Two unregistered compound fertilizers from Myingyan market namely Butterfly and Lu Yine Khaung were also marketed by most local wholesalers and some village retailers in the study area. The marketed amount of unregistered compound fertilizers was the lowest compared to urea and compound fertilizers in the study area. Marketing of registered and unregistered compound fertilizers in Myanmar and its nutrient content should be regulated.
Domestically produced urea was not popular in the local market because of its inconsistent granule type, easily solvent and improper packaging. The constraints of domestic fertilizer production and marketing should be explored. Enhancing domestically produced fertilizers can fulfill the local demand of fertilizers and provide affordable prices to the farmer. Therefore, local urea fertilizer production should be promoted by solving problems particularly related with quality competitiveness. Additionally, rules and regulations to ensure competitive practices should be taken into account.
In addition, the fertilizer market participants did not have enough capital for fertilizer marketing including the endusers-the farmers. As the local traders are marketing fertilizers with credit system, it is essential to provide loans which can reduce the transaction costs not only for market intermediaries but also for farmers.
The imported registered urea and compound fertilizer products were purchased from Mandalay and Yangon markets by the local wholesalers and village retailers. Thus, distribution system of fertilizers from wholesale markets to farmers’ field should be promoted by minimizing transaction costs. The high transportation cost in the marketing channel was one of the main obstacles in Myanmar. In addition, the fertilizer market participants did not have enough capital for fertilizer marketing including the end users. As the local traders were marketing fertilizers with credit system, it is essential to provide loans which can reduce the transaction costs not only for market intermediaries but also for endusers. Efficient market information system is the main stream for the whole development of the marketing channel. The government should pay attention to the development of fertilizer distribution system by enhancing the knowledge of intermediaries through marketing extension services. Therefore, the government authorities should link to investors in the fertilizer sector so that the efficiency of agricultural sector in Myanmar can improve significantly.
References
CSO (Central Statistical Organization). 2011. Myanmar Agricultural Statistics (1997-2011). Ministry of National Planning and Economic Development (MNPED), Myanmar.
DoA (Department of Agriculture). 2014. Reports Documents, Tatkon Township, Nay Pyi Taw.
en.trend.az/capital/business/1386274.html.
FAOSTAT, online database.
Hnin Yu Lwin et al. 2013. Role of Fertilizer Policy in Transforming Agriculture of Myanmar. Resakss Asia, Facilitated by International Food Policy Research Institute (IFPRI). Washington, DC.
Kotler, P. 2003. Marketing Management, 11th edition. Upper Saddle River, NJ: Prentice Hall International.
MOAI (Ministry of Agricultural and Irrigation). 2008. Usage of Fertilizer. Special Report.
MOAI (Ministry of Agricultural and Irrigation). 2014. Agricultural at a Glance, Myanmar.
Tin Maung Shwe 2011. Agriculture Development Issues and Strategies, Myanmar.
Tomek, G. W. and K. L. Robinson 1981. Agricultural Product Prices. Ithaca. NY. Cornell University Press.
|
Date submitted: Feb. 8, 2017
Reviewed, edited and uploaded: Feb. 10, 2017
|

Fertilizer Supply Chain and Market Structure in Myanmar: A Case Study in Tatkon Township, Nay Pyi Taw
Introduction
Increased productivity and profitability of farming is an important pathway to reduce poverty in the rural areas of Myanmar. After land, water and human resources, fertilizer is undoubtedly one of the agricultural inputs to increase the high yield when used in proper time and proper nutrient balance. It is one of the agricultural technologies that have huge potential for raising the productivity of poor smallholders, enabling them to increase income, accumulate assets, and set themselves economically on a pathway out of poverty.
Proper and adequate access of fertilizers is very crucial to enhance agricultural productivity. An efficient fertilizer distribution system requires access to fertilizer at the right time and the right form of nutrients for farmers. Compared to the vast land resources in Myanmar, the level of agrochemicals used in the agricultural sector are considerably low. Chemical fertilizers were first introduced to Myanmar in 1956, but widespread use did not occur until 1978 when the government encouraged fertilizer use by subsidizing fertilizer prices. Therefore, fertilizer prices were heavily subsidized by the government before 1990s. Since then, the government had removed all subsidies. Subsequently, the market prices have risen to international level and the government has also allowed the private sector to import and distribute fertilizers. Despite the increases in prices, few private companies were willing to import and distribute fertilizers because of uncertain domestic demand and unclear importing procedures. Therefore, the fertilizer price was totally free market price based on the international fertilizer price, transportation cost and exchange rate between currency of Myanmar and trade partners after 2003 (Hnin Yu Lwin et al. 2013).
Fertilizer supply chain and market structure are evolving rapidly to meet farmers' demand. Supply of inputs including fertilizers are needed and are considered as one of the most important factors for increasing yield. In Myanmar, the supply of chemical fertilizers is less than the required amount and demand is increasing (MOAI 2008). This decline of fertilizer supply comes mainly from the decrease of urea fertilizer production. There is no private fertilizer manufacturer in Myanmar not only for urea fertilizer but also for compound fertilizers. As Myanmar does not have enough fertilizer production, the government attempts to boost private imports by providing import duty exemption, and private sector continued to be the main importer.
The domestic fertilizer industry in Myanmar is concentrated around the production of urea fertilizer from the abundant sources of natural gas in the country. Fertilizer plants in Myanmar are scattered in Salay, Kyunchaung and Kyaw Swa, and another production of urea fertilizer from two new fertilizer plants, Myaung Daga in Hmawbi Township and another in Kan Gyi Dauk of Pathein Township, will support domestic requirements in the future (Tin Maung Shwe 2011). Those are all State Owned Enterprises (SOEs). Myanmar produced only 100,000 tons of fertilizer annually at home and another 900,000 tons are needed to meet the heavy demand of 1 million tons for crop cultivation (en.trend.az/capital/business/1386274.html).
In 2012 and 2013, 208,615 and 156,586 metric tons (MT) of urea fertilizer was produced (MOALI, 2014). In 2012, fertilizer imports in Myanmar were 35,858 tons of nitrogen fertilizer, 21,750 tons of phosphate fertilizer, and 16,547 tons of potassium fertilizer (FAO, online database). The distribution of fertilizer by MOALI was 13,612 MT in 2006-07, and it was decreased to 5,707 MT in 2010-11 (CSO, 2011).
Rationale
The major problem of the fertilizer sector in Myanmar is marketing management along the supply chain. The performance of market participants in the fertilizer marketing can influence the marketing efficiency. In Nay Pyi Taw Council area, Tatkon Township is situated between latitude 20˚20' north and east longitudes 96˚ 30'. The area of Tatkon Township was 180,237 hectares and the cultivated areas were 43,780 hectares, 24.3% of total areas. The area of paddy land (Le) was about 21,145 hectares and dry land (Ya) was about 22,627 hectares (DoA, 2014). Paddy and various kinds of vegetables were grown by most of the farmers in Tatkon Township. The study area is one of the largest agricultural production areas and income from agricultural sector mainly influenced the households’ income. In order to improve the agricultural sector, well- functioning fertilizer markets are needed to carry out in Tatkon Township. This Township is one of the most fertilizer marketing Townships in the Mandalay region. Thus, investigating fertilizer supply chain and market structure to develop an efficient fertilizer marketing system is crucial in this township. There are two main objectives in this study:
Results and Discussion
Business Size of Local Wholesalers
In this study, six local wholesalers were interviewed to determine the fertilizer marketing functions and marketing channels in Tatkon Township. Business sizes of local wholesalers were distinguished according to the annual sale amounts of fertilizers (Table 1). In the fertilizer market, Tatkon Township, local wholesalers were marketing only registered urea fertilizers, and additional selling of both registered and unregistered compound fertilizers. Based on the survey data, the amounts of total annual sale by the sampled local wholesalers were (2,934.04) MT in which the sales of registered urea fertilizers, registered compound fertilizers and unregistered compound fertilizers were 60%, 32% and 8% respectively.
Local wholesalers (LW1) and (LW2), the largest local wholesalers mostly sold registered urea fertilizers which were 64% and 70% of total annual sale. About half of the total annual sale of local wholesalers (LW3) and (LW5) were registered compound fertilizers. Local wholesalers (LW4) were distinctly handling the registered and unregistered compound fertilizers which were 36% each of total annual sale. The smallest local wholesalers (LW6) mainly sold registered urea fertilizer which accounted for 67% of the total annual sale. According to this result, registered urea fertilizers was one of the most supplies in the fertilizer market and the registered compound fertilizers was the second most important fertilizers in the study area. The supplies of unregistered compound fertilizers were the lowest among the fertilizers in the study area.
Table1. Annual sale amount of fertilizers by local wholesalers in Tatkon Township
Note: Figures in the parentheses represent percentage.
Marketing Functions of Local Wholesalers
The local wholesalers were the main intermediaries and usually operated large - scale business activities in the study area. Marketing activities of local wholesalers developed a market or demand for fertilizers, and then sold them to the potential buyers such as village retailers, retailers in Tatkon Township and farmers. Table 2 showed annual sales of registered urea fertilizers in terms of trading brands by local wholesalers in Tatkon Township. All local wholesalers sold registered urea fertilizers imported from China and domestically produced urea. In the urea fertilizer market, there were four trading brands sold by local wholesalers Shwe Taung (97%), Shwe Nagar-1 (2%), Shwe Nagar-2 (0.8%) and domestically produced urea (0.2%). Therefore, the most popular brand Shwe Taung urea fertilizer occupied the largest amounts of total annual sale 1,766.04 MT.
The marketing of registered compound fertilizers by the sample local wholesalers in Tatkon Township was investigated as shown in Table 3. The local wholesaler (LW1) was a dealer of Awba products therefore mainly sold products of Awba (65. 7% of total annual sale). And local wholesaler (LW3) was a dealer of products of Golden Cock (53%) and Zar Ma Ni (31%). The top sales of local wholesaler (LW2) were products of Armo, Golden Key and Golden Lion which were 29%, 20% and 15% of total annual sale respectively. Local wholesalers (LW4 and LW5) mostly sold Awba and Armo products which were almost one-third of the total sales. Products from Awba again occupied a big share of 62% of the total annual sales by the smallest local wholesaler (LW6).
In the case of selling of unregistered compound fertilizers, there were only two trading brands (local name), Butterfly and Lu Yine Khaung compound fertilizers. All local wholesalers except for local wholesalers (Lw3) sold unregistered compound fertilizers. According to the survey data, Butterfly was the top seller (51%) followed by Lu Yine Khaung (49%) of total sales of unregistered compound fertilizers (Table 4).
Table 2. Annual sales of registered urea fertilizers by local wholesalers in Tatkon Township
Note: Figures in the parentheses represent percentage.
Table 3. Annual sales of registered compound fertilizers by local wholesalers in Tatkon Township
Note: Figures in the parentheses represent percentage.
Table 4. Annual sale of unregistered compound fertilizers by local wholesalers in Tatkon Township
Note: Figures in the parentheses represent percentage.
Business Size of Village Retailers
Village retailers were the second most important intermediaries in the fertilizer marketing channel through which fertilizers were reached to the final users or farmers. They reported that fertilizers were purchased mostly from the local wholesalers in Tatkon Township, from other markets and sometimes from company agents in Tatkon Township. Compared to business sizes of local wholesalers, village retailers' business sizes were also varied according to their annual sale amounts of fertilizers (Table 5). In the selected villages of Tatkon Township, two out of five village retailers were selling registered urea fertilizers. Furthermore registered compound fertilizers were marketing by all village retailers and unregistered compound fertilizers were sold by one out of five village retailers. According to the survey outcome, total annual sales of fertilizers by the sampled village retailers were 192.5 MT in which the sales of registered urea fertilizer, registered and unregistered compound fertilizers were 64.9%, 35% and 0.1% respectively.
Among the sampled village retailers; (VR1 and VR2) were the largest retailers who mostly sold registered urea fertilizer which were 72% and 63.3% of total annual sale. Only registered compound fertilizers were sold by village retailers (VR3), (VR4) and (VR5). According to this finding, registered urea fertilizer especially Shwe Taung was one of the most sold supplies and registered compound fertilizers came in second.
Table 5. Annual sale amount of fertilizers by village retailers in Tatkon Township
Note: Figures in the parentheses represent percentage.
Marketing Functions of Village Retailers
Table 6 presented annual sales of registered urea fertilizers in terms of trading brands by village retailers in Tatkon Township. Only the largest village retailers (VR1 and VR2) sold registered urea fertilizers (95 and 30 MT) imported from China, locally named, Shwe Taung. The rest of the village retailers did not sell because farmers in those villages purchased mainly from the local wholesalers in Tatkon Township.
The marketing of registered compound fertilizers by the sample retailers in selected villages at Tatkon Township was investigated as shown in Table 7. The largest village retailer (VR1) mainly sold products of Golden Cock which occupied 69% of the total annual sales of the total annual sales, 86% were products of Mahkota which was the majority commodity for the second largest village retailers (VR2). Only the products from Golden Cock and Armo were considered the majority sale by village retailer (VR3). Village retailer (VR4) was a dealer of products of Golden Cock. Furthermore, the smallest village retailer (VR5) sold Armo because of a dealer of Armo product. Unregistered compound fertilizer was not much deal in the marketing. Only Lu Yine Khaung unregistered compound fertilizer was sold by village retailer (VR2).
Table 6. Annual sales of registered urea fertilizers by retailers in selected villages
Note: Figures in the parentheses represent percentage.
Table 7. Annual sales of registered and unregistered compound fertilizers by retailers in the selected villages
Note: Figures in the parentheses represent percentage.
Marketing Activities of Local Wholesalers and Village Retailers
The market participants purchased not only urea from China but also domestically produced urea fertilizers from Mandalay market by cash down payment transaction. And they also used cash down payment transaction in selling urea fertilizer. In case of imported compound fertilizers market, the registered and unregistered compound fertilizers were available in the local market. Of the 66% of local wholesalers who purchased fertilizers by cash down payment transaction, 17% of them utilized both cash and credit system and the rest (17%) purchased only by credit system. For those who purchased by credit system, an interest rate of 3% per month has to be paid. About 50% of the local wholesalers sold fertilizers by cash down payment transaction and the rest 50% sold by credit system. Credit-based sales applied an interest rate of 5% per month. In case of compound fertilizers, market for village retailers, 60% of them used to purchase by credit system. Those who purchased by credit system, had to pay an interest rate of 3% per month. All village retailers utilized credit system to sell fertilizers with an interest rate of 5% per month. They totally used truck in mode of transport in the study area (Table 8).
Table 8. Marketing activities of the local wholesalers and village retailers for fertilizers market in Tatkon Township
Marketing Behavior of Diamond Star Company Limited
Tatkon Township was one of the most demanded fertilizers in the Mandalay region. And trading fertilizer brands [(15:15:15), (10:10:5), (19:9:19), (potash only) and (phosphate only)] from Diamond star Company Limited were the most popular in the study area. The company agents mainly distributed their products about 97% of total annual sales to local wholesalers and local retailers, and 3% of total annual sales flowed to the farmers. The following Table 9 showed the amounts of annual sale from Diamond Star company agents in Tatkon Township. Imported five trading brands were marketing in the study area. Among them, the nutrient (N, P, K) ratio (15:15:15) (65%) and (10:10:5) (20%) of total annual sales were the top sale brands in the market. In fertilizer marketing, the company agent mostly sold by cash transaction but sometimes sold with credit system which was paid about one week with no interest rate depending upon the relationship with market participants.
Table 9. Amounts of annual sales of fertilizer by Diamond Star Company Limited in Tatkon Township
Note: Figures in the parentheses represent percentage.
Marketing Behavior of Golden Lion High Tech Agricultural Resources Company Limited
Trading fertilizer brands [(15:7:8), (10:10:5), (4:18:18) and (15:15:15)] from Golden Lion High Tech Agricultural Resources Company Limited were also the most popular in the study area. The company agents mainly distributed their products of which about 61% of the total annual sales go to marketing intermediaries such as wholesalers and retailers in Tatkon Township. About 39% of the total annual sales were spread to the retailers in villages. The following Table (10) explained the amounts of annual sales from Golden Lion company agents in Tatkon Township. Four imported trading brands were selling in the study area. The nutrient (N, P, K) ratio (15:7:8) which was 49% of the total annual sales, the rest trading brands (10:10:5) and (4:18:18) which were 24% each of the total annual sales were the peak sale brands in the local market. In terms of fertilizer marketing, the company agents mostly used cash transaction but occasionally sold using the credit system to pay back within one week or one month with no interest rate depending upon the relationship with market participants.
Table 10. Amounts of annual sales of fertilizers by Golden Lion High Tech Agricultural Resources Company Limited in Tatkon Township
Note: Figures in the parentheses represent percentage.
Sources and Types of Buying Fertilizers by Farmers
Farmers could get fertilizers easily in their villages and in Tatkon Township. Therefore, farmers bought from different sources of fertilizer dealers. As shown in the Figure 1, 50% each of farmers bought urea fertilizer from village retailers and local wholesalers in Tatkon Town. In the case of compound fertilizers, 65% of sample farmers purchased from village retailers whereas 35% of them purchased from local wholesalers.
Two types of transactions occurred in purchasing fertilizers by farmers in the study area. In the case of urea fertilizer, 50% of farmers bought in cash down transaction type and the rest 50% purchased by credit system transaction. About 40% of farmers bought compound fertilizers in cash down system and the rest 60% of them used credit system (Fig. 2). Credit-based system transaction had an interest rate of 5 % per month. Even though the price of fertilizers using the credit system was higher than cash down system, most farmers chose buying fertilizers with credit system probably due to lack of capital for fertilizer demand.
Fig. 1. Sources of fertilizer suppliers for sample farmers
Fig. 2. Types of buying fertilizers by sample farmers
Marketing Channels of Fertilizer in Tatkon Township
Marketing channels are set of interdependent organizations involved in the process of making a product or service available for use (Kolter, 2003). Fertilizer marketing channels were observed for understanding the commodity flow from other markets or company agents to market intermediaries and to final user farmers. Figure 3 showed the fertilizer marketing channels in the study area. There were three main marketing channels of fertilizer in Tatkon Township. The fertilizer marketing channel (1) was the major channel and marketing the largest amount of fertilizers which flowed from other markets (Mandalay, Yangon and Myingyan) and company agents to local wholesalers and resold to final user farmers. In addition, local wholesalers sold to village retailers and then to end user farmers. Another way, retailers in Tatkon Township also purchased from local wholesalers and then traded to farmers. In this channel local wholesalers were the main players and had market power. In the fertilizer marketing channel (2), fertilizers flowed from other markets and company agents directly to village retailers and are then sold to the farmers. Compared to channel (1) and (2), the marketing channel (3) was marketing the lowest amounts of fertilizers which reached only directly from company agents and then to local wholesalers and village retailers and finally, to farmers. Therefore, among these three marketing channels, channel (1) which had more market participants, were selected for calculating the marketing margin, cost and profit of fertilizer marketing in the study area.
Fig. 3. Marketing channels of fertilizers in Tatkon Township
Marketing Margin, Cost and Profit of Fertilizer Market
Marketing margins is defined as the price of a collection of marketing services which is the outcome of the demand for and the supply of such services. The amount can be interpreted as the cost of providing a mix of marketing services (Tomek and Robison, 1981).
In the first channel, urea, Armo and Golden Lion fertilizers from Mandalay market were calculated to investigate costs and profits of local wholesalers along the fertilizer market in the study area. Total marketing cost (transportation and labor cost) of urea, Armo and Golden Lion were 3.23%, 3.47% and 2.47% of farmgate price, respectively. Average profits of local wholesalers were 3.23% in urea, 8.38% in Armo and 7.82% of farmgate price in Golden Lion. Therefore, local wholesalers obtained the average profit for Armo was relatively higher than that of profit for urea and Golden Lion fertilizers in the study area. Awba and Kie Mie Yar compound fertilizers flowed to local wholesalers from Yangon market. According to this figure, average profit for Awba (3.16%) was rather higher than that of Kie Mie Yar (1.17%) which was occupied by local wholesalers. For Myingyan market, the average profit of Lu Yine Khaung (11.32%) was higher than that of Butterfly profit (9.09%) which was occupied by local wholesalers (Fig. 4).
Fig. 4. Marketing costs and profits of local wholesalers in channel (1)
Conclusion and Policy Implication
The fertilizer supply chain was well composed of four main market intermediaries: local wholesalers; village retailers; company agents; and farmers. In the fertilizer market structure, Mandalay market was the key player for the distribution of imported urea fertilizer from China and domestically produced urea as local market participants such as local wholesalers and village retailers mainly relied on this market. Therefore, the means to promote the commodity (fertilizers) flow in the Mandalay market is through reduction of transportation cost or relaxation of some restrictions on trade. These will enhance the fertilizer market access by the market participants or end users, farmers. On the other hand, the monitoring or evaluation on the holding market power by the Mandalay market needs to be assessed in order to prevent market distortion by misconducting of big dealers in Mandalay market or to secure the consumers’ rights especially end users, farmers.
Among the imported (registered) urea fertilizers, local trading brand, Shwe Taung occupied a large share of local wholesalers and village retailers' sales. Although imported compound fertilizers were accessible in the study area, urea fertilizers were largely utilized by farmers. They should be trained to use appropriate and balanced fertilizer application to conserve poor soil condition. Two unregistered compound fertilizers from Myingyan market namely Butterfly and Lu Yine Khaung were also marketed by most local wholesalers and some village retailers in the study area. The marketed amount of unregistered compound fertilizers was the lowest compared to urea and compound fertilizers in the study area. Marketing of registered and unregistered compound fertilizers in Myanmar and its nutrient content should be regulated.
Domestically produced urea was not popular in the local market because of its inconsistent granule type, easily solvent and improper packaging. The constraints of domestic fertilizer production and marketing should be explored. Enhancing domestically produced fertilizers can fulfill the local demand of fertilizers and provide affordable prices to the farmer. Therefore, local urea fertilizer production should be promoted by solving problems particularly related with quality competitiveness. Additionally, rules and regulations to ensure competitive practices should be taken into account.
In addition, the fertilizer market participants did not have enough capital for fertilizer marketing including the endusers-the farmers. As the local traders are marketing fertilizers with credit system, it is essential to provide loans which can reduce the transaction costs not only for market intermediaries but also for farmers.
The imported registered urea and compound fertilizer products were purchased from Mandalay and Yangon markets by the local wholesalers and village retailers. Thus, distribution system of fertilizers from wholesale markets to farmers’ field should be promoted by minimizing transaction costs. The high transportation cost in the marketing channel was one of the main obstacles in Myanmar. In addition, the fertilizer market participants did not have enough capital for fertilizer marketing including the end users. As the local traders were marketing fertilizers with credit system, it is essential to provide loans which can reduce the transaction costs not only for market intermediaries but also for endusers. Efficient market information system is the main stream for the whole development of the marketing channel. The government should pay attention to the development of fertilizer distribution system by enhancing the knowledge of intermediaries through marketing extension services. Therefore, the government authorities should link to investors in the fertilizer sector so that the efficiency of agricultural sector in Myanmar can improve significantly.
References
CSO (Central Statistical Organization). 2011. Myanmar Agricultural Statistics (1997-2011). Ministry of National Planning and Economic Development (MNPED), Myanmar.
DoA (Department of Agriculture). 2014. Reports Documents, Tatkon Township, Nay Pyi Taw.
en.trend.az/capital/business/1386274.html.
FAOSTAT, online database.
Hnin Yu Lwin et al. 2013. Role of Fertilizer Policy in Transforming Agriculture of Myanmar. Resakss Asia, Facilitated by International Food Policy Research Institute (IFPRI). Washington, DC.
Kotler, P. 2003. Marketing Management, 11th edition. Upper Saddle River, NJ: Prentice Hall International.
MOAI (Ministry of Agricultural and Irrigation). 2008. Usage of Fertilizer. Special Report.
MOAI (Ministry of Agricultural and Irrigation). 2014. Agricultural at a Glance, Myanmar.
Tin Maung Shwe 2011. Agriculture Development Issues and Strategies, Myanmar.
Tomek, G. W. and K. L. Robinson 1981. Agricultural Product Prices. Ithaca. NY. Cornell University Press.
Date submitted: Feb. 8, 2017
Reviewed, edited and uploaded: Feb. 10, 2017