INTRODUCTION
The Food Law No.18/2012 emphasizes that the state has an obligation to secure the availability and access, to adequate, balanced, safe, and nutritious food consumption at the national, regional, and individual levels in all regions of the country by utilizing local resources, institutions and culture. The Law strongly mentions that the state should pursue food sovereigneity and food self reliance. Consequently, food import is only allowed when domestic production cannot meet domestic consumption or the commodity on demand is not produced in the country.
In response to the political message mandated in the Law, the current administration of President and Vice President Joko Widodo-Jusuf Kala include food sovereignity as one element of their political agenda called Nawa Cita (Nine Development Agendas). This agenda is translated into policy and program to achieve self sufficiency on strategic commodities within three years (2015-2017). Based on the directive of the President, the Ministry of Agriculture (MoA) has decided to achieve self sufficiency on five strategic commodities, namely rice, maize, soybean, sugar, and beef cattle. Self sufficiency on rice, maize, and soybean is targeted to be achieved in 2017, whereas the other commodies are not specifically mentioned. Among the five commodities, rice always attracts the primary attention in terms of policy debate and priority of public spending.
The purpose of this brief is to highlight the policy framework in achieving self sufficiency on those commodities as interim objective to strengthen food security.
Current status on production of the strategic commodities
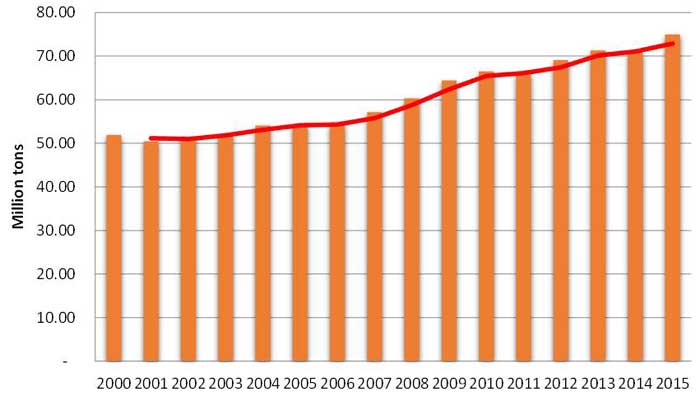
Rice. Rice production has grown at a rate of 1.7 %/year during 2000-2015, which was due to growth on harvested areas (Fig. 1). After a modest decline in 2014, rice production showed an impressive growth of 6.5% in 2015 which was due to 2.2% growth of planted area and 3.9% growth of yield. An exceptional growth of rice production in 2015 was partly the result of relatively high support to this sector, which will be discussed in the latter part of the brief. Productivity of rice has been recorded at around 5.3 mt/ha in 2015. This fig. was higher than that of Thailand and the Philippines, but lower than that of China and Vietnam. The last two countries have adopted hybrid rice extensively, whereas in Indonesia, this type of rice is still at its developmental early stage.
Accelerated growth of planted area to rice has caused negative impact to the growth of other staples, particularly, maize, and soybean, because the total arable land is relatively constant. According to Hermanto (2015) the share of planted area to rice has increased from 65% in 1994 to 72% in 2004. This indicates much higher incentive for the farmers to plant rice compared to other staples.
Regional distribution of rice production showed a declining share in Java from 48.3% in 1994 to 46.4% in 2014. Similar trend was also observed on the share of planted area in Sumatra which declined from 26.0% in 1994 to 25.1% in 2014. Contrarily, the share of planted area in Sulawesi has increased from 10.4% in 1994 to 12.3% in 2014. Furthermore, the share of rice area in other regions of the country was relatively constant during that period.
Despite strong growth in rice production, Indonesia still imports rice, particularly to secure government reserve for price stabilization policy. Average quantity of import during normal years is around 508,900 tons. However, in the events like severe drought or economic crises, the volume of rice import skyrocketed to 1.4 million tons in 2007 and 2.7 million tons in 2011.
Fig. 1. Indonesia’s rice production trend, 2000-2015.
Maize. Among the staple foods, maize farms can be considered as the most profitable one. During 2000-2015 maize production has shown an impressive growth, i.e.5.4%/annum (Fig. 2). The growth on maize production was even much higher during 2006-2010, at 11.5%/annum. The primary sources of production growth was the growth on productivity.
The driver of growth on maize production can be traced from both demand and supply. On the demand side, maize market benefits from accelerated growth of the livestock sector. Since maize is the main ingredient in livestock feed, massive development of the livestock sector stimulates strong growth in maize production. On the supply side, significant growth of maize production is also due to technology advancement, particularly the application of hybrid maize which has higher productivity. The maize seed industry is now dominated by a multinational company that produces hybrid maize.
Similar to rice, despite the strong growth of domestic maize production, Indonesia still imports maize in the amount of around 1.5-3.3 million tons during 2010-2014.
Soybean. In contrast to the case of maize, development of soybean production is more problematic. During 2000-2015, the average growth of soybean production was only 1.1%/annum (Fig. 3). The growth is mostly due to its productivity, but the harvested area is declining. Relatively low growth of soybean production can be explained by both technical as well as economic aspects. On the technical side, as a crop, soybean is considered not fully adjusted to Indonesia’s trophical climate and it is considered a high risk crop, particularly due to pests/disease infestations. On the economic side, soybean is also considered less profitable compared to rice and maize. Lower price of imported soybean accentuate the incompetitiveness of this crop.
Approximately 70% of soybean consumption is supplied from imports, which reached 1.7-2.1 million tons in 2010-2014. It is necessary to note that soybean is both used for animal feed and as processed food for human consumption.
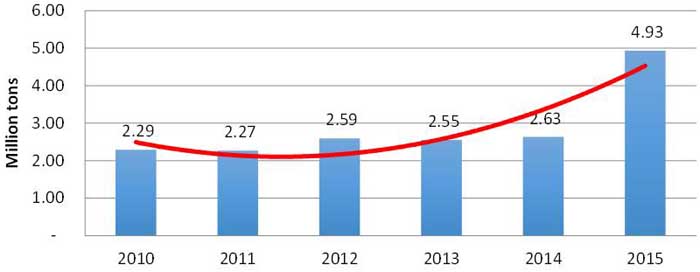
Sugar. During 2010-2015 sugar production has accelerated at the rate of 3.6%/annum. However domestic sugar production cannot meet increasing demand for both human consumption and food processing industry. Indonesia imported 2.0-3.4 million tons of raw and white sugar from 2010-2014. Sugar cane is mostly grown by smalholder farm and state owned enterprises. One of the issue is declining sugar to cane ratio due to obsolete sugar factory.
Fig. 2. Indonesia’s maize production trend, 2000-2015.
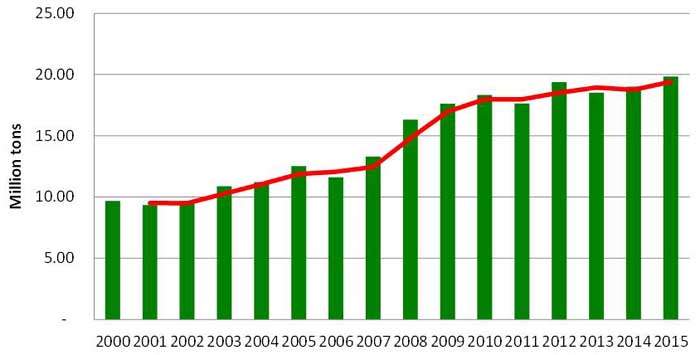
Fig. 3. Indonesia’s soybean production trend, 2000-2015.
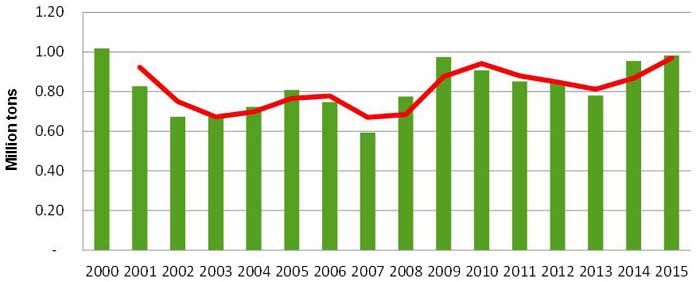
Fig. 4. Indonesia’s sugar production trend, 2010-2015.
Beef cattle. The issue on beef cattle production always attracts public interst due to frequently accelerated beef price at the retail level, particularly during national holiday season such as Eid Festival. From 2010-2011 beef price was fairly stable, at Rp.66,300-69,700 (US$ 7.7-7.8)/kg and registered a a 5.3% growth However, in 2012, beef price started to accelerate to Rp.76,9000 (US$ 7.9)/kg, or a growth of 10.3%. In 2013, beef price reached a peak to Rp.90,900 thousand (US$ 7.4)/kg or an increase of 17.5% compared to that of the previous year. In 2014, the price started to increase at a lower rate (9.9%) to Rp.99,300 (US$ 7.9)/kg. The urgency to accelerate beef production is also motivated by currently low beef consumption, at around 2.4 kg/capita/annum.
From 2011-2015, the population of beef cattle fluctuated around 12.7-15.9 million heads (Table 1). According to the Central Bureau of Statistics (2015), around 66.3% of households who are engaged in livestock production are smallholders with only 1-2 heads/household. Due to the shortage of domestic beef production, in order to meet the increasing demand, Indonesia relies on the import market. Import quantity of both live animals and boxed meat fluctuates overtime reflecting variable import policy. The highest import recorded was in 2010 and 2014 in the amount of 350,800 and 351,7 00 tons respectively. The composition of imports indicated that the larger share was in terms of live animals (65.3% on average). This policy is intended to promote value addition in the domestic market, particularly for the smallholders.
Table 1. Indonesia’s trend of beef cattle population and imports
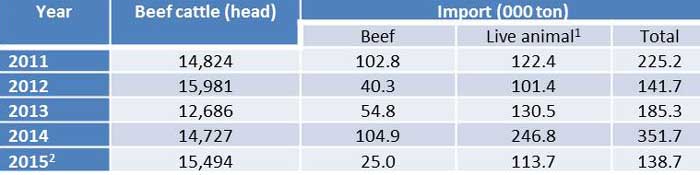
1Beef equivalent; 2 January-August 2015
Policy to promote self-sufficiency
To achieve self sufficiency on staple food, the government has implemented a comprehensive policy measures which consist of: investment on infrastructures, application of new technologies, price and trade, input subsidy, and credit provision. The policy to promote production of rice, maize, and soybean is almost similar, but the policy related to sugar and beef cattle are slightly different. The following discussion is particularly related to food crops (rice, maize, and soybean) unless otherwise stated.
- Investment on infrastructures
Irrigation network is the most important infrastructure that will accelerate rice production. It is reported that roughly 55% of irrigation infrastructures is damaged due to poor maintenance. Responding to this problem, the government put priority on rehabilitation of irrigation network and building new infrastructues such as dams and reservoirs. In 2015 irrigation infrastructures serving 1.6 million hectares of paddy field was built or rehabilitated. This is approximately 52% of the targeted 3 million hectares of paddy field during 2015-2019 period. The cost of this investment is approximately Rp. 10.2 trillion (US$ 755.6 million). In addition to irrigation, the MoA also promote the use of mechanical equipment to increase production efficiency and reduce cost. In 2015, the MoA has delivered 26,100 units of tractors, 5,563 units of transplanters, and 2,790 units of combined harvesters. These equipment were delivered and will be managed by farmer groups, particularly in major rice producing regions.
- Application of new technologies
New technology is the key driver that will accelerate productivity growth of staple foods. Integrated Crop Management (ICM), particularly for rice, which consists of improved varieties, land preparation, balanced fertilizers, integrated pest management, and post harvest handling is widely disseminated. Demonstration sites to disseminate this technology are established in all crop producing regions, facilitated by scientists and extension specialists. To enhance coordination among stakeholders and facilitate farmers to do farming according to the recommended practices, the MoA also mobilized a large number of people, namely: senior officers and staff of MoA from the head quarter office, 51,000 of military army, 8,600 agricultural college students, and 25,400 agricultural extention specialists. There has been some criticism to this approach, particularly on its impact to local wisdom and in=nitiatives. Furthermore, there is also a question regarding to what extent this approach can contribute to achieve a sustainable production system.
- Price and trade
To ensure sufficient incentive for the farmers, the government determines procurement price for rice higher than the world market price. The procurement price serves as a reference for BULOG (state own enterprise) to buy rice from the farmers. Even though BULOG only procures around 5% of the total rice production, this scheme has influenced the market price to move upward than otherwise. According to Erwidodo (2015), the market price of both paddy and rice were always well above the procurement price. On the other hand, this situation makes BULOG in a difficult position because by regulation, if the market price is already higher than the stated procurement price then this agency cannot procure rice from the domestic market.
The stock of rice procured by BULOG is used for two purposes: (a) sell rice at the subsidized price to poor families through RASKIN ( rice for the poor) program; (b) open market operation to stabilize rice price at the retail level if the price has reached a certain level. In 2015, the procurement price was set at Rp.4 650/kg (US $ 0.34/kg) for dried paddy and Rp.7 300/kg (US $ 0.54/kg) for milled rice.
The similar principles are also established for farmgate price of soybean and sugar cane. In the case of sugar, the procurement price serves as a reference for sugar factory to buy sugar cane from the farmers. However, in the case of soybean, the policy is not implemented well because BULOG does not receive sufficient budget to do the task.
As an integral part of price stabilization policy, in 2015 through the RASKIN program BULOG distributed 2.7 million mt of rice to 15.5 million poor households. Every household receives 15 kg rice/month with 87.8 % subsidy. The expenses for this subsidy in 2015 was approximately US$ 1.4 billion. The has been some criticism about this policy, particularly those related to poor quality of rice, its impact to the local rice market, and leakage of rice to non-targeted households.
To complement the role of BULOG in stabilizing rice price at the farm level, in 2015 the MoA established Toko Tani Indonesia (Indonesian Farmer’s Shop) to buy agriculture products (include rice) directly from the farmers. That same year, 36 shops were established, and in 2016, it is expected that there will be 1000 more shops established around the country.
To depend on price around the procurement price, import is directlly controled by the government. Every year the government decides whether import is needed or not, and if so at what quantity. This mechanism is followed for all five strategic commodities. The imports of medium quality rice is implemented exclusively by BULOG, whereas imports of maize, soybean, sugar and live animals or beef are shared between BULOG and the private sector importer. Some analysts argue that tight import control policy has significant impact to accelerated price in the domestic market.
- Input subsidy
To accelerate productivity growth, particularly for staple foods, the application of modern inputs such as fertilizers is essential. In promoting the application of fertilizers by smallholders the government provides subsidy, so that the farmers may buy fertilizers at affordable prices (exclusively for farmers operating less than two hectares of land). The subsidy is given indirectly to fertilizer manufacturers, which then sell the fertilizers to the farmers at a lower price. Before the beginning of the planting season, the MoA issues a decree on the estimated demand for different types of fertilizers by provinces along with the reference price of fertilizers at the retail level. Based on this information, the Governor of the corresponding provinces breaks down demand for fertilizer in every district. The decree also serves as a reference for the fertilizer companies to distribute fertilizers in the corresponding regions.
In 2016, the demand for fertilizers is estimated at around 4.1 million mt of nitrogen (Urea), 850,000 mt of phosphate (SP-36), 1.1 million mt of Zinc Ammonia (ZA), 2.6 million mt of compound fertilizers (NPK), and 1.1 million mt of organic fertilizers. The reference retail prices of those fertilizers are: US$ 0.14/kg for Urea, US$ 0.15/kg for SP-36, US$ 0.11/kg for ZA, US$ 0.17/kg for NPK, and US$ 0.04/kg for organic fertilizer. In 2015, total expenditure for fertilizer subsidy was around US$ 2.3 billion. According to OECD (2012), expenditure on fertilizer subsidy is accounted for about 37% of the total budgetary support for agriculture in 2006-2010.
Similar subsidy scheme is also used for the seeds of rice, maize, and soybean. The seeds are produced by state own enterprises (PT Sang Hyang Sri and PT Pertani) in collaboration with selected farmers. In 2015 the government spent US$ 68.1 million to finance seed subsidy for these crops.
- Credit provision
One of the major constraints faced by smallholder farmers is limited working capital to finance operational costs of farming. In addition, they also have limited access to financial services offered by commercial banks. In response to this problem, the government launched a credit program for food security purposes at the subsidized interest rate. In addition to the program launched by the central government, some members of local government also delivered a similar program in view of reaching as many farmers as possible. In 2015, the amount of subsidy on interest rate was US$ 14.7 million. However, some reports claim that the credit facility is not fully used by the farmers, due to the administrative constraints.
- Spesific measures related to beef cattle
Livestock sector development program beginning in 2014 has been focusing on six main action plans carried out by the Directorate General of Livestock and Animal Health Services (DGLAHS), MoA.. These action plans include (;
- Infrastructure development which targets to: (a) establish 74 slaughter houses in both production and consumption areas, (b) three sea ports and 18 units of loading and unloading facilities at producers and destination ports, (c) four livestock vessels compliant to animal welfare criteria, and (d) 800 units of ground water facilities around the country.
- Regulation which targets (a) issuing updated regulation on prohibition of slaughtering productive cows, (b) updated regulation on reduction of import duties for productive cows,.
- Livestock production which targets improvement in calf crop from both Artificial Insemination and Natural Mating programs to 3.2 million heads.
- Integration systems which targets to: (a) increasing number of beef cattle population to 100,000 heads in the palm oil plantation areas, and (b) effective utilization of 164,000 hectares of grazing land.
- Improving 990 livestock farmers for their knowledge and skills, and (6) Improving proven bulls quality for national Artificial Insemination centers.
CONCLUSION
In the short run, the new set of policy to achieve self sufficiency, particularly on rice production seems to be highly successfull. However, more fundamental issues related to food crop production system remain unresolved, namely: (a) excessive public resources spent on the sector create missallocation of resources and inefficient production system; (b) despite large government support, farmers do not receive reliable income from the food crop sector; (c) heavy emphasis on these sector discourages diversification toward higher value commodities such as vegetables, fruits, and livestock products; (d) relatively high price at the retail level, reduce access of poor household (many of them are also smallholder farmers) to sufficient nutrient intake.
To achive a modern, sustainable, and resilient food production system, we need policy reform on the following areas: (i) accelerate productivity growth and better quality by means of technology innovations; (b) put emphasis on down stream segments of food crop value chain to generate value added and open up new income opportunities in the off-farm sector; (c) build resilience of the sector to anticipate and cope with climate change and other natural as well as economic shock; (d) reform on government spending policy from subsidy toward higher spending on general services such as research and development, training andextension, standards and certification, natural resource conservation, and market promotion.
REFERENCES
Erwidodo. 2015. “Government Supports and Incentives Toward Realizing Self-Reliance Food
Security”, in E.Pasandaran (eds).”Toward a Sustainable Food Resilience in Indonesia”. Indonesian Agency for Agricultural Research and Development, Jakarta.
Hermanto. 2015. “Source of Major Food Crops Production in Indonesia”, in E.Pasandaran
(eds).”Toward a Sustainable Food Resilience in Indonesia”.
Indonesian Center for Animal Research and Development. 2016. “Policy of Improving Domestic Red
Meat Production in Indonesia through Acceleration of Palm Oil-Cattle and Palm Oil-Sheep Integrated Production System”. Background paper for FAO TCP/RAS/3507 on Building Policy Capacity for Sustainable Livestock Development. Agency for Agricultural Research and Development, Bogor.
|
Date submitted: Sept. 17, 2016
Reviewed, edited and uploaded: Sept. 19, 2016
|

Government Policy on Self Sufficiency to Achieve Food Security in Indonesia
INTRODUCTION
The Food Law No.18/2012 emphasizes that the state has an obligation to secure the availability and access, to adequate, balanced, safe, and nutritious food consumption at the national, regional, and individual levels in all regions of the country by utilizing local resources, institutions and culture. The Law strongly mentions that the state should pursue food sovereigneity and food self reliance. Consequently, food import is only allowed when domestic production cannot meet domestic consumption or the commodity on demand is not produced in the country.
In response to the political message mandated in the Law, the current administration of President and Vice President Joko Widodo-Jusuf Kala include food sovereignity as one element of their political agenda called Nawa Cita (Nine Development Agendas). This agenda is translated into policy and program to achieve self sufficiency on strategic commodities within three years (2015-2017). Based on the directive of the President, the Ministry of Agriculture (MoA) has decided to achieve self sufficiency on five strategic commodities, namely rice, maize, soybean, sugar, and beef cattle. Self sufficiency on rice, maize, and soybean is targeted to be achieved in 2017, whereas the other commodies are not specifically mentioned. Among the five commodities, rice always attracts the primary attention in terms of policy debate and priority of public spending.
The purpose of this brief is to highlight the policy framework in achieving self sufficiency on those commodities as interim objective to strengthen food security.
Current status on production of the strategic commodities
Rice. Rice production has grown at a rate of 1.7 %/year during 2000-2015, which was due to growth on harvested areas (Fig. 1). After a modest decline in 2014, rice production showed an impressive growth of 6.5% in 2015 which was due to 2.2% growth of planted area and 3.9% growth of yield. An exceptional growth of rice production in 2015 was partly the result of relatively high support to this sector, which will be discussed in the latter part of the brief. Productivity of rice has been recorded at around 5.3 mt/ha in 2015. This fig. was higher than that of Thailand and the Philippines, but lower than that of China and Vietnam. The last two countries have adopted hybrid rice extensively, whereas in Indonesia, this type of rice is still at its developmental early stage.
Accelerated growth of planted area to rice has caused negative impact to the growth of other staples, particularly, maize, and soybean, because the total arable land is relatively constant. According to Hermanto (2015) the share of planted area to rice has increased from 65% in 1994 to 72% in 2004. This indicates much higher incentive for the farmers to plant rice compared to other staples.
Regional distribution of rice production showed a declining share in Java from 48.3% in 1994 to 46.4% in 2014. Similar trend was also observed on the share of planted area in Sumatra which declined from 26.0% in 1994 to 25.1% in 2014. Contrarily, the share of planted area in Sulawesi has increased from 10.4% in 1994 to 12.3% in 2014. Furthermore, the share of rice area in other regions of the country was relatively constant during that period.
Despite strong growth in rice production, Indonesia still imports rice, particularly to secure government reserve for price stabilization policy. Average quantity of import during normal years is around 508,900 tons. However, in the events like severe drought or economic crises, the volume of rice import skyrocketed to 1.4 million tons in 2007 and 2.7 million tons in 2011.
Fig. 1. Indonesia’s rice production trend, 2000-2015.
Maize. Among the staple foods, maize farms can be considered as the most profitable one. During 2000-2015 maize production has shown an impressive growth, i.e.5.4%/annum (Fig. 2). The growth on maize production was even much higher during 2006-2010, at 11.5%/annum. The primary sources of production growth was the growth on productivity.
The driver of growth on maize production can be traced from both demand and supply. On the demand side, maize market benefits from accelerated growth of the livestock sector. Since maize is the main ingredient in livestock feed, massive development of the livestock sector stimulates strong growth in maize production. On the supply side, significant growth of maize production is also due to technology advancement, particularly the application of hybrid maize which has higher productivity. The maize seed industry is now dominated by a multinational company that produces hybrid maize.
Similar to rice, despite the strong growth of domestic maize production, Indonesia still imports maize in the amount of around 1.5-3.3 million tons during 2010-2014.
Soybean. In contrast to the case of maize, development of soybean production is more problematic. During 2000-2015, the average growth of soybean production was only 1.1%/annum (Fig. 3). The growth is mostly due to its productivity, but the harvested area is declining. Relatively low growth of soybean production can be explained by both technical as well as economic aspects. On the technical side, as a crop, soybean is considered not fully adjusted to Indonesia’s trophical climate and it is considered a high risk crop, particularly due to pests/disease infestations. On the economic side, soybean is also considered less profitable compared to rice and maize. Lower price of imported soybean accentuate the incompetitiveness of this crop.
Approximately 70% of soybean consumption is supplied from imports, which reached 1.7-2.1 million tons in 2010-2014. It is necessary to note that soybean is both used for animal feed and as processed food for human consumption.
Sugar. During 2010-2015 sugar production has accelerated at the rate of 3.6%/annum. However domestic sugar production cannot meet increasing demand for both human consumption and food processing industry. Indonesia imported 2.0-3.4 million tons of raw and white sugar from 2010-2014. Sugar cane is mostly grown by smalholder farm and state owned enterprises. One of the issue is declining sugar to cane ratio due to obsolete sugar factory.
Fig. 2. Indonesia’s maize production trend, 2000-2015.
Fig. 3. Indonesia’s soybean production trend, 2000-2015.
Fig. 4. Indonesia’s sugar production trend, 2010-2015.
Beef cattle. The issue on beef cattle production always attracts public interst due to frequently accelerated beef price at the retail level, particularly during national holiday season such as Eid Festival. From 2010-2011 beef price was fairly stable, at Rp.66,300-69,700 (US$ 7.7-7.8)/kg and registered a a 5.3% growth However, in 2012, beef price started to accelerate to Rp.76,9000 (US$ 7.9)/kg, or a growth of 10.3%. In 2013, beef price reached a peak to Rp.90,900 thousand (US$ 7.4)/kg or an increase of 17.5% compared to that of the previous year. In 2014, the price started to increase at a lower rate (9.9%) to Rp.99,300 (US$ 7.9)/kg. The urgency to accelerate beef production is also motivated by currently low beef consumption, at around 2.4 kg/capita/annum.
From 2011-2015, the population of beef cattle fluctuated around 12.7-15.9 million heads (Table 1). According to the Central Bureau of Statistics (2015), around 66.3% of households who are engaged in livestock production are smallholders with only 1-2 heads/household. Due to the shortage of domestic beef production, in order to meet the increasing demand, Indonesia relies on the import market. Import quantity of both live animals and boxed meat fluctuates overtime reflecting variable import policy. The highest import recorded was in 2010 and 2014 in the amount of 350,800 and 351,7 00 tons respectively. The composition of imports indicated that the larger share was in terms of live animals (65.3% on average). This policy is intended to promote value addition in the domestic market, particularly for the smallholders.
Table 1. Indonesia’s trend of beef cattle population and imports
1Beef equivalent; 2 January-August 2015
Policy to promote self-sufficiency
To achieve self sufficiency on staple food, the government has implemented a comprehensive policy measures which consist of: investment on infrastructures, application of new technologies, price and trade, input subsidy, and credit provision. The policy to promote production of rice, maize, and soybean is almost similar, but the policy related to sugar and beef cattle are slightly different. The following discussion is particularly related to food crops (rice, maize, and soybean) unless otherwise stated.
Irrigation network is the most important infrastructure that will accelerate rice production. It is reported that roughly 55% of irrigation infrastructures is damaged due to poor maintenance. Responding to this problem, the government put priority on rehabilitation of irrigation network and building new infrastructues such as dams and reservoirs. In 2015 irrigation infrastructures serving 1.6 million hectares of paddy field was built or rehabilitated. This is approximately 52% of the targeted 3 million hectares of paddy field during 2015-2019 period. The cost of this investment is approximately Rp. 10.2 trillion (US$ 755.6 million). In addition to irrigation, the MoA also promote the use of mechanical equipment to increase production efficiency and reduce cost. In 2015, the MoA has delivered 26,100 units of tractors, 5,563 units of transplanters, and 2,790 units of combined harvesters. These equipment were delivered and will be managed by farmer groups, particularly in major rice producing regions.
New technology is the key driver that will accelerate productivity growth of staple foods. Integrated Crop Management (ICM), particularly for rice, which consists of improved varieties, land preparation, balanced fertilizers, integrated pest management, and post harvest handling is widely disseminated. Demonstration sites to disseminate this technology are established in all crop producing regions, facilitated by scientists and extension specialists. To enhance coordination among stakeholders and facilitate farmers to do farming according to the recommended practices, the MoA also mobilized a large number of people, namely: senior officers and staff of MoA from the head quarter office, 51,000 of military army, 8,600 agricultural college students, and 25,400 agricultural extention specialists. There has been some criticism to this approach, particularly on its impact to local wisdom and in=nitiatives. Furthermore, there is also a question regarding to what extent this approach can contribute to achieve a sustainable production system.
To ensure sufficient incentive for the farmers, the government determines procurement price for rice higher than the world market price. The procurement price serves as a reference for BULOG (state own enterprise) to buy rice from the farmers. Even though BULOG only procures around 5% of the total rice production, this scheme has influenced the market price to move upward than otherwise. According to Erwidodo (2015), the market price of both paddy and rice were always well above the procurement price. On the other hand, this situation makes BULOG in a difficult position because by regulation, if the market price is already higher than the stated procurement price then this agency cannot procure rice from the domestic market.
The stock of rice procured by BULOG is used for two purposes: (a) sell rice at the subsidized price to poor families through RASKIN ( rice for the poor) program; (b) open market operation to stabilize rice price at the retail level if the price has reached a certain level. In 2015, the procurement price was set at Rp.4 650/kg (US $ 0.34/kg) for dried paddy and Rp.7 300/kg (US $ 0.54/kg) for milled rice.
The similar principles are also established for farmgate price of soybean and sugar cane. In the case of sugar, the procurement price serves as a reference for sugar factory to buy sugar cane from the farmers. However, in the case of soybean, the policy is not implemented well because BULOG does not receive sufficient budget to do the task.
As an integral part of price stabilization policy, in 2015 through the RASKIN program BULOG distributed 2.7 million mt of rice to 15.5 million poor households. Every household receives 15 kg rice/month with 87.8 % subsidy. The expenses for this subsidy in 2015 was approximately US$ 1.4 billion. The has been some criticism about this policy, particularly those related to poor quality of rice, its impact to the local rice market, and leakage of rice to non-targeted households.
To complement the role of BULOG in stabilizing rice price at the farm level, in 2015 the MoA established Toko Tani Indonesia (Indonesian Farmer’s Shop) to buy agriculture products (include rice) directly from the farmers. That same year, 36 shops were established, and in 2016, it is expected that there will be 1000 more shops established around the country.
To depend on price around the procurement price, import is directlly controled by the government. Every year the government decides whether import is needed or not, and if so at what quantity. This mechanism is followed for all five strategic commodities. The imports of medium quality rice is implemented exclusively by BULOG, whereas imports of maize, soybean, sugar and live animals or beef are shared between BULOG and the private sector importer. Some analysts argue that tight import control policy has significant impact to accelerated price in the domestic market.
To accelerate productivity growth, particularly for staple foods, the application of modern inputs such as fertilizers is essential. In promoting the application of fertilizers by smallholders the government provides subsidy, so that the farmers may buy fertilizers at affordable prices (exclusively for farmers operating less than two hectares of land). The subsidy is given indirectly to fertilizer manufacturers, which then sell the fertilizers to the farmers at a lower price. Before the beginning of the planting season, the MoA issues a decree on the estimated demand for different types of fertilizers by provinces along with the reference price of fertilizers at the retail level. Based on this information, the Governor of the corresponding provinces breaks down demand for fertilizer in every district. The decree also serves as a reference for the fertilizer companies to distribute fertilizers in the corresponding regions.
In 2016, the demand for fertilizers is estimated at around 4.1 million mt of nitrogen (Urea), 850,000 mt of phosphate (SP-36), 1.1 million mt of Zinc Ammonia (ZA), 2.6 million mt of compound fertilizers (NPK), and 1.1 million mt of organic fertilizers. The reference retail prices of those fertilizers are: US$ 0.14/kg for Urea, US$ 0.15/kg for SP-36, US$ 0.11/kg for ZA, US$ 0.17/kg for NPK, and US$ 0.04/kg for organic fertilizer. In 2015, total expenditure for fertilizer subsidy was around US$ 2.3 billion. According to OECD (2012), expenditure on fertilizer subsidy is accounted for about 37% of the total budgetary support for agriculture in 2006-2010.
Similar subsidy scheme is also used for the seeds of rice, maize, and soybean. The seeds are produced by state own enterprises (PT Sang Hyang Sri and PT Pertani) in collaboration with selected farmers. In 2015 the government spent US$ 68.1 million to finance seed subsidy for these crops.
One of the major constraints faced by smallholder farmers is limited working capital to finance operational costs of farming. In addition, they also have limited access to financial services offered by commercial banks. In response to this problem, the government launched a credit program for food security purposes at the subsidized interest rate. In addition to the program launched by the central government, some members of local government also delivered a similar program in view of reaching as many farmers as possible. In 2015, the amount of subsidy on interest rate was US$ 14.7 million. However, some reports claim that the credit facility is not fully used by the farmers, due to the administrative constraints.
Livestock sector development program beginning in 2014 has been focusing on six main action plans carried out by the Directorate General of Livestock and Animal Health Services (DGLAHS), MoA.. These action plans include (;
CONCLUSION
In the short run, the new set of policy to achieve self sufficiency, particularly on rice production seems to be highly successfull. However, more fundamental issues related to food crop production system remain unresolved, namely: (a) excessive public resources spent on the sector create missallocation of resources and inefficient production system; (b) despite large government support, farmers do not receive reliable income from the food crop sector; (c) heavy emphasis on these sector discourages diversification toward higher value commodities such as vegetables, fruits, and livestock products; (d) relatively high price at the retail level, reduce access of poor household (many of them are also smallholder farmers) to sufficient nutrient intake.
To achive a modern, sustainable, and resilient food production system, we need policy reform on the following areas: (i) accelerate productivity growth and better quality by means of technology innovations; (b) put emphasis on down stream segments of food crop value chain to generate value added and open up new income opportunities in the off-farm sector; (c) build resilience of the sector to anticipate and cope with climate change and other natural as well as economic shock; (d) reform on government spending policy from subsidy toward higher spending on general services such as research and development, training andextension, standards and certification, natural resource conservation, and market promotion.
REFERENCES
Erwidodo. 2015. “Government Supports and Incentives Toward Realizing Self-Reliance Food
Security”, in E.Pasandaran (eds).”Toward a Sustainable Food Resilience in Indonesia”. Indonesian Agency for Agricultural Research and Development, Jakarta.
Hermanto. 2015. “Source of Major Food Crops Production in Indonesia”, in E.Pasandaran
(eds).”Toward a Sustainable Food Resilience in Indonesia”.
Indonesian Center for Animal Research and Development. 2016. “Policy of Improving Domestic Red
Meat Production in Indonesia through Acceleration of Palm Oil-Cattle and Palm Oil-Sheep Integrated Production System”. Background paper for FAO TCP/RAS/3507 on Building Policy Capacity for Sustainable Livestock Development. Agency for Agricultural Research and Development, Bogor.
Date submitted: Sept. 17, 2016
Reviewed, edited and uploaded: Sept. 19, 2016