ABSTRACT
Crop natural disaster insurance program in Korea has rapidly grown not only in quantity but in quality for 15 years since it was introduced in 2001. Number of agricultural items covered by the program was expanded from two in 2001 to 46 in 2015 and number of participating farmers increased by more than ten times from 8 thousands to 89 thousands during the period. In addition, several customized insurance products were developed reflecting various farmers’ needs on compensation levels and compensation periods. In 2015, a government sponsored crop insurance agency, like Risk Management Agency in the United States, was established in Korea. Empirical results of this paper show that crop natural disaster insurance program contributed remarkably on farm revenue stabilization and social welfare increase in Korea. Further improvement strategies are suggested as follows: review on the agricultural items with low participation rate, continuous development of insurance products reflecting various farmers’ needs, enhancement of fairness and efficiency on loss assessment, establishment of stable reinsurance system and data management system.
Key words: Crop Natural Disaster Insurance, Farm Revenue Stabilization, Social Welfare, Loss Assessment, Government Reinsurance System
INTRODUCTION
The Crop Natural Disaster Insurance (hereafter referred to as “Crop Insurance”) in Korea, introduced in 2001, has achieved rapid quantitative and qualitative growth for the last 15 years. The number of applicable items, which were only two including apple and pear in the early stage, jumped to 50 in 2016. The number of insured farm households also soared from 8,000 in 2001 to 89,000 in 2014. With the rise in the number of insured farms, the scale of government support was expanded by over 45 times in the same period. In addition to such a quantitative growth, the Crop Insurance also showed an incredible growth from the qualitative aspect. A variety of tailored products, which vary in period and level of coverage, have been developed to satisfy demands of farms, and plans for small- and medium-scale farms have also been designed. By introducing the Government Reinsurance System in 2005, the government contributed to stabilizing the insurance market. It also established the Agricultural Policy Insurance & Finance Service, the institution in charge of agricultural insurance, to reinforce the public functions of the insurance including the management of and supervision over relevant projects and the development of products.
Despite such quantitative and qualitative growth of the Crop Insurance, the assessment of how the Crop Insurance contributed to farm households, consumers and the entire society has been insufficient. In particular, a quantitative analysis of outcome was attempted in only three studies: Kim et al (2006), Choi et al (2010), and Lee et al (2013). In the first two studies, the authors analyzed the effect of the Crop Insurance on stabilizing farm household income by measuring the value at risk (VaR). Lee et al (2013) analyzed the effectiveness of the Crop Insurance based on the assessment of the budgetary project of the government. The effect of the Crop Insurance on the stabilization of farm household income was measured by the coefficient of variation (CV), while the impact of the insurance on the increase in production was analyzed by the regression analysis.
This study measures how the Crop Insurance has contributed to stabilizing the income of farm households and how much impact the reduced price due to the increase in production has on the welfare of consumers. Based on this measurement, it comprehensively assesses the contribution of the insurance to the entire society, which is a differentiated method of this kind of study. In addition to VaR and CV, which were used in the previous studies, multiple risk indices including the certainty equivalence (CE) and the risk premium (RP) are utilized in this study to measure the effect on stabilizing the income of farms. This study presents solutions for the Crop Insurance based on a quantitative analysis of the outcome. There have been multiple attempts to enhance the insurance system so far, but many still suggest improving the damage assessment, the Government Reinsurance System, and the subscription rate of insurance.
This paper is comprised of five chapters. In the second chapter, the progress and the current status of the Crop Insurance in Korea are illustrated. In the third chapter, the tangible result of the Crop Insurance projects are described, followed by the quantitative analysis of the effect on the stabilization of farm household income and the social welfare. The fourth chapter provides solutions for the Crop Insurance system, and the fifth chapter presents the summary and conclusion.
PROGRESS AND OVERVIEW OF THE CROP INSURANCE
- Progress
In Korea, the Crop Insurance was first considered for rice farming in the 1970s, but the attempt was halted due to the low demand of farm households, an enormous budget required all at once, and little damage to rice farming caused by natural disasters. However, as farm households were hit hard by Typhoon Olga in 1999, the Crop Insurance system was officially introduced for apple and pear farming in March 2001. In the early stage of the system in 2002 and 2003, Typhoon Rusa and Maemi caused a significant loss and operational hardships to private insurance companies. Accordingly, the government introduced the Government Reinsurance System in 2005 to bear the large-scale loss of private insurance companies. Since then, the number of items and areas to be insured has increased, and a growing number of farm households have received support to stabilize the management of their farms.
In recent years, the government has taken the initiative in improving the quality of the insurance system. It carried out the reform of the disaster insurance in 2013 to resolve reported issues. For instance, the ratio of the deductible became diversified with consideration for demands of farms, and the standard yield and price were adjusted to the adequate level. Several projects were designed to nurture human resources for the damage assessment and improve the process with scientific methods, while the system for producing and managing statistical data was established. In 2014, for the purpose of stabilizing the operation of the disaster insurance projects, the Government Reinsurance System was reorganized to efficiently divide the responsibilities of the private sector and the government based on the in-depth assessment of the system. In 2015, the Agricultural Policy Insurance & Finance Service (APFS) was designated as the institution in charge of the agricultural disaster insurance, to reinforce the public functions of the insurance system. The APFS designs policy insurance, manages and supervises relevant projects, and develops insurance products.
- Current Status
2.1 Insured Items and Regions
As of 2016, a total of 50 items are covered by the Crop Insurance. The category with the largest number of insured items is greenhouse crops (21), followed by fruit (10), food crops (6), special crops (4), vegetables (4), and forest products (5). Recently, the insurance started to cover agricultural facilities as well.
Insured regions vary according to the form of project. The form of project can be classified into two types: a main project and a pilot project. The former is implemented nationwide, while the latter is carried out focusing on major producing areas for a certain period of time (three years) and then switched to a main project. As of 2016, various main projects are being implemented for 32 items including apple and pear, and pilot projects are conducted for 18 items such as peach and rice.
2.2 Level of Coverage
The Crop Insurance does not cover all damages and losses caused by disasters. The system requires farm households to bear a part of the burden to create the environment where they can prepare for potential disasters on their own and to prevent moral hazard. The level of coverage is diversified, which is determined by considering the characteristics of each item and the financial capacity of each farm household. In Korea, there are five levels of coverage: 60%, 70%, 80%, 85% and 90%.
2.3 Method of Subscription
In case of crops, the insurance is subscribed by each orchard (by farmland for rice), while it is subscribed by a greenhouse complex in case of agricultural facilities and greenhouse crops. Although the Crop Insurance is currently operated in the form of the optional entry system, the minimum standard for subscription is applied depending on the item to cover farms of a certain scale. Farmland with the sum insured under USD 3,000 is excluded from the subject to be insured, and there is an additional limit to the scale of cultivation. It is because if the scale is too small, the expense is higher than the benefit for the farm, and it also makes the operation of the insurance business inefficient.
2.4 Calculation of the Premium Rate and the Government Support
Like other private insurances, the premium rate of the Crop Insurance is calculated in accordance with the Principle of Equivalence with the help of the Korea insurance Development Institute, the institution in charge of the calculation of insurance premium rates. Unlike private insurances calculated by combining the net premium and loading, the disaster insurance as a policy insurance is calculated based only on the net premium. When combining the net premium and loading, the premium rate is too high, giving a heavy burden to farm households. Accordingly, only the net premium is taken account, while loading is handled by the government and the insurer (the NongHyup Property & Casualty Insurance Co., Ltd; NHPCI). The net premium rate is adjusted every year based on the damage rate (insurance benefit/premium) of the past years.
The government supports 50% of the net premium of farm households and 100% of the operating expense of the insurer, to increase the subscription rate and alleviate the burden of the insurer. In addition, most local governments provide additional support (50% of the premium to be paid by farm households), so farm households pay only 25% of the net premium.
2.5 Risk Diversification System
NHPCI is the only insurer of the Crop Insurance System and takes the primary burden of the operation of disaster insurance. However, since there is a limit for NHPCI to bear all risks alone, domestic private insurance companies share the burden (quota share reinsurance). In case of the outbreak of a massive disaster, private insurance companies alone cannot handle risks, so they subscribe the Government Reinsurance so that the government can take the burden of such a huge disaster (Non Proportional Reinsurance).
2.6 Damage Assessment System
When any damage occurs due to disasters, farm households report to a local office of the National Agricultural Cooperative Federation (NACF). Then the local office notifies the case to NHPCI and organizes a damage assessment task force to conduct a site inspection and enter the result of the inspection on the data processing system. NHPCI selects a sample of damaged farm households (unit of land) and carries out a site investigation.
OUTCOME OF THE CROP INSURANCE
This chapter demonstrates the outcome of the Crop Insurance of the past 15 years based on the expansion of insurance projects, the qualitative enhancement of the system by reflecting demands of farms, and the effect of the insurance subscription. In particular, the effect of the insurance is analyzed by calculating the improvement of the welfare of producers (farms) first and the subsequent enhancement of the welfare of consumers with stable prices, and estimating the overall increase of social welfare in a quantitative method.
1. Expansion of Insurance Projects
The Crop Insurance started with only two items—apple and pear—in 2001 and has increased the number of applicable items to 50 by 2016. A total of 32 items are covered by the main projects implemented nationwide, and 18 items by the pilot projects in major producing areas. Such a rapid expansion of the insured items in 16 years is a noteworthy growth, which is not common even inThe Crop Insurance started with only two items—apple and pear—in 2001 and has increased the number of applicable items to 50 by 2016. A total of 32 items are covered by the main projects implemented nationwide, and 18 items by the pilot projects in major producing areas. Such a rapid expansion of the insured items in 16 years is a noteworthy growth, which is not common even in advanced countries. Now a host of farm households are enjoying benefits of the insurance.
In the early stage, the applicable items were mostly fruit, but due to various demands of farm households, a diversity of food crops, vegetables (as greenhouse crops), special crops, and even forest products are currently covered. For determining items to be insured, demand surveys of farm households are conducted at local governments first, and then the relevant items are designated as the subject to be insured. Most items that are considered insurable are currently covered by the insurance products.
As the range of insurance coverage has expanded to include other products in addition to fruits, the regions to be insured have been expanded as well. In 2012, when rice farming was expanded as the national project, a large number of farm households subscribed the Crop Insurance. As pilot projects that were proved to be stable have been switched to main projects, an increasing number of farms have joined to enjoy benefits of the insurance.
In order to increase the subscription rate, the authorities are making efforts to increase the applicable items and expand the range of coverage. In the past, five fruit items were subject only to the specific risk insurance product, which limited the coverage to typhoon, hail, freezing and frost. As the authorities realized that the range of coverage for fruits needed to be expanded as other items, they have gradually introduced the comprehensive risk insurance product to fruit items since 2013, and this product currently covers pear, sweet persimmon, apple and astringent persimmon as of 2016. Furthermore, for the purpose of encouraging the re-subscription of the existing subscribers, a range of incentives are provided to farm households with no accident record, with multiple options to choose the level of coverage.
With the increase in applicable items and the expansion of the coverage range, the number of subscribers has also been on the steady rise. As shown in Table 3-1, the number of insured farm households is 89,000 in 2014, up by more than ten times from 2001. With this growth, the government support has been expanded by over 45 times from USD 4.6 million in 2001 to USD 217.2 million in 2014.
Table 3-1. Annual Changes in the No. of Farm Households Subscribing the Crop Insurance
|
Unit: Farm household
|
|
|
2001
|
2002
|
2003
|
2004
|
2005
|
2006
|
2007
|
|
Total
|
8,055
|
18,549
|
16,480
|
24,093
|
26,328
|
27,398
|
29,145
|
|
|
2008
|
2009
|
2010
|
2011
|
2012
|
2013
|
2014
|
|
Total
|
32,538
|
45,882
|
52,738
|
67,653
|
74,983
|
95,102
|
89,033
|
|
Source: Ministry of Agriculture, Food and Rural Affairs (MAFRA).
|
The expansion of the scale of the Crop Insurance project led to the establishment of APFS in 2015 as the institution in charge of the stable management and continuous growth of the system. The institution performs public functions, including project management and supervision and product development, nurtures human resources for the damage assessment, and lays the groundwork for expanding research on the Government Reinsurance System. In 2013, the Korea Association of Agricultural and Fishery Insurance on Natural Disaster (KAFIND) was founded as the institute of managing the statistical data of the disaster insurance. The institution builds up the system of producing statistics by publishing the basic statistical data book of each type of disaster insurance and the Agricultural Insurance Yearbook.
2. Farm Management Support Considering Demands of Farms
For efficiently providing support with consideration for demands of farms, the insurance product improvement committee was organized in 2013 to reflect opinions of experts and farmers of each item in the product development process. Major improvements included the expansion of options for farms by diversifying the levels of coverage, the extension of the coverage period, the increase of standard price, the development of customized products reflecting demands of farms, and the expansion of limit on yield for subscription. As a result, the coverage levels were diversified (60%, 70%, 80%, 85%, 90%) according to the characteristics of each item, providing more options to farmers. For several items including sweet persimmon, the coverage period for damages due to freezing and frost in fall season was extended, considering that in the past the insurance period often ended too early before the completion of harvest. Moreover, with consideration for the recent price trend of each item, the standard prices of 18 items were adjusted upward (the price of apple and sweet persimmon by 10%, and that of rice by 5.6%). Furthermore, customized insurance products were developed to meet the demands of farms. For example, the special contract for grapevine was revived, and that for rice blast diseases was added. The subscription of insurance for several greenhouse crops also became available all year round. Also, in the past, the subscription of insurance was limited to farms producing less than the standard yield, but the limit was raised to include those producing up to 150% of the standard yield, addressing the complaints of thriving farms.
In 2014, the plans for small- and medium-scale farms were designed. The minimum requirement for insurance subscription for several items was eased. The requirement for subscription regarding the size of farmland of sweet potato (over 2,000 m2) was abolished, and the limit on the sum insured per farmland for corn and bean was lowered from USD 3,000 to USD 1,000. In terms of the tree damage insurance, the deductible was divided into several levels according to the scale of orchard to alleviate the burden of small farms. With these improvements in the system, the Crop Insurance has been acknowledged as an efficient method of stabilizing the management of farms.
3. Effect on the Stabilization of Farm Household Income
When disasters occur, the yield per unit decreases and the income of farms fluctuates, posing concerns for instability of farm management in the long term. Since the Crop Insurance guarantees the yield according to the contract for the damage of crops caused by natural disasters, farm households can expect to stabilize their income by subscribing the disaster insurance.
There are various methods of analyzing the effect of the Crop Insurance on stabilizing farm household income. This study calculates multiple risk indices, including the coefficient of variation (CV), the value at risk (VaR), the certainty equivalence (CE), and the risk premium (RP). The study analyzes in a quantitative way to identify how much the disaster insurance has affected to the stabilization of farm household income, by comparing each index of subscribers and non-subscribers.
This study analyzes the figures concerning apple, pear and sweet persimmon, the items for which the largest number of farms subscribed the insurance. The data of apple, pear and sweet persimmon farms includes the standard yield, the decreased amount of yield, the premium paid by farms, and the benefit paid to farms (based on the sources from NHPCI) from 2006 to 2012. For the standard price data, the study uses the selling prices of apple, pear and sweet persimmon from 2006 to 2012 presented in the Income of Agricultural and Livestock Products, published by the Rural Development Administration (RDA).
3.1 Method of Calculation of Risk Indices
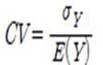
The CV is a representative index that indicates the variability, which is calculated by the standard deviation of annual income ( ) divided by the average (E(Y)). The lower the CV is, the more stable the farm income is.
The VaR refers to the maximum losable sum that farms have to deal with due to a variety of risks. The higher the income variability is, the higher VaR is. It is calculated in two ways: in the parametric method, it is calculated by the standard deviation of the distribution of the profit rate and the determined confidence level; in the non-parametric method, the VaR is calculated directly by the distribution of the given profit rate). In this study, the parametric method is applied.
In this method, the VaR is calculated by multiplying the constant corresponding to the confidence level ( ) by the standard deviation of the profit rate (
 ) by the asset value (V) (VaR=
.jpg) X
X.jpg) XV).
XV). .jpg) indicates the value z, which is the significance level (1-confidence level) of the standard normal distribution. In other words, in case the significance level is 5%,
indicates the value z, which is the significance level (1-confidence level) of the standard normal distribution. In other words, in case the significance level is 5%, .jpg) is 1.65 (see Figure 3-1). In this study, the VaR of farm income is calculated by multiplying the variability of income by the value of underlying asset. The variability of income is calculated based on the standard deviation after calculating the average rate of change in farm income of each year. Under the identical confidence level, the lower the VaR is, the more stable the farm income is.
is 1.65 (see Figure 3-1). In this study, the VaR of farm income is calculated by multiplying the variability of income by the value of underlying asset. The variability of income is calculated based on the standard deviation after calculating the average rate of change in farm income of each year. Under the identical confidence level, the lower the VaR is, the more stable the farm income is.
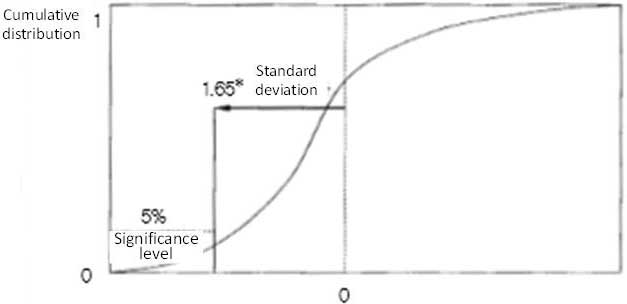
Fig. 3-1. Parametric Method and Cumulative Distribution
Source: Choi et al. (2010), “The Performance and Tasks of Crop Insurance.”
The CE indicates the cash that surely provides the utility equal to the expected utility, which is anticipated in an uncertain situation. The CE is related to the risk aversion level of the producer, so it is needed to define the utility function that reflects the risk appetite of the producer. In this study, the power utility function is used.
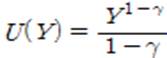
In terms of the power utility function, when the income (Y) increases, the utility (U(Y)) also goes up, while the range of increase of the utility gradually goes down. The effect of the decrease in risk on the increase of the utility varies according to the risk aversion level of the producer (.jpg) ), so it reflects the risk appetite of the producer. In other words, when
), so it reflects the risk appetite of the producer. In other words, when  , it implies that the producer is neutral or indifferent to risks. When
  , it signifies that the producer is very sensitive to risks. All farm households have different risk appetite, but this study assumes 0.5, the medium level of risk aversion (
 ), for convenience.
The CE is derived by taking an expected value for the power utility function and arranging it with regard to the income (Y). When a situation is unstable, between the two farm households with the identical expected income, the one with a higher CE has more stable income.

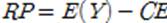
The expected income (assumed income in an unstable situation) minus the CE equals to the RP. Between the two farm households with the identical expected income, the one with more stable income has a higher CE and a lower RP.
3.2 Analysis Result
Table 3-2 compares the risk indices of apple, pear and sweet persimmon farms who subscribed the Crop Insurance and those who did not subscribe between 2006 and 2012. For all of the three items, those who subscribed the disaster insurance recorded lower CV, VaR and RP and higher CE compared to those who did not. This indicates that the insurance subscription led to the stabilization of farm household income for the seven years.
In terms of apple farms, for instance, the CV decreased from 41.3 to 34.3, the VaR from USD 153,000 to USD 68,000, and the RP from USD 2,273 to USD 1,609 thanks to the subscription of the disaster insurance. On the other hand, the CE went up from USD 46,568 to USD 49,138. Such an increase of the CE is attributed to the elimination of risk factors thanks to the subscription of the Crop Insurance, or it can be interpreted as the increase in welfare of producers.
Table 3-2. Effect of the Crop Insurance on the Stabilization of Farm Income
(Based on average farm households; period: 2006-2012)
|
Item
|
Subscription status
|
CV
|
VaR
(USD 1,000)
|
CE
(USD)
|
RP
(USD)
|
|
95%
|
99%
|
|
Apple
|
Non-subscriber
|
41.3
|
153
|
216
|
46,568
|
2,273
|
|
Subscriber
|
34.3
|
68
|
96
|
49,138
|
1,609
|
|
Pear
|
Non-subscriber
|
33.7
|
577
|
81
|
34,339
|
1,715
|
|
Subscriber
|
31.6
|
41
|
58
|
37,969
|
721
|
|
Sweet Persimmon
|
Non-subscriber
|
29.2
|
45
|
64
|
30,701
|
938
|
|
Subscriber
|
26.9
|
30
|
55
|
31,441
|
571
|
|
Note 1: CV (coefficient of variation), VaR (value at risk), CE (certainty equivalence), RP (risk premium)
2: The more stable the farm income is, the lower the CV, VaR and RP are and the higher CE is.
3: In the calculation of the VaR, the underlying asset is based on the income in 2012.
4: The CE is an estimated figure by assuming that γ (risk aversion index)=0.5.
|
4. Effect on the Enhancement of Social Welfare
If farm household income is stabilized by subscribing the Crop Insurance and the welfare of producers is improved, the production of the relevant item tends to grow (Turvey, 1992; Lee et al, 2013). If other conditions are equal, the increase in production leads to the decrease in prices and the enhancement of welfare of consumers, and finally it is expected to expand the welfare of the entire society. However, such an increase of social welfare is brought about by the government support (tax revenues), so it is need to calculate the net benefit of the entire country based on the cost-benefit analysis.
An analysis of the effect on social welfare requires the data of yield and prices of apple, pear and sweet persimmon. The data of selling price of farm households is based on the Income of Agricultural and Livestock Products published by the RDA from 1990 to 2014. For the wholesale prices, the data of the Korea Agro-Fisheries & Food Trade Corp. on Garak Wholesale Market (concerning average products) between 1996 and 2015 was utilized. The yield data of apple, pear and sweet persimmon was based on the data of Statistics Korea from 1998 to 2015.
4.1 Welfare of Producers
The increase in the amount of welfare of producers, driven by reduced risk factors thanks to the disaster insurance subscription, is calculated by subtracting the CE of non-subscribers from that of subscribers. The CE, shown in Table 3-2, is the income per farm household calculated based on the average income of individual farms of each item. And here, the CE is calculated based on the entire income of farms of each item, thereby estimating the increase in the welfare of producers.
Table 3-3 presents the assumed amount of increased welfare of the entire insured producers due to the subscription of the insurance. The total amount of welfare increase, enjoyed by apple, pear and sweet persimmon farms who subscribed the disaster insurance, is estimated to be USD 4.9 million. The item with the largest amount of increase in welfare of producers is pear, recording USD 3.6 million.
Table 3-3. Estimated Amount of Increase in Welfare of Producers due to the Subscription of the Crop Insurance in 2015
|
Item
|
Planned yield (ton)
|
Premium rate (%)
|
Insurance subscription rate
(%)
|
Amount of increase in welfare of producers
(USD 1,000)
|
|
Apple
|
333,728
|
0.96
|
75.3
|
1,248
|
|
Pear
|
254,752
|
2.44
|
87.3
|
3,605
|
|
Sweet Persimmon
|
62,290
|
0.13
|
35.5
|
17
|
|
Total
|
|
|
|
4,870
|
|
Note 1: These are figures estimated by assuming that γ (risk aversion index)=0.5.
2: The planned yield is the Olympic average of the actual yield of farms between 2010 and 2014.
3: In the calculation of the premium rate and the amount of increase in welfare of producers, the guarantee rate of 80% is applied to all three items.
4: The data of the insurance subscription rate is based on that of 2014.
|
4.2 Welfare of Consumers
The increase in consumer welfare following the introduction of the Crop Insurance is attributed to the decreased market prices due to the rise in the yield. Therefore, it is crucial to assume the market price function. It is needed to estimate the retail price function to assume the increase in welfare of consumers, but due to the limit on data collection, this study estimates the wholesale price function.
The result shows that in terms of apple, pear and sweet persimmon, the yield and the wholesale price are in a negative correlation, which is statistically meaningful. When the yield goes up by 1%, the price of apple goes down by 0.78%, that of pear by 0.56%, and that of sweet persimmon by 0.96%.
The study draws the demand curve by using the estimated price decrease rate, and assumes that the supply curve is vertical, to simplify the process because the supply of agricultural crops is very inelastic in the same cultivation year. Accordingly, it is assumed that when the yield increases by 1% and the price decreases, the welfare of consumers jumps, but that of producers does not change. Also, the study assumes that the increase in yield of each item caused by the subscription of the disaster insurance is 1% for apple, 1.2% for pear, and 0.5% for sweet persimmon. This assumption is based on the result of the survey of farm households in the previous study (Chung et al, 2013).
Table 3-4 presents the increase in consumer welfare in the entire society, drawn by the subscription of the Crop Insurance by apple, pear and sweet persimmon farms in 2015. As the subscription of the insurance leads to the rise in yield and the decrease in market prices, the consumer welfare soars by USD 22.9 million. In particular, since the yield of apples remarkably jumps, the selling price of farms and the wholesale price significantly drop, causing the increase in consumer welfare by USD 15.1 million.
Table 3-4. Estimated Amount of Increase in Consumer Welfare as the Effect of the Subscription of the Crop Insurance by Farm Households in 2015
|
Item
|
Planned yield (ton)
|
Expected wholesale price
(USD/kg)
|
Increase in yield2)
(ton)
|
Changes in the wholesale price
(USD/kg)
|
Increase in
consumer welfare
(USD 1,000)
|
|
Apple
|
443,198
|
4.247
|
4,544
|
-0.03396
|
15,128
|
|
Pear
|
291,812
|
2.969
|
3,469
|
-0.01976
|
5,769
|
|
Sweet Persimmon
|
175,465
|
2.420
|
848
|
-0.01122
|
1,969
|
|
Total
|
|
|
|
|
22,866
|
|
Note 1: For the planned yield and the expected wholesale price, the Olympic average of the actual yield and the wholesale price between 2010 and 2014 are applied.
2: The increase in consumer welfare due to the introduction of the Crop Insurance is calculated based on the survey result in Chung et al. (2013). It was calculated by applying the intention of the increase in the yield of grape (7.4%), the one in the same category of item, and the average amount of increase (18.4%), and then multiplying it by the subscription rate of each item.
|
4.3 Cost-Benefit Analysis
The cost-benefit analysis based on these estimated changes in the welfare of producers and consumers shows how the Crop Insurance contributes to insured farm households and even the entire country.
The social cost of the Crop Insurance is comprised of the premium paid by farms and the financial support of the government. The premium paid by farms is 50% of the net premium (the combination of risk premium and damage assessment cost), while the government supports risk premium, damage assessment cost and the operating expense of private insurers. The social benefits are comprised of the welfare of producers and consumers and the benefits given to farms.
Table 3-5 presents the result of the cost-benefit analysis concerning the Crop Insurance. The benefits and costs for the three items are a total of USD 49.1 million and USD 27.8 million, respectively, and accordingly, the net benefit is USD 21.4 million. The social benefit is twice the social cost, implying that the Crop Insurance contributes to not only farm households but also the entire society. This study analyzes only three items with the high subscription rate, but if it covers all items (50 items as of 2016), the net benefit is expected to be higher
Table 3-5. Cost-Benefit Analysis of the Crop Insurance in 2015
|
(Unit: USD 1,000)
|
|
Item
|
Cost
|
Benefit
|
Cost-benefit
|
|
Premium paid by farms
|
Government financial support
|
Total cost
|
Benefits paid to farms
|
Social welfare
|
Total benefit
|
|
Risk premium
|
Damage assessment cost
|
Opera-ting expense of insurers
|
Produ-cer welfare
|
Consu-mer welfare
|
|
Apple
|
4,596
|
4,167
|
429
|
1,622
|
10,814
|
8,333
|
1,248
|
15,128
|
24,709
|
13,896
|
|
Pear
|
7,129
|
6,463
|
666
|
2,516
|
16,775
|
12,927
|
3,605
|
5,769
|
22,301
|
5,526
|
|
Sweet Persimmon
|
84
|
76
|
8
|
29
|
198
|
152
|
17
|
1,969
|
2,138
|
1,940
|
|
Total
|
|
|
|
|
27,787
|
|
|
|
49,148
|
21,362
|
|
Note 1: The guarantee rate of 80% is applied to all three items
2: The producer welfare is a figure estimated by assuming that γ (risk aversion index)=0.5.
|
SUGGESTIONS FOR IMPROVING THE CROP INSURANCE
The Crop Insurance started with two items in 2001 and has increased the number of insured items to 50 by 2016. Although such a growth is basically a remarkable outcome, there have been a series of issues and challenges in expanding the number of insured items in a very short period of time. This s
First, the subscription rate of the insurance should be increased. After the introduction of the insurance, the subscription rate has gone up based on the quantitative and qualitative improvement in the system, but the average rate remains at 16.2% as of 2014, which is absolutely low. This is because farm households are not well aware of the need for the insurance for many items, or the insurance products do not meet the expectations of farms. Therefore, it is crucial to identify problems of the product for each item and supplement the insurance. If the subscription rate is still stagnant even after the improvement, the relevant product can be sold focusing on major producing areas or just eliminated. In addition, the continued monitoring is needed even for the items with the high subscription rate to encourage re-subscription. Since there have been no huge natural disasters since 2012, the need of farm households for the insurance may drop. In order to enhance the awareness of farms of the Crop Insurance, it is needed to expand the education and campaign encouraging the subscription.
Second, the authorities should expand the insurance product improvement committee of each major producing area to continuously improve the existing insurance products and develop new ones with consideration for the demand of farms. Even after improvement, it will be useless as long as farmers are not aware of it. Therefore, the promotion and campaign should be carried out focusing on producing areas to inform farmers of such improvements.
Third, the damage assessment system should be managed in a fair and efficient way. An efficient assessment of damage stabilizes the damage rate and reduces cost. Accordingly, it not only cuts the premium paid by farms but also saves the government budget. The biggest current challenge is that a majority of damage assessors are those engaged in the agricultural industry. It is essential to expand the re-investigation of the assessment result to secure the fairness in the process, and come up with an incentive and penalty system for the NACF and assessors to reinforce their responsibility. A fundamental problem is the lack of professional assessors, so it is needed to nurture new human resources for the damage assessment and expand the participation of existing assessors by increasing payment and incentives for them. Moreover, the standard index for the damage assessment should be established to secure the objectivity of the process based on standardized criteria.
Fourth, the Government Reinsurance System should be stabilized. Although the system was reformed in 2014 to lighten the burden of farms and private insurance companies and effectively distribute risks, there should be additional research on the system. Expanding only the range of coverage of the Government Reinsurance System is no more than passing the burden of loss, so the risk distribution system should be fundamentally enhanced. It is needed to conduct a thorough examination of the system in the similar form to that of the US, which is currently applied only to pilot projects, and expand the system to items of main projects. The current US-type of system subdivides the level of the damage rate of risks, which helps to retain a stable risk distribution system. Also, as private insurers can increase their profits depending on the level of the damage rate, they are expected to aggressively manage risk factors and carry out thorough damage assessment.
Finally, the statistical data management system should be managed in an effective and efficient way. The accuracy and consistency of the statistics are essential for calculating the premium rate in a fair process and designing products on clear principles to stabilize the insurance business. Currently, statistical data, including the yield of crops, are collected only from farms that request for benefits after the outbreak of disasters, but in order to determine the fair premium, it is needed to collect data from non-subscribers as well. Furthermore, the collection and management of data should be conducted using advanced equipment to operate the insurance business effectively when building a Big Data system.
SUMMARY AND CONCLUSION
The Crop Insurance is a policy insurance system for guaranteeing the yield when farms are faced with the loss of and damage to their crops due to natural disasters such as typhoon and hail. The system was introduced in 2001, and the number of insured items increased to 50 as of 2016. With the steady rise in the subscription rate and the benefit, the system has contributed to stabilizing the management of a number of farms. As 15 years passed since the introduction of the Crop Insurance, this study is intended to analyze the outcome and suggest solutions for improvement.
According to the result of the quantitative analysis of the income stabilization effect based on the data of apple, pear and sweet persimmon farms, subscribers have enjoyed lower CV, VaR and RP and higher CE. This implies that the subscription of the insurance has stabilized the income of farms. The result of the cost-benefit analysis of the Crop Insurance finds that the social cost and benefit are USD 27.8 million and USD 49.1 million, respectively, which means the social net benefit is USD 21.4 million. This result suggests that the Crop Insurance contributes to increasing not only the benefit of individual farms but also that of the entire society.
The Crop Insurance in Korea has been stabilized to some degree and utilized as a risk management method by a large number of farms. Still, there is the need to improve the system in the multiple aspects, concerning issues related to insurance products (applicable items, methods of subscription and coverage), the damage assessment system and the risk distribution system. In order to expand its role of stabilizing the management of farm households, such problematic issues should be resolved with continued efforts. Given the accelerated opening of the markets and abnormal weather issues, the instability of the farm management is on the rise. In this condition, the need for the Crop Insurance is expected to grow further.
REFERENCES
Choi, K. H., G. S. Chae, and B.S. Yoon. 2010. “The Performance and Tasks of Crop Insurance.” Korea Rural Economic Institute.
Chung, W. H. 2014. “Analysis of Social Welfare Effects of Crop Revenue Insurance.” Journal of Rural Development, 37(4): 75-95.
Chung, W. H., K. H. Choi, J. E. Lim, and Y. J. Kim. 2010. “A Study on the Introduction of Agricultural Revenue Insurance for Farm Management Stabilization.” Korea Rural Economic Institute.
Kim, C. S. et al. 2006. “Research on Analysis of Result of the Crop Insurance and the Government Reinsurance.” Kyungpook National University.
Lee, H. J. et al. 2013. “2013 In-depth Assessment Report of Budgetary Project: Category of the Prevention of and Countermeasures against Agricultural and Fishery Disasters.” Public & Private Infrastructure Investment Management Center of the Korea Development Institute.
Turvey, C. G. 1992. “An Economic Analysis of Alternative Farm Revenue Insurance Policies.” Canadian Journal of Agricultural Economics, 40:403-426.
|
Submitted as a resource paper for the FFTC-RDA International Seminar on Implementing and Improving Crop Natural Disaster Insurance Program, June 14-16, 2016, Jeonju, Korea
|

The Performance and Improvement Strategies of Crop Natural Disaster Insurance in Korea
ABSTRACT
Crop natural disaster insurance program in Korea has rapidly grown not only in quantity but in quality for 15 years since it was introduced in 2001. Number of agricultural items covered by the program was expanded from two in 2001 to 46 in 2015 and number of participating farmers increased by more than ten times from 8 thousands to 89 thousands during the period. In addition, several customized insurance products were developed reflecting various farmers’ needs on compensation levels and compensation periods. In 2015, a government sponsored crop insurance agency, like Risk Management Agency in the United States, was established in Korea. Empirical results of this paper show that crop natural disaster insurance program contributed remarkably on farm revenue stabilization and social welfare increase in Korea. Further improvement strategies are suggested as follows: review on the agricultural items with low participation rate, continuous development of insurance products reflecting various farmers’ needs, enhancement of fairness and efficiency on loss assessment, establishment of stable reinsurance system and data management system.
Key words: Crop Natural Disaster Insurance, Farm Revenue Stabilization, Social Welfare, Loss Assessment, Government Reinsurance System
INTRODUCTION
The Crop Natural Disaster Insurance (hereafter referred to as “Crop Insurance”) in Korea, introduced in 2001, has achieved rapid quantitative and qualitative growth for the last 15 years. The number of applicable items, which were only two including apple and pear in the early stage, jumped to 50 in 2016. The number of insured farm households also soared from 8,000 in 2001 to 89,000 in 2014. With the rise in the number of insured farms, the scale of government support was expanded by over 45 times in the same period. In addition to such a quantitative growth, the Crop Insurance also showed an incredible growth from the qualitative aspect. A variety of tailored products, which vary in period and level of coverage, have been developed to satisfy demands of farms, and plans for small- and medium-scale farms have also been designed. By introducing the Government Reinsurance System in 2005, the government contributed to stabilizing the insurance market. It also established the Agricultural Policy Insurance & Finance Service, the institution in charge of agricultural insurance, to reinforce the public functions of the insurance including the management of and supervision over relevant projects and the development of products.
Despite such quantitative and qualitative growth of the Crop Insurance, the assessment of how the Crop Insurance contributed to farm households, consumers and the entire society has been insufficient. In particular, a quantitative analysis of outcome was attempted in only three studies: Kim et al (2006), Choi et al (2010), and Lee et al (2013). In the first two studies, the authors analyzed the effect of the Crop Insurance on stabilizing farm household income by measuring the value at risk (VaR). Lee et al (2013) analyzed the effectiveness of the Crop Insurance based on the assessment of the budgetary project of the government. The effect of the Crop Insurance on the stabilization of farm household income was measured by the coefficient of variation (CV), while the impact of the insurance on the increase in production was analyzed by the regression analysis.
This study measures how the Crop Insurance has contributed to stabilizing the income of farm households and how much impact the reduced price due to the increase in production has on the welfare of consumers. Based on this measurement, it comprehensively assesses the contribution of the insurance to the entire society, which is a differentiated method of this kind of study. In addition to VaR and CV, which were used in the previous studies, multiple risk indices including the certainty equivalence (CE) and the risk premium (RP) are utilized in this study to measure the effect on stabilizing the income of farms. This study presents solutions for the Crop Insurance based on a quantitative analysis of the outcome. There have been multiple attempts to enhance the insurance system so far, but many still suggest improving the damage assessment, the Government Reinsurance System, and the subscription rate of insurance.
This paper is comprised of five chapters. In the second chapter, the progress and the current status of the Crop Insurance in Korea are illustrated. In the third chapter, the tangible result of the Crop Insurance projects are described, followed by the quantitative analysis of the effect on the stabilization of farm household income and the social welfare. The fourth chapter provides solutions for the Crop Insurance system, and the fifth chapter presents the summary and conclusion.
PROGRESS AND OVERVIEW OF THE CROP INSURANCE
In Korea, the Crop Insurance was first considered for rice farming in the 1970s, but the attempt was halted due to the low demand of farm households, an enormous budget required all at once, and little damage to rice farming caused by natural disasters. However, as farm households were hit hard by Typhoon Olga in 1999, the Crop Insurance system was officially introduced for apple and pear farming in March 2001. In the early stage of the system in 2002 and 2003, Typhoon Rusa and Maemi caused a significant loss and operational hardships to private insurance companies. Accordingly, the government introduced the Government Reinsurance System in 2005 to bear the large-scale loss of private insurance companies. Since then, the number of items and areas to be insured has increased, and a growing number of farm households have received support to stabilize the management of their farms.
In recent years, the government has taken the initiative in improving the quality of the insurance system. It carried out the reform of the disaster insurance in 2013 to resolve reported issues. For instance, the ratio of the deductible became diversified with consideration for demands of farms, and the standard yield and price were adjusted to the adequate level. Several projects were designed to nurture human resources for the damage assessment and improve the process with scientific methods, while the system for producing and managing statistical data was established. In 2014, for the purpose of stabilizing the operation of the disaster insurance projects, the Government Reinsurance System was reorganized to efficiently divide the responsibilities of the private sector and the government based on the in-depth assessment of the system. In 2015, the Agricultural Policy Insurance & Finance Service (APFS) was designated as the institution in charge of the agricultural disaster insurance, to reinforce the public functions of the insurance system. The APFS designs policy insurance, manages and supervises relevant projects, and develops insurance products.
2.1 Insured Items and Regions
As of 2016, a total of 50 items are covered by the Crop Insurance. The category with the largest number of insured items is greenhouse crops (21), followed by fruit (10), food crops (6), special crops (4), vegetables (4), and forest products (5). Recently, the insurance started to cover agricultural facilities as well.
Insured regions vary according to the form of project. The form of project can be classified into two types: a main project and a pilot project. The former is implemented nationwide, while the latter is carried out focusing on major producing areas for a certain period of time (three years) and then switched to a main project. As of 2016, various main projects are being implemented for 32 items including apple and pear, and pilot projects are conducted for 18 items such as peach and rice.
2.2 Level of Coverage
The Crop Insurance does not cover all damages and losses caused by disasters. The system requires farm households to bear a part of the burden to create the environment where they can prepare for potential disasters on their own and to prevent moral hazard. The level of coverage is diversified, which is determined by considering the characteristics of each item and the financial capacity of each farm household. In Korea, there are five levels of coverage: 60%, 70%, 80%, 85% and 90%.
2.3 Method of Subscription
In case of crops, the insurance is subscribed by each orchard (by farmland for rice), while it is subscribed by a greenhouse complex in case of agricultural facilities and greenhouse crops. Although the Crop Insurance is currently operated in the form of the optional entry system, the minimum standard for subscription is applied depending on the item to cover farms of a certain scale. Farmland with the sum insured under USD 3,000 is excluded from the subject to be insured, and there is an additional limit to the scale of cultivation. It is because if the scale is too small, the expense is higher than the benefit for the farm, and it also makes the operation of the insurance business inefficient.
2.4 Calculation of the Premium Rate and the Government Support
Like other private insurances, the premium rate of the Crop Insurance is calculated in accordance with the Principle of Equivalence with the help of the Korea insurance Development Institute, the institution in charge of the calculation of insurance premium rates. Unlike private insurances calculated by combining the net premium and loading, the disaster insurance as a policy insurance is calculated based only on the net premium. When combining the net premium and loading, the premium rate is too high, giving a heavy burden to farm households. Accordingly, only the net premium is taken account, while loading is handled by the government and the insurer (the NongHyup Property & Casualty Insurance Co., Ltd; NHPCI). The net premium rate is adjusted every year based on the damage rate (insurance benefit/premium) of the past years.
The government supports 50% of the net premium of farm households and 100% of the operating expense of the insurer, to increase the subscription rate and alleviate the burden of the insurer. In addition, most local governments provide additional support (50% of the premium to be paid by farm households), so farm households pay only 25% of the net premium.
2.5 Risk Diversification System
NHPCI is the only insurer of the Crop Insurance System and takes the primary burden of the operation of disaster insurance. However, since there is a limit for NHPCI to bear all risks alone, domestic private insurance companies share the burden (quota share reinsurance). In case of the outbreak of a massive disaster, private insurance companies alone cannot handle risks, so they subscribe the Government Reinsurance so that the government can take the burden of such a huge disaster (Non Proportional Reinsurance).
2.6 Damage Assessment System
When any damage occurs due to disasters, farm households report to a local office of the National Agricultural Cooperative Federation (NACF). Then the local office notifies the case to NHPCI and organizes a damage assessment task force to conduct a site inspection and enter the result of the inspection on the data processing system. NHPCI selects a sample of damaged farm households (unit of land) and carries out a site investigation.
OUTCOME OF THE CROP INSURANCE
This chapter demonstrates the outcome of the Crop Insurance of the past 15 years based on the expansion of insurance projects, the qualitative enhancement of the system by reflecting demands of farms, and the effect of the insurance subscription. In particular, the effect of the insurance is analyzed by calculating the improvement of the welfare of producers (farms) first and the subsequent enhancement of the welfare of consumers with stable prices, and estimating the overall increase of social welfare in a quantitative method.
1. Expansion of Insurance Projects
The Crop Insurance started with only two items—apple and pear—in 2001 and has increased the number of applicable items to 50 by 2016. A total of 32 items are covered by the main projects implemented nationwide, and 18 items by the pilot projects in major producing areas. Such a rapid expansion of the insured items in 16 years is a noteworthy growth, which is not common even inThe Crop Insurance started with only two items—apple and pear—in 2001 and has increased the number of applicable items to 50 by 2016. A total of 32 items are covered by the main projects implemented nationwide, and 18 items by the pilot projects in major producing areas. Such a rapid expansion of the insured items in 16 years is a noteworthy growth, which is not common even in advanced countries. Now a host of farm households are enjoying benefits of the insurance.
In the early stage, the applicable items were mostly fruit, but due to various demands of farm households, a diversity of food crops, vegetables (as greenhouse crops), special crops, and even forest products are currently covered. For determining items to be insured, demand surveys of farm households are conducted at local governments first, and then the relevant items are designated as the subject to be insured. Most items that are considered insurable are currently covered by the insurance products.
As the range of insurance coverage has expanded to include other products in addition to fruits, the regions to be insured have been expanded as well. In 2012, when rice farming was expanded as the national project, a large number of farm households subscribed the Crop Insurance. As pilot projects that were proved to be stable have been switched to main projects, an increasing number of farms have joined to enjoy benefits of the insurance.
In order to increase the subscription rate, the authorities are making efforts to increase the applicable items and expand the range of coverage. In the past, five fruit items were subject only to the specific risk insurance product, which limited the coverage to typhoon, hail, freezing and frost. As the authorities realized that the range of coverage for fruits needed to be expanded as other items, they have gradually introduced the comprehensive risk insurance product to fruit items since 2013, and this product currently covers pear, sweet persimmon, apple and astringent persimmon as of 2016. Furthermore, for the purpose of encouraging the re-subscription of the existing subscribers, a range of incentives are provided to farm households with no accident record, with multiple options to choose the level of coverage.
With the increase in applicable items and the expansion of the coverage range, the number of subscribers has also been on the steady rise. As shown in Table 3-1, the number of insured farm households is 89,000 in 2014, up by more than ten times from 2001. With this growth, the government support has been expanded by over 45 times from USD 4.6 million in 2001 to USD 217.2 million in 2014.
Table 3-1. Annual Changes in the No. of Farm Households Subscribing the Crop Insurance
Unit: Farm household
2001
2002
2003
2004
2005
2006
2007
Total
8,055
18,549
16,480
24,093
26,328
27,398
29,145
2008
2009
2010
2011
2012
2013
2014
Total
32,538
45,882
52,738
67,653
74,983
95,102
89,033
Source: Ministry of Agriculture, Food and Rural Affairs (MAFRA).
The expansion of the scale of the Crop Insurance project led to the establishment of APFS in 2015 as the institution in charge of the stable management and continuous growth of the system. The institution performs public functions, including project management and supervision and product development, nurtures human resources for the damage assessment, and lays the groundwork for expanding research on the Government Reinsurance System. In 2013, the Korea Association of Agricultural and Fishery Insurance on Natural Disaster (KAFIND) was founded as the institute of managing the statistical data of the disaster insurance. The institution builds up the system of producing statistics by publishing the basic statistical data book of each type of disaster insurance and the Agricultural Insurance Yearbook.
2. Farm Management Support Considering Demands of Farms
For efficiently providing support with consideration for demands of farms, the insurance product improvement committee was organized in 2013 to reflect opinions of experts and farmers of each item in the product development process. Major improvements included the expansion of options for farms by diversifying the levels of coverage, the extension of the coverage period, the increase of standard price, the development of customized products reflecting demands of farms, and the expansion of limit on yield for subscription. As a result, the coverage levels were diversified (60%, 70%, 80%, 85%, 90%) according to the characteristics of each item, providing more options to farmers. For several items including sweet persimmon, the coverage period for damages due to freezing and frost in fall season was extended, considering that in the past the insurance period often ended too early before the completion of harvest. Moreover, with consideration for the recent price trend of each item, the standard prices of 18 items were adjusted upward (the price of apple and sweet persimmon by 10%, and that of rice by 5.6%). Furthermore, customized insurance products were developed to meet the demands of farms. For example, the special contract for grapevine was revived, and that for rice blast diseases was added. The subscription of insurance for several greenhouse crops also became available all year round. Also, in the past, the subscription of insurance was limited to farms producing less than the standard yield, but the limit was raised to include those producing up to 150% of the standard yield, addressing the complaints of thriving farms.
In 2014, the plans for small- and medium-scale farms were designed. The minimum requirement for insurance subscription for several items was eased. The requirement for subscription regarding the size of farmland of sweet potato (over 2,000 m2) was abolished, and the limit on the sum insured per farmland for corn and bean was lowered from USD 3,000 to USD 1,000. In terms of the tree damage insurance, the deductible was divided into several levels according to the scale of orchard to alleviate the burden of small farms. With these improvements in the system, the Crop Insurance has been acknowledged as an efficient method of stabilizing the management of farms.
3. Effect on the Stabilization of Farm Household Income
When disasters occur, the yield per unit decreases and the income of farms fluctuates, posing concerns for instability of farm management in the long term. Since the Crop Insurance guarantees the yield according to the contract for the damage of crops caused by natural disasters, farm households can expect to stabilize their income by subscribing the disaster insurance.
There are various methods of analyzing the effect of the Crop Insurance on stabilizing farm household income. This study calculates multiple risk indices, including the coefficient of variation (CV), the value at risk (VaR), the certainty equivalence (CE), and the risk premium (RP). The study analyzes in a quantitative way to identify how much the disaster insurance has affected to the stabilization of farm household income, by comparing each index of subscribers and non-subscribers.
This study analyzes the figures concerning apple, pear and sweet persimmon, the items for which the largest number of farms subscribed the insurance. The data of apple, pear and sweet persimmon farms includes the standard yield, the decreased amount of yield, the premium paid by farms, and the benefit paid to farms (based on the sources from NHPCI) from 2006 to 2012. For the standard price data, the study uses the selling prices of apple, pear and sweet persimmon from 2006 to 2012 presented in the Income of Agricultural and Livestock Products, published by the Rural Development Administration (RDA).
3.1 Method of Calculation of Risk Indices
The CV is a representative index that indicates the variability, which is calculated by the standard deviation of annual income ( ) divided by the average (E(Y)). The lower the CV is, the more stable the farm income is.
The VaR refers to the maximum losable sum that farms have to deal with due to a variety of risks. The higher the income variability is, the higher VaR is. It is calculated in two ways: in the parametric method, it is calculated by the standard deviation of the distribution of the profit rate and the determined confidence level; in the non-parametric method, the VaR is calculated directly by the distribution of the given profit rate). In this study, the parametric method is applied.
In this method, the VaR is calculated by multiplying the constant corresponding to the confidence level ( ) by the standard deviation of the profit rate (
 ) by the asset value (V) (VaR=
.jpg) X
X.jpg) XV).
XV). .jpg) indicates the value z, which is the significance level (1-confidence level) of the standard normal distribution. In other words, in case the significance level is 5%,
indicates the value z, which is the significance level (1-confidence level) of the standard normal distribution. In other words, in case the significance level is 5%, .jpg) is 1.65 (see Figure 3-1). In this study, the VaR of farm income is calculated by multiplying the variability of income by the value of underlying asset. The variability of income is calculated based on the standard deviation after calculating the average rate of change in farm income of each year. Under the identical confidence level, the lower the VaR is, the more stable the farm income is.
is 1.65 (see Figure 3-1). In this study, the VaR of farm income is calculated by multiplying the variability of income by the value of underlying asset. The variability of income is calculated based on the standard deviation after calculating the average rate of change in farm income of each year. Under the identical confidence level, the lower the VaR is, the more stable the farm income is.
Fig. 3-1. Parametric Method and Cumulative Distribution
Source: Choi et al. (2010), “The Performance and Tasks of Crop Insurance.”
The CE indicates the cash that surely provides the utility equal to the expected utility, which is anticipated in an uncertain situation. The CE is related to the risk aversion level of the producer, so it is needed to define the utility function that reflects the risk appetite of the producer. In this study, the power utility function is used.
In terms of the power utility function, when the income (Y) increases, the utility (U(Y)) also goes up, while the range of increase of the utility gradually goes down. The effect of the decrease in risk on the increase of the utility varies according to the risk aversion level of the producer (.jpg) ), so it reflects the risk appetite of the producer. In other words, when
), so it reflects the risk appetite of the producer. In other words, when  , it implies that the producer is neutral or indifferent to risks. When
  , it signifies that the producer is very sensitive to risks. All farm households have different risk appetite, but this study assumes 0.5, the medium level of risk aversion (
 ), for convenience.
The CE is derived by taking an expected value for the power utility function and arranging it with regard to the income (Y). When a situation is unstable, between the two farm households with the identical expected income, the one with a higher CE has more stable income.
The expected income (assumed income in an unstable situation) minus the CE equals to the RP. Between the two farm households with the identical expected income, the one with more stable income has a higher CE and a lower RP.
3.2 Analysis Result
Table 3-2 compares the risk indices of apple, pear and sweet persimmon farms who subscribed the Crop Insurance and those who did not subscribe between 2006 and 2012. For all of the three items, those who subscribed the disaster insurance recorded lower CV, VaR and RP and higher CE compared to those who did not. This indicates that the insurance subscription led to the stabilization of farm household income for the seven years.
In terms of apple farms, for instance, the CV decreased from 41.3 to 34.3, the VaR from USD 153,000 to USD 68,000, and the RP from USD 2,273 to USD 1,609 thanks to the subscription of the disaster insurance. On the other hand, the CE went up from USD 46,568 to USD 49,138. Such an increase of the CE is attributed to the elimination of risk factors thanks to the subscription of the Crop Insurance, or it can be interpreted as the increase in welfare of producers.
Table 3-2. Effect of the Crop Insurance on the Stabilization of Farm Income
(Based on average farm households; period: 2006-2012)
Item
Subscription status
CV
VaR
(USD 1,000)
CE
(USD)
RP
(USD)
95%
99%
Apple
Non-subscriber
41.3
153
216
46,568
2,273
Subscriber
34.3
68
96
49,138
1,609
Pear
Non-subscriber
33.7
577
81
34,339
1,715
Subscriber
31.6
41
58
37,969
721
Sweet Persimmon
Non-subscriber
29.2
45
64
30,701
938
Subscriber
26.9
30
55
31,441
571
Note 1: CV (coefficient of variation), VaR (value at risk), CE (certainty equivalence), RP (risk premium)
2: The more stable the farm income is, the lower the CV, VaR and RP are and the higher CE is.
3: In the calculation of the VaR, the underlying asset is based on the income in 2012.
4: The CE is an estimated figure by assuming that γ (risk aversion index)=0.5.
4. Effect on the Enhancement of Social Welfare
If farm household income is stabilized by subscribing the Crop Insurance and the welfare of producers is improved, the production of the relevant item tends to grow (Turvey, 1992; Lee et al, 2013). If other conditions are equal, the increase in production leads to the decrease in prices and the enhancement of welfare of consumers, and finally it is expected to expand the welfare of the entire society. However, such an increase of social welfare is brought about by the government support (tax revenues), so it is need to calculate the net benefit of the entire country based on the cost-benefit analysis.
An analysis of the effect on social welfare requires the data of yield and prices of apple, pear and sweet persimmon. The data of selling price of farm households is based on the Income of Agricultural and Livestock Products published by the RDA from 1990 to 2014. For the wholesale prices, the data of the Korea Agro-Fisheries & Food Trade Corp. on Garak Wholesale Market (concerning average products) between 1996 and 2015 was utilized. The yield data of apple, pear and sweet persimmon was based on the data of Statistics Korea from 1998 to 2015.
4.1 Welfare of Producers
The increase in the amount of welfare of producers, driven by reduced risk factors thanks to the disaster insurance subscription, is calculated by subtracting the CE of non-subscribers from that of subscribers. The CE, shown in Table 3-2, is the income per farm household calculated based on the average income of individual farms of each item. And here, the CE is calculated based on the entire income of farms of each item, thereby estimating the increase in the welfare of producers.
Table 3-3 presents the assumed amount of increased welfare of the entire insured producers due to the subscription of the insurance. The total amount of welfare increase, enjoyed by apple, pear and sweet persimmon farms who subscribed the disaster insurance, is estimated to be USD 4.9 million. The item with the largest amount of increase in welfare of producers is pear, recording USD 3.6 million.
Table 3-3. Estimated Amount of Increase in Welfare of Producers due to the Subscription of the Crop Insurance in 2015
Item
Planned yield (ton)
Premium rate (%)
Insurance subscription rate
(%)
Amount of increase in welfare of producers
(USD 1,000)
Apple
333,728
0.96
75.3
1,248
Pear
254,752
2.44
87.3
3,605
Sweet Persimmon
62,290
0.13
35.5
17
Total
4,870
Note 1: These are figures estimated by assuming that γ (risk aversion index)=0.5.
2: The planned yield is the Olympic average of the actual yield of farms between 2010 and 2014.
3: In the calculation of the premium rate and the amount of increase in welfare of producers, the guarantee rate of 80% is applied to all three items.
4: The data of the insurance subscription rate is based on that of 2014.
4.2 Welfare of Consumers
The increase in consumer welfare following the introduction of the Crop Insurance is attributed to the decreased market prices due to the rise in the yield. Therefore, it is crucial to assume the market price function. It is needed to estimate the retail price function to assume the increase in welfare of consumers, but due to the limit on data collection, this study estimates the wholesale price function.
The result shows that in terms of apple, pear and sweet persimmon, the yield and the wholesale price are in a negative correlation, which is statistically meaningful. When the yield goes up by 1%, the price of apple goes down by 0.78%, that of pear by 0.56%, and that of sweet persimmon by 0.96%.
The study draws the demand curve by using the estimated price decrease rate, and assumes that the supply curve is vertical, to simplify the process because the supply of agricultural crops is very inelastic in the same cultivation year. Accordingly, it is assumed that when the yield increases by 1% and the price decreases, the welfare of consumers jumps, but that of producers does not change. Also, the study assumes that the increase in yield of each item caused by the subscription of the disaster insurance is 1% for apple, 1.2% for pear, and 0.5% for sweet persimmon. This assumption is based on the result of the survey of farm households in the previous study (Chung et al, 2013).
Table 3-4 presents the increase in consumer welfare in the entire society, drawn by the subscription of the Crop Insurance by apple, pear and sweet persimmon farms in 2015. As the subscription of the insurance leads to the rise in yield and the decrease in market prices, the consumer welfare soars by USD 22.9 million. In particular, since the yield of apples remarkably jumps, the selling price of farms and the wholesale price significantly drop, causing the increase in consumer welfare by USD 15.1 million.
Table 3-4. Estimated Amount of Increase in Consumer Welfare as the Effect of the Subscription of the Crop Insurance by Farm Households in 2015
Item
Planned yield (ton)
Expected wholesale price
(USD/kg)
Increase in yield2)
(ton)
Changes in the wholesale price
(USD/kg)
Increase in
consumer welfare
(USD 1,000)
Apple
443,198
4.247
4,544
-0.03396
15,128
Pear
291,812
2.969
3,469
-0.01976
5,769
Sweet Persimmon
175,465
2.420
848
-0.01122
1,969
Total
22,866
Note 1: For the planned yield and the expected wholesale price, the Olympic average of the actual yield and the wholesale price between 2010 and 2014 are applied.
2: The increase in consumer welfare due to the introduction of the Crop Insurance is calculated based on the survey result in Chung et al. (2013). It was calculated by applying the intention of the increase in the yield of grape (7.4%), the one in the same category of item, and the average amount of increase (18.4%), and then multiplying it by the subscription rate of each item.
4.3 Cost-Benefit Analysis
The cost-benefit analysis based on these estimated changes in the welfare of producers and consumers shows how the Crop Insurance contributes to insured farm households and even the entire country.
The social cost of the Crop Insurance is comprised of the premium paid by farms and the financial support of the government. The premium paid by farms is 50% of the net premium (the combination of risk premium and damage assessment cost), while the government supports risk premium, damage assessment cost and the operating expense of private insurers. The social benefits are comprised of the welfare of producers and consumers and the benefits given to farms.
Table 3-5 presents the result of the cost-benefit analysis concerning the Crop Insurance. The benefits and costs for the three items are a total of USD 49.1 million and USD 27.8 million, respectively, and accordingly, the net benefit is USD 21.4 million. The social benefit is twice the social cost, implying that the Crop Insurance contributes to not only farm households but also the entire society. This study analyzes only three items with the high subscription rate, but if it covers all items (50 items as of 2016), the net benefit is expected to be higher
Table 3-5. Cost-Benefit Analysis of the Crop Insurance in 2015
(Unit: USD 1,000)
Item
Cost
Benefit
Cost-benefit
Premium paid by farms
Government financial support
Total cost
Benefits paid to farms
Social welfare
Total benefit
Risk premium
Damage assessment cost
Opera-ting expense of insurers
Produ-cer welfare
Consu-mer welfare
Apple
4,596
4,167
429
1,622
10,814
8,333
1,248
15,128
24,709
13,896
Pear
7,129
6,463
666
2,516
16,775
12,927
3,605
5,769
22,301
5,526
Sweet Persimmon
84
76
8
29
198
152
17
1,969
2,138
1,940
Total
27,787
49,148
21,362
Note 1: The guarantee rate of 80% is applied to all three items
2: The producer welfare is a figure estimated by assuming that γ (risk aversion index)=0.5.
SUGGESTIONS FOR IMPROVING THE CROP INSURANCE
The Crop Insurance started with two items in 2001 and has increased the number of insured items to 50 by 2016. Although such a growth is basically a remarkable outcome, there have been a series of issues and challenges in expanding the number of insured items in a very short period of time. This s
First, the subscription rate of the insurance should be increased. After the introduction of the insurance, the subscription rate has gone up based on the quantitative and qualitative improvement in the system, but the average rate remains at 16.2% as of 2014, which is absolutely low. This is because farm households are not well aware of the need for the insurance for many items, or the insurance products do not meet the expectations of farms. Therefore, it is crucial to identify problems of the product for each item and supplement the insurance. If the subscription rate is still stagnant even after the improvement, the relevant product can be sold focusing on major producing areas or just eliminated. In addition, the continued monitoring is needed even for the items with the high subscription rate to encourage re-subscription. Since there have been no huge natural disasters since 2012, the need of farm households for the insurance may drop. In order to enhance the awareness of farms of the Crop Insurance, it is needed to expand the education and campaign encouraging the subscription.
Second, the authorities should expand the insurance product improvement committee of each major producing area to continuously improve the existing insurance products and develop new ones with consideration for the demand of farms. Even after improvement, it will be useless as long as farmers are not aware of it. Therefore, the promotion and campaign should be carried out focusing on producing areas to inform farmers of such improvements.
Third, the damage assessment system should be managed in a fair and efficient way. An efficient assessment of damage stabilizes the damage rate and reduces cost. Accordingly, it not only cuts the premium paid by farms but also saves the government budget. The biggest current challenge is that a majority of damage assessors are those engaged in the agricultural industry. It is essential to expand the re-investigation of the assessment result to secure the fairness in the process, and come up with an incentive and penalty system for the NACF and assessors to reinforce their responsibility. A fundamental problem is the lack of professional assessors, so it is needed to nurture new human resources for the damage assessment and expand the participation of existing assessors by increasing payment and incentives for them. Moreover, the standard index for the damage assessment should be established to secure the objectivity of the process based on standardized criteria.
Fourth, the Government Reinsurance System should be stabilized. Although the system was reformed in 2014 to lighten the burden of farms and private insurance companies and effectively distribute risks, there should be additional research on the system. Expanding only the range of coverage of the Government Reinsurance System is no more than passing the burden of loss, so the risk distribution system should be fundamentally enhanced. It is needed to conduct a thorough examination of the system in the similar form to that of the US, which is currently applied only to pilot projects, and expand the system to items of main projects. The current US-type of system subdivides the level of the damage rate of risks, which helps to retain a stable risk distribution system. Also, as private insurers can increase their profits depending on the level of the damage rate, they are expected to aggressively manage risk factors and carry out thorough damage assessment.
Finally, the statistical data management system should be managed in an effective and efficient way. The accuracy and consistency of the statistics are essential for calculating the premium rate in a fair process and designing products on clear principles to stabilize the insurance business. Currently, statistical data, including the yield of crops, are collected only from farms that request for benefits after the outbreak of disasters, but in order to determine the fair premium, it is needed to collect data from non-subscribers as well. Furthermore, the collection and management of data should be conducted using advanced equipment to operate the insurance business effectively when building a Big Data system.
SUMMARY AND CONCLUSION
The Crop Insurance is a policy insurance system for guaranteeing the yield when farms are faced with the loss of and damage to their crops due to natural disasters such as typhoon and hail. The system was introduced in 2001, and the number of insured items increased to 50 as of 2016. With the steady rise in the subscription rate and the benefit, the system has contributed to stabilizing the management of a number of farms. As 15 years passed since the introduction of the Crop Insurance, this study is intended to analyze the outcome and suggest solutions for improvement.
According to the result of the quantitative analysis of the income stabilization effect based on the data of apple, pear and sweet persimmon farms, subscribers have enjoyed lower CV, VaR and RP and higher CE. This implies that the subscription of the insurance has stabilized the income of farms. The result of the cost-benefit analysis of the Crop Insurance finds that the social cost and benefit are USD 27.8 million and USD 49.1 million, respectively, which means the social net benefit is USD 21.4 million. This result suggests that the Crop Insurance contributes to increasing not only the benefit of individual farms but also that of the entire society.
The Crop Insurance in Korea has been stabilized to some degree and utilized as a risk management method by a large number of farms. Still, there is the need to improve the system in the multiple aspects, concerning issues related to insurance products (applicable items, methods of subscription and coverage), the damage assessment system and the risk distribution system. In order to expand its role of stabilizing the management of farm households, such problematic issues should be resolved with continued efforts. Given the accelerated opening of the markets and abnormal weather issues, the instability of the farm management is on the rise. In this condition, the need for the Crop Insurance is expected to grow further.
REFERENCES
Choi, K. H., G. S. Chae, and B.S. Yoon. 2010. “The Performance and Tasks of Crop Insurance.” Korea Rural Economic Institute.
Chung, W. H. 2014. “Analysis of Social Welfare Effects of Crop Revenue Insurance.” Journal of Rural Development, 37(4): 75-95.
Chung, W. H., K. H. Choi, J. E. Lim, and Y. J. Kim. 2010. “A Study on the Introduction of Agricultural Revenue Insurance for Farm Management Stabilization.” Korea Rural Economic Institute.
Kim, C. S. et al. 2006. “Research on Analysis of Result of the Crop Insurance and the Government Reinsurance.” Kyungpook National University.
Lee, H. J. et al. 2013. “2013 In-depth Assessment Report of Budgetary Project: Category of the Prevention of and Countermeasures against Agricultural and Fishery Disasters.” Public & Private Infrastructure Investment Management Center of the Korea Development Institute.
Turvey, C. G. 1992. “An Economic Analysis of Alternative Farm Revenue Insurance Policies.” Canadian Journal of Agricultural Economics, 40:403-426.
Submitted as a resource paper for the FFTC-RDA International Seminar on Implementing and Improving Crop Natural Disaster Insurance Program, June 14-16, 2016, Jeonju, Korea