ABSTRACT
Japan has a unique system of agricultural cooperatives, known as JA. This study presents the updated estimates of JA’s share in the agricultural input and output markets. This study also calculates indicators for the economic solidarity of JA’s network. The estimation results show that, while JA has enjoyed strong market power as a unified economic group for years, it had a turning point in the middle of the 1990s: JA’s market share and solidarity have been gradually declining since then.
Keywords: JA, market share, solidarity, rice
INTRODUCTION
The system of agricultural cooperatives known as JA plays a pivotal role in Japan’s agricultural sector[1]. Although nobody is legally required to join JA, all Japanese farmers belong to the organization.
In spite of its importance, objective information on JA’s economic position is limited. This is mainly because of the complexity of its business statistics. To fill this information gap, the author estimated and published JA’s market share data for agricultural inputs and outputs (Godo, 2015). This study presents an updated version of the author’s dataset based on the most recent statistics.
JAPAN’S SYSTEM OF AGRICULTURAL COOPERATIVES
JA has a three-tier structure[2]. Unit cooperatives in villages, towns, and cities constitute the first level, and are in direct contact with farmers. The Prefectural Central Unions of Agricultural Cooperatives (PCUs) in the prefectures constitute the second level. Each prefecture has its own PCU, to which all the unit cooperatives in the prefecture belong. Zenchu constitutes the third and top level. Based on this nationwide network, Zenchu organizes farmers’ political movements. It also supervises the business performance and profitability of unit cooperatives in collaboration with PCUs.
JA provides not only agricultural services but also almost every other service required for daily life. In addition to farmers, non-farmers who are admitted as associated members and have paid their dues are allowed to use all the services of the cooperatives under the same conditions as farmers[3].
Each unit cooperative has its own jurisdiction, which not overlap with other jurisdictions. As of April 1, 2015, there were 706 unit cooperatives in Japan. The size and human resources available to any one agricultural cooperative are insufficient to enable it to compete with private businesses, such as supermarkets and trading companies. To overcome this weakness, unit cooperatives form federations at the prefectural and national levels, referred to as Keizairen and Zen-noh, respectively. They buy and sell agricultural and non-agricultural commodities as unit cooperatives’ agents.
ESTIMATION METHODOLOGIES FOR JA’S MARKET SHARES
Godo (2015) provides JA’s market share estimates for fiscal years 1960–2011. The author mainly relied on two statistical publications of the Ministry of Agriculture, Forestry and Fisheries (MAFF): Sogo Nokyo Tokei Hyo (Statistics of Agricultural Cooperatives) and Nogyo Shokuryo Kanrensangyo no Keizaikeisan (Social Accounts for the Agricultural and Food Industries). After the publication of Godo (2015), MAFF released new versions of these statistics. These publications allowed the author to estimate 2012 data using the same methodologies as Godo (2015). This study provides the author’s JA market share estimates for fiscal years 1960–2012[4].
ESTIMATES OF JA’S SHARE IN THE AGRICULTURAL INPUT MARKET
Expenditures on farming inputs are of two types: expenditures for tangible inputs such as fertilizers and pesticides and those for intangible inputs such as fees for contract farming and joint-use facilities.
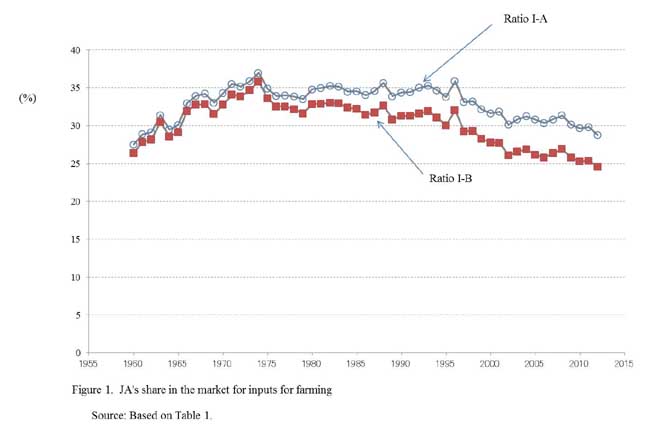
Traditionally, JA’s focus was to provide tangible inputs for farmers. Recently, however, JA has been becoming increasingly active in providing intangible inputs for farmers. To estimate JA’s share in the agricultural input market, therefore, this study calculates the following two ratios.
Ratio I-A = (Unit cooperatives’ total sales of tangible farming inputs + unit cooperatives’ total charges for intangible farming inputs)/farmers’ total expenditure for farming inputs
Ratio I-B = Unit cooperatives’ total sales of tangible farming inputs/farmers’ total expenditure for farming inputs
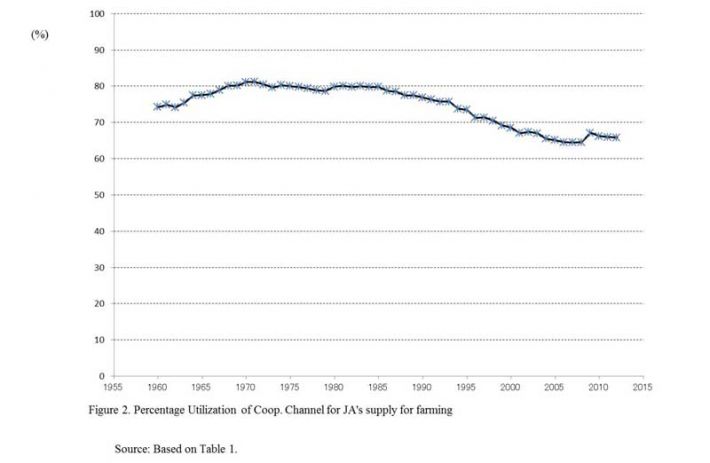
Of the unit cooperatives’ total supply of tangible inputs, the proportion that farmers procure through Keizairen or Zen-noh is defined as “percentage utilization of cooperative channels.” Those associated with JA recognize this ratio as an indicator of the JA group’s solidarity: the larger the ratio, the stronger the group’s business solidarity.
Table 1 and Figures 1 and 2 show ratios I-A and I-B and percentage utilization of cooperative channels estimated in this study.
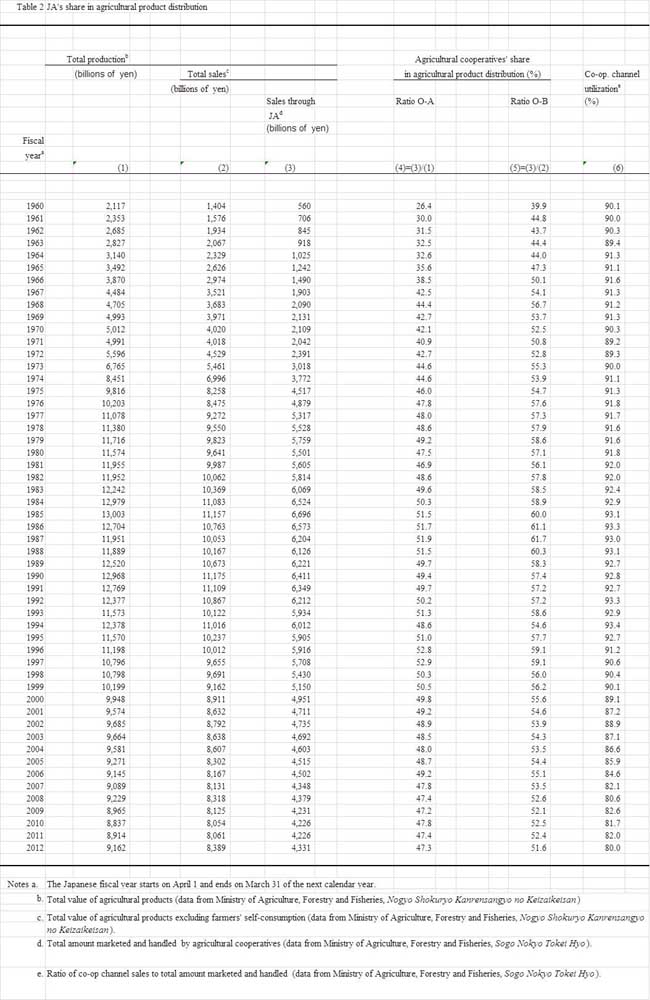
ESTIMATES OF JA’S SHARE IN THE AGRICULTURAL OUTPUT MARKET
Agricultural production refers to not only the output sold but also the unsold output (i.e., that retained for farmers’ self-consumption).
This study calculates the following two ratios as indicators of JA’s shares in the agricultural output market.
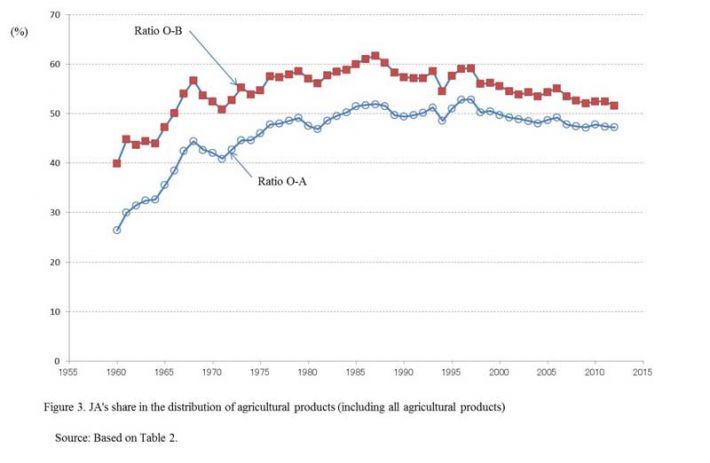
Ratio O-A = Total value of unit cooperatives’ joint shipment of agricultural products/Total value of agricultural products
Ratio O-B =Total value of unit cooperatives’ joint shipment of agricultural products/Total value of agricultural products sold
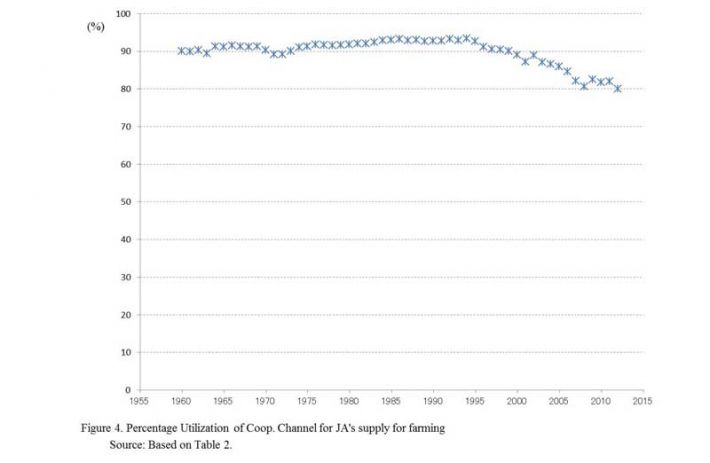
Of the unit cooperatives’ joint shipment, the proportion marketed through Keizairen or Zen-noh is defined as “percentage utilization of cooperative channels.” As with farming inputs, this ratio is recognized as an indicator of the JA group’s solidarity: the larger the ratio, the stronger the group’s business solidarity.
Table 2 and Figures 3 and 4 show ratios O-A and O-B and percentage utilization of cooperative channels estimated in this study.
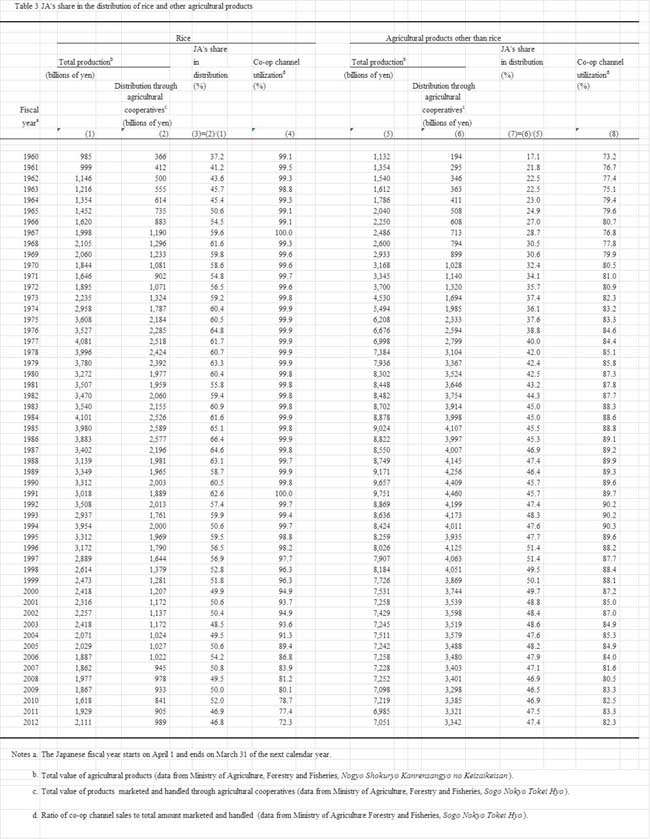
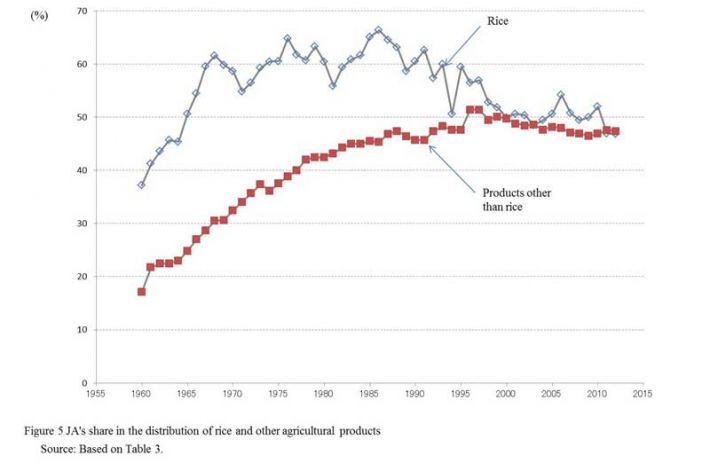
Rice is the staple food for Japanese consumers, and its distribution was specially controlled by the MAFF previously. Under the Food Control Law (FCL), which remained in force until 1995, agricultural cooperatives were given the privilege of marketing rice at a stable margin guaranteed by the MAFF[5].
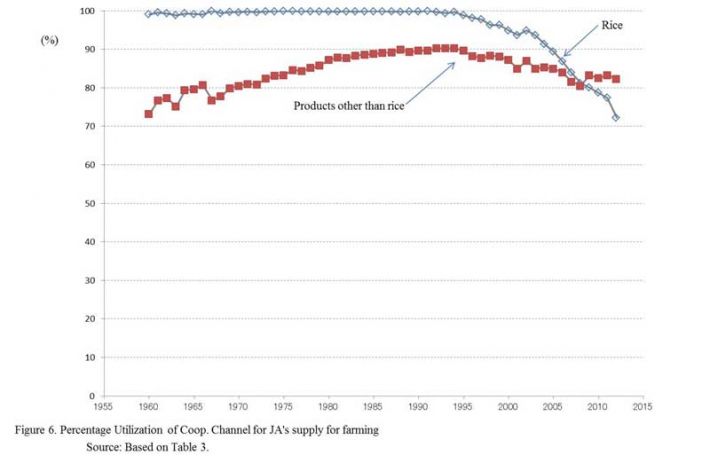
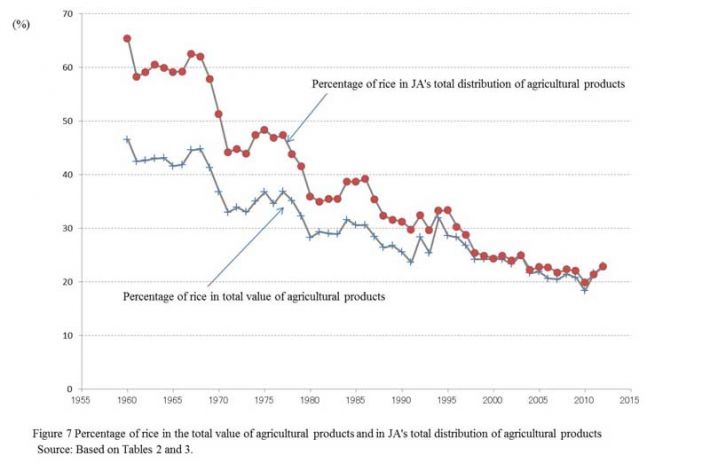
MAFF provides sufficient information to calculate ratio O-A and percentage utilization of cooperative channels separately for rice and other agricultural products. Table 3 and Figures 5 and 6 show the results. In addition, Figure 7 shows the share of rice in Japan’s total agricultural production and in JA’s total distribution of agricultural products based on the data in Table 3[6].
Table 3 and Figures 5, 6, and 7 imply that JA had an advantage in distributing rice under the FCL. JA showed especially strong solidarity and enjoyed a large market share for rice until 1995. However, this advantage has disappeared in recent years, with no significant difference at present between rice and other commodities in terms of ratio O-A or percentage utilization of cooperative channels.
CONCLUSION
This study’s estimates imply that JA enjoys strong market power as a unified economic group. JA’s share in the agricultural input market is now as high as almost 30 percent. Unit cooperatives rely heavily on Keizairen and Zen-noh (nearly 70 percent) to obtain new stock of agricultural materials. JA’s share in the agricultural output market (considering all agricultural products jointly) is currently nearly 50 percent, and nearly 80 percent of unit cooperatives’ joint shipments are routed through Keizairen or Zen-noh. In particular, JA had an advantage in distributing rice under the FCL. JA showed especially strong solidarity and enjoyed a large market share for rice until 1995.
However, this study’s estimates also show that JA’s market share and solidarity have been gradually declining since the mid-1990s. Simultaneously, JA’s advantage in rice distribution has been disappearing. Japanese markets have witnessed various revolutionary changes over this period, with market competition becoming fiercer for many types of commodities. This study’s analysis has indicated that agricultural input and output markets are no exception to this general trend.

REFERENCES
Godo, Y., “The History of Japan’s Post-Pacific-War Rice Policy,” FFTC Agricultural Policy
Platform (Food & Fertilizer Technology Center for the Asian and Pacific Region), November 1, 2013.
Godo, Y., “The Japanese Agricultural Cooperative System: An Outline,” FFTC Agricultural
Policy Platform (Food & Fertilizer Technology Center for the Asian and Pacific Region), May 30, 2014a.
Godo, Y., “The Significance of Non-farmers in Japanese Agricultural Cooperatives,” FFTC Agricultural Policy Platform (Food & Fertilizer Technology Center for the Asian and Pacific Region), July 4, 2014b.
Godo, Y., “Estimating Agricultural Cooperatives’ Share of Agricultural Input and Output Markets,” FFTC Agricultural Policy Platform (Food & Fertilizer Technology Center for the Asian and Pacific Region), March 2, 2015.
Ministry of Agriculture, Forestry and Fisheries, Sogo Nokyo Tokei Hyo (Statistics of Agricultural Cooperatives), various issues.
Ministry of Agriculture, Forestry and Fisheries, Nogyo Shokuryo Kanrensangyo no Keizaikeisan (Social Accounts for the Agricultural and Food Industries), various issues.
* Professor of Economics in Meiji Gakuin University, 1-2-37 Shirokane-dai, Minato-ku, Tokyo 108-8636, Japan. Tel.: (81 3) 5421 5628; fax: (81 3) 5421 5207; e-mail: godo@eco.meijigakuin.ac.jp
[1] The acronym JA comes from the combination of “Japan” and “Agriculture.” The name JA has been used since 1993. Before that, Japanese agricultural cooperatives called themselves Keito (its literal meaning is system). For simplicity, this study uses JA for the entire postwar period.
[2] See Godo (2014a) for an overview of the JA system.
[3] The significance of non-farmers in JA is discussed in Godo (2014b).
[4] This paper’s estimates for 1960–2011 are the same as those in Godo (2015).
[5] Godo (2013) provides a compact review of the history of Japan’s rice policy in the postwar period.
[6] Figure 7 displays the share of rice in JA’s total distribution of agricultural products, obtained by dividing column (2) of Table 3 by column (3) of Table 2. Likewise, dividing column (1) of Table 3 by column (1) of Table 2 gives the percentage of rice in the total value of agricultural products.
| Submitted as a resource paper for the FFTC-NACF International Seminar on Improving Food Marketing Efficiency—the Role of Agricultural Cooperatives, Sept. 14-18, NACF, Seoul, Korea |

Changing Economic Performance of Japan’s Agricultural Cooperatives
ABSTRACT
Japan has a unique system of agricultural cooperatives, known as JA. This study presents the updated estimates of JA’s share in the agricultural input and output markets. This study also calculates indicators for the economic solidarity of JA’s network. The estimation results show that, while JA has enjoyed strong market power as a unified economic group for years, it had a turning point in the middle of the 1990s: JA’s market share and solidarity have been gradually declining since then.
Keywords: JA, market share, solidarity, rice
INTRODUCTION
The system of agricultural cooperatives known as JA plays a pivotal role in Japan’s agricultural sector[1]. Although nobody is legally required to join JA, all Japanese farmers belong to the organization.
In spite of its importance, objective information on JA’s economic position is limited. This is mainly because of the complexity of its business statistics. To fill this information gap, the author estimated and published JA’s market share data for agricultural inputs and outputs (Godo, 2015). This study presents an updated version of the author’s dataset based on the most recent statistics.
JAPAN’S SYSTEM OF AGRICULTURAL COOPERATIVES
JA has a three-tier structure[2]. Unit cooperatives in villages, towns, and cities constitute the first level, and are in direct contact with farmers. The Prefectural Central Unions of Agricultural Cooperatives (PCUs) in the prefectures constitute the second level. Each prefecture has its own PCU, to which all the unit cooperatives in the prefecture belong. Zenchu constitutes the third and top level. Based on this nationwide network, Zenchu organizes farmers’ political movements. It also supervises the business performance and profitability of unit cooperatives in collaboration with PCUs.
JA provides not only agricultural services but also almost every other service required for daily life. In addition to farmers, non-farmers who are admitted as associated members and have paid their dues are allowed to use all the services of the cooperatives under the same conditions as farmers[3].
Each unit cooperative has its own jurisdiction, which not overlap with other jurisdictions. As of April 1, 2015, there were 706 unit cooperatives in Japan. The size and human resources available to any one agricultural cooperative are insufficient to enable it to compete with private businesses, such as supermarkets and trading companies. To overcome this weakness, unit cooperatives form federations at the prefectural and national levels, referred to as Keizairen and Zen-noh, respectively. They buy and sell agricultural and non-agricultural commodities as unit cooperatives’ agents.
ESTIMATION METHODOLOGIES FOR JA’S MARKET SHARES
Godo (2015) provides JA’s market share estimates for fiscal years 1960–2011. The author mainly relied on two statistical publications of the Ministry of Agriculture, Forestry and Fisheries (MAFF): Sogo Nokyo Tokei Hyo (Statistics of Agricultural Cooperatives) and Nogyo Shokuryo Kanrensangyo no Keizaikeisan (Social Accounts for the Agricultural and Food Industries). After the publication of Godo (2015), MAFF released new versions of these statistics. These publications allowed the author to estimate 2012 data using the same methodologies as Godo (2015). This study provides the author’s JA market share estimates for fiscal years 1960–2012[4].
ESTIMATES OF JA’S SHARE IN THE AGRICULTURAL INPUT MARKET
Expenditures on farming inputs are of two types: expenditures for tangible inputs such as fertilizers and pesticides and those for intangible inputs such as fees for contract farming and joint-use facilities.
Traditionally, JA’s focus was to provide tangible inputs for farmers. Recently, however, JA has been becoming increasingly active in providing intangible inputs for farmers. To estimate JA’s share in the agricultural input market, therefore, this study calculates the following two ratios.
Ratio I-A = (Unit cooperatives’ total sales of tangible farming inputs + unit cooperatives’ total charges for intangible farming inputs)/farmers’ total expenditure for farming inputs
Ratio I-B = Unit cooperatives’ total sales of tangible farming inputs/farmers’ total expenditure for farming inputs
Of the unit cooperatives’ total supply of tangible inputs, the proportion that farmers procure through Keizairen or Zen-noh is defined as “percentage utilization of cooperative channels.” Those associated with JA recognize this ratio as an indicator of the JA group’s solidarity: the larger the ratio, the stronger the group’s business solidarity.
Table 1 and Figures 1 and 2 show ratios I-A and I-B and percentage utilization of cooperative channels estimated in this study.
ESTIMATES OF JA’S SHARE IN THE AGRICULTURAL OUTPUT MARKET
Agricultural production refers to not only the output sold but also the unsold output (i.e., that retained for farmers’ self-consumption).
This study calculates the following two ratios as indicators of JA’s shares in the agricultural output market.
Ratio O-A = Total value of unit cooperatives’ joint shipment of agricultural products/Total value of agricultural products
Ratio O-B =Total value of unit cooperatives’ joint shipment of agricultural products/Total value of agricultural products sold
Of the unit cooperatives’ joint shipment, the proportion marketed through Keizairen or Zen-noh is defined as “percentage utilization of cooperative channels.” As with farming inputs, this ratio is recognized as an indicator of the JA group’s solidarity: the larger the ratio, the stronger the group’s business solidarity.
Table 2 and Figures 3 and 4 show ratios O-A and O-B and percentage utilization of cooperative channels estimated in this study.
Rice is the staple food for Japanese consumers, and its distribution was specially controlled by the MAFF previously. Under the Food Control Law (FCL), which remained in force until 1995, agricultural cooperatives were given the privilege of marketing rice at a stable margin guaranteed by the MAFF[5].
MAFF provides sufficient information to calculate ratio O-A and percentage utilization of cooperative channels separately for rice and other agricultural products. Table 3 and Figures 5 and 6 show the results. In addition, Figure 7 shows the share of rice in Japan’s total agricultural production and in JA’s total distribution of agricultural products based on the data in Table 3[6].
Table 3 and Figures 5, 6, and 7 imply that JA had an advantage in distributing rice under the FCL. JA showed especially strong solidarity and enjoyed a large market share for rice until 1995. However, this advantage has disappeared in recent years, with no significant difference at present between rice and other commodities in terms of ratio O-A or percentage utilization of cooperative channels.
CONCLUSION
This study’s estimates imply that JA enjoys strong market power as a unified economic group. JA’s share in the agricultural input market is now as high as almost 30 percent. Unit cooperatives rely heavily on Keizairen and Zen-noh (nearly 70 percent) to obtain new stock of agricultural materials. JA’s share in the agricultural output market (considering all agricultural products jointly) is currently nearly 50 percent, and nearly 80 percent of unit cooperatives’ joint shipments are routed through Keizairen or Zen-noh. In particular, JA had an advantage in distributing rice under the FCL. JA showed especially strong solidarity and enjoyed a large market share for rice until 1995.
However, this study’s estimates also show that JA’s market share and solidarity have been gradually declining since the mid-1990s. Simultaneously, JA’s advantage in rice distribution has been disappearing. Japanese markets have witnessed various revolutionary changes over this period, with market competition becoming fiercer for many types of commodities. This study’s analysis has indicated that agricultural input and output markets are no exception to this general trend.
REFERENCES
Godo, Y., “The History of Japan’s Post-Pacific-War Rice Policy,” FFTC Agricultural Policy
Platform (Food & Fertilizer Technology Center for the Asian and Pacific Region), November 1, 2013.
Godo, Y., “The Japanese Agricultural Cooperative System: An Outline,” FFTC Agricultural
Policy Platform (Food & Fertilizer Technology Center for the Asian and Pacific Region), May 30, 2014a.
Godo, Y., “The Significance of Non-farmers in Japanese Agricultural Cooperatives,” FFTC Agricultural Policy Platform (Food & Fertilizer Technology Center for the Asian and Pacific Region), July 4, 2014b.
Godo, Y., “Estimating Agricultural Cooperatives’ Share of Agricultural Input and Output Markets,” FFTC Agricultural Policy Platform (Food & Fertilizer Technology Center for the Asian and Pacific Region), March 2, 2015.
Ministry of Agriculture, Forestry and Fisheries, Sogo Nokyo Tokei Hyo (Statistics of Agricultural Cooperatives), various issues.
Ministry of Agriculture, Forestry and Fisheries, Nogyo Shokuryo Kanrensangyo no Keizaikeisan (Social Accounts for the Agricultural and Food Industries), various issues.
* Professor of Economics in Meiji Gakuin University, 1-2-37 Shirokane-dai, Minato-ku, Tokyo 108-8636, Japan. Tel.: (81 3) 5421 5628; fax: (81 3) 5421 5207; e-mail: godo@eco.meijigakuin.ac.jp
[1] The acronym JA comes from the combination of “Japan” and “Agriculture.” The name JA has been used since 1993. Before that, Japanese agricultural cooperatives called themselves Keito (its literal meaning is system). For simplicity, this study uses JA for the entire postwar period.
[2] See Godo (2014a) for an overview of the JA system.
[3] The significance of non-farmers in JA is discussed in Godo (2014b).
[4] This paper’s estimates for 1960–2011 are the same as those in Godo (2015).
[5] Godo (2013) provides a compact review of the history of Japan’s rice policy in the postwar period.
[6] Figure 7 displays the share of rice in JA’s total distribution of agricultural products, obtained by dividing column (2) of Table 3 by column (3) of Table 2. Likewise, dividing column (1) of Table 3 by column (1) of Table 2 gives the percentage of rice in the total value of agricultural products.