Public Sector Investments in Science, Technology and Innovation for
Inclusive Growth and Competitive Economy in the Philippines:
A Focus on Agriculture[1]
Albert Perez Aquino, Aleta Belissa D. Correa,
Jose Raymond A. Manalo andPatricio S. Faylon[2]
Introduction
Fuelled by robust economic growth in recent years, the Philippines expects to continue its current economic trajectory. Its gross domestic product (GDP) grew at an average annual rate of 5.35% during the period 2003-2013, with the latest four years registering higher growth of 6.31% (Table 1). Its GDP growth even outperformed its ASEAN-5[3] neighbors in 2012-2013. Its economic performance, along with other macroeconomic fundamentals, paved the way for the country to achieve its first ever investment-grade credit ratings in 2013[4].
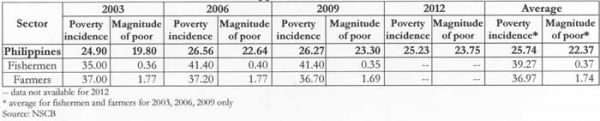
However, while these improvements in the macro-economy are non-debatable, not all Filipinos are convinced that these translated to significant improvements in their economic well-being, as well. Some economic indicators seem to buttress their claim. For instance, the average growth rate of per capita GDP was only 3.1% compared to Indonesia’s and Vietnam’s 4.2% and 4.8%, respectively, during 2008-2012 (Table 2). Unemployment rate hovered at 7%, the highest in the ASEAN-5, and underemployment was experienced by around 20% of all Filipinos during 2012-2013 (PSA, 2014). Poverty befell at least a quarter of total population in 2003 – 2012 (Table 3). It has remained fairly stagnant, and a drastic reduction in poverty incidence in the near future may not be in the offing. Moreover, agriculture was burdened with a lot of poor producers (37% of farmers and 39% of fisher folk) of food for the entire country.
Table 1. Gross Domestic Product (GDP) (in million PhP) and growth rates (%), Philippines, 2003-2013.
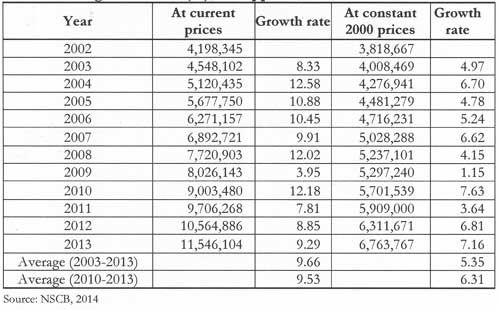
Table 2. Annual Growth rate of per capita GDP, ASEAN-5 countries, 2008-2012).
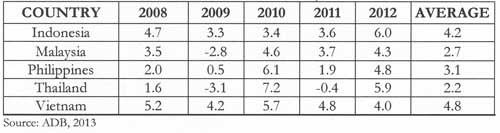
Table 3. Poverty Incidence (in %) and magnitude of poor population (in millions), Philippines, 2003-2012.
This paper focuses on agriculture and examines how investments in science, technology and innovation (STI) address the twin goals of inclusive development in and competitiveness of the sector. It highlights the role of major public sector driven STI in improving the competitiveness of Philippine agriculture. It also analyzes S&T investment in terms of priorities, allocations and portfolios to determine its ability to promote inclusive development across agriculture’s poor, albeit numerous, stakeholders. It concludes by re-iterating the strategic role of STI in agricultural development. As a backdrop to all of these, it provides overviews of the country’s medium-term development plan and state of STI in the Philippines.
Economic development plan, competitiveness and inclusive growth
The Philippine Development Plan (PDP) 2011-2016 of the administration of President Benigno S. Aquino III provides an inclusive growth and poverty reduction framework. It defines inclusive growth as one “that is rapid enough to matter, given the country’s large population, geographical differences, and social complexity. It is sustained growth that creates jobs, draws the majority into the economic and social mainstream, and continuously reduces mass poverty” (NEDA). It also acknowledges that several measures of competitiveness reveal fundamental weaknesses compared to the rest of the world. It emphasizes that strategies shall therefore be pursued to help raise the competitiveness of industries by improving business environment, raising productivity and efficiency, and inculcating quality consciousness among manufacturers and producers to offer quality goods and services comparable to global brands.
Further, the Aquino Administration’s key results areas (KRAs) focus on good governance and anti-corruption, human development and poverty reduction, economic development, security, justice and peace, and climate change adaptation/mitigation. Moreover, its 16-point agenda are anchored on a commitment to transformational leadership, economy, government service, gender equity, peace and order, and the environment. Among these are quoted below (Official Gazette, July 25, 2010):
“(7.) from treating the rural economy as just a source of problems to recognizing farms and rural enterprises as vital to achieving food security and more equitable economic growth, worthy of re-investment for sustained productivity, and
(8.) from government anti-poverty programs that instill a dole-out mentality to well-considered programs that build capacity and create opportunity among the poor and the marginalized in the country.”
One way to gauge a nation’s state of well-being, which may be a direct consequence of economic development planning and action, is by referring to the United Nations Development Programme (UNDP) Human Development Index[5] (HDI). The Philippine HDI has not notched significantly past the 0.65 mark, making the country in the category of “medium human development” together with the ASEAN–5 (except Malaysia which belongs to the “high human development” group) for the period 2012 (Table 4).
Table 4. Human Development Index (HDI) rank and value, selected countries, 2012.
The Global Competitiveness Index
[6] (GCI) of the World Economic Forum (WEF) shows the Philippines improving by 10 notches in its ranking from rank 75/142 (2011-2012) to 65/144 (2012-2013) (Table 5). In the recent Global Competitiveness Report (GCR) (2013-2014), the Philippines moved upward to rank 59/148. For the past three years, its highest ranking can be seen in the 10
th Pillar: Market size (rank 35, on average), which consists of domestic market size and foreign market size indices. Moreover, the report also identified the most problematic factors for doing business in the country. In 2013, inadequate supply of infrastructure (21.1%), corruption (17.8%), and inefficient government bureaucracy (16.9%) were the top three factors identified by business executives in the country (Schwab, ed., 2013).
Table 5. Global competitiveness ranking of the Philippines, 2011-2014.
Science, Technology and Innovation in the Philippines
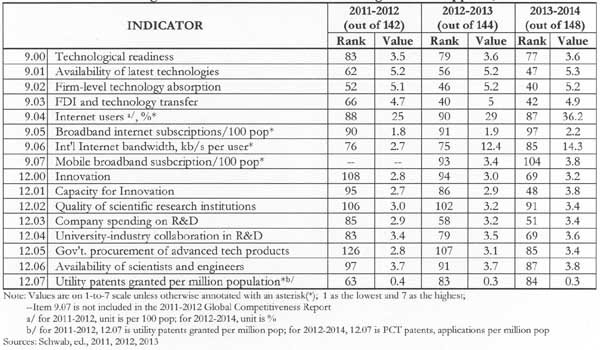
The leap in overall competitiveness ranking is due in part to improvement in the technological readiness and innovation index of the country (Table 6). In the past three years, the Philippines has been improved its technological readiness from 83/142 (2011-2012) to 77/148 (2013-2014). Improvement was much remarkable in the innovation pillar index from 108 (2011-2012) to 69 (2013-2014). The Philippines also improved greatly in its capacity for innovation (from 95/142 to 48/148), government procurement of advanced tech products (from 126/142 to 85/148), and company spending on R&D (from 85/142 to 51/148).
Table 6. Technological readiness and innovation ranking of the Philippines, 2011-2014.
However, its investments in STI paled in comparison with those of select “medium human development” ASEAN countries and China (Table 7). Further, the Philippines’ 0.1% of its GDP for R&D was very low compared to Japan’s and Korea’s 3.4%. Number of researchers (per million people) is also low in the Philippines (78.5) compared with Singapore’s (5,834.0). However, in terms of graduates in science and engineering, the Philippines’ (23.8% of total graduates) was higher compared to those of other countries with very high human development.
Based on regular surveys commissioned by the DOST, R&D was largely private sector led (Table 8). Overall, 64 – 73% R&D investments came from the private sector, the rest were public funds in 2002 – 2011. For higher educational institutions (HEIs) as major STI entities, more R&D investments came from public HEIs since they receive annual subsidies from the National Treasury.
Table 7. Research and development (R&D) information, selected countries, selected years.
Table 8. National R&D expenditures by sector (In Million PhP) and Percentage to Total, 2002-2011.
Overview of Philippine agriculture
Agriculture remains to be a vital sector of the Philippine economy. It not only provides food but also supplies raw materials and other products used in manufacturing and other industries. It provides employment to about 12 million Filipinos (PSA, 2014).
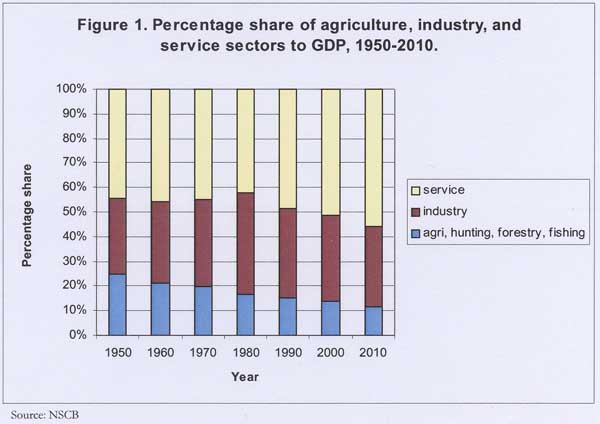
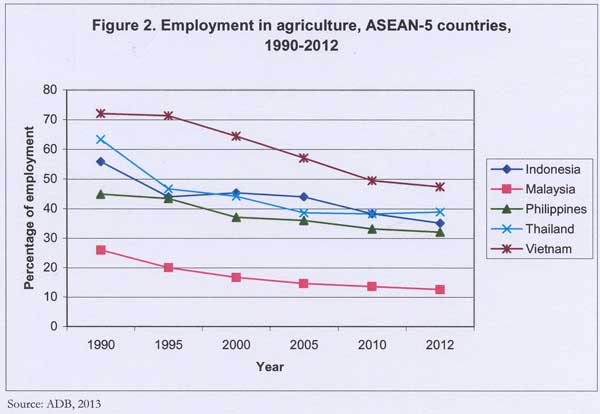
However, for the past 60 years (1950-2010), the percent share of gross value added (GVA) in agriculture, hunting, forestry, and fishing (AHFF) to GDP has declined from 25% (1950) to 12% (2010). The percent share of the services sector increased from 45% (1950) to 56% (2010) (Figure 1). Employment in agriculture is also on the downtrend, not only in the Philippines but also in Indonesia, Malaysia, Thailand, and Vietnam (Figure 2). In 1990, agriculture contributed 45% to total employment but slid to 32% in 2012.
In 2013, the value of production in agriculture amounted to PhP1.46 trillion (at current prices), a 3.5% increase from the 2012 value of PhP1.41 trillion. This came from crops (56%), livestock (16%), poultry (12%) and fisheries (16%). Among crops, paddy rice (21.5%) had the most contribution in terms of value of production (at current prices), followed by banana (8%), corn, (6.2%), and coconut (5.6%). However, only paddy rice had an increase (2.26%) in the volume of production in 2013 among the major crops. On the other hand, swine (13.1%), chicken (8.9%), and milkfish (2.4%) dominated the livestock, poultry, and fisheries sub sectors, respectively. Among these, chicken (5.01) had the biggest increase in the volume of production compared to the increase in swine’s (1.95%) and milkfish’s (3.7%) in 2013 (BAS, 2014).
Approved local and foreign direct investment in agriculture, forestry, and fishing sector was just 0.49% of total investments in 2010. This even decreased to 0.24% in 2011 but increased in 2012 (1.20%). Despite the increase in the percent share in total investments, 1.2% of total local and foreign direct investment is meager considering the sector’s economic importance (Table 9).
Table 9. Percentage share of agriculture, forestry and fishing investments to total approved local and foreign direct investments, 2010-2012.
Science, technology and innovation in agriculture
On aggregate, increases in agricultural production were due in part to productivity improvements. In turn, technological change along the agricultural supply chain contributed to increased overall productivities. Agricultural production systems became more efficient in the use of inputs (seed, fertilizer, water, pesticides, etc.) and in minimizing production losses. Post-production, processing and distribution systems adopted/adapted efficiency-enhancing technologies and processes, e.g., mechanization and waste minimization. Most of these technologies and processes were outputs of research and development (R&D) projects and activities of research institutes.
For public sector led R&D, two agencies mandated to coordinate and manage agricultural research in the Philippines, the Philippine Council for Agriculture, Aquatic and Natural Resources Research and Development under the Department of Science and Technology (PCAARRD-DOST) and the Bureau of Agricultural Research under the Department of Agriculture (DA-BAR), provided significant grants for agricultural STI in 2010-2014 (Figure 3). For 2010-2013, the total budget for 2013 (from the National Treasury) of these two agencies increased tremendously to more than 300% of their 2010’s. Although, the average annual growth rate of total budget hovered around 47%. On average, PCAARRD contributed 41% to total budget, and the rest came from BAR.

The DOST commissioned surveys mentioned previously show that agricultural R&D is not the sole purview of public organizations. Research and development expenditures for agricultural production and technology[7] in 2002-2011 show that public investment (government and public HEIs)[8] comprised about 88%, on average, and the rest came from the private sector, i.e., private business firms and private HEIs (Table 10). This is opposite of the private-sector led national level R&D investment shown previously in Table 8. For public R&D, one notes the significance of public HEIs[9] contribution to agricultural R&D, which registered almost 43% of total, on average.
Table 10. R&D expenditures in agricultural production and technology* in the government, and private sectors, 2003 to 2011 (in million PhP).
Science, technology and innovation for inclusive rural development and competitive agriculture: The PCAARRD industry strategic science and technology plan
The approach of PCAARRD[10] to influence and direct investments in agricultural STI is instructive. Not only because it is a major conduit of significant public funds for agricultural STI (as shown previously in Figure 3) but it also highlights the role of public sector agencies in terms of providing “public goods and services” owing largely to lack or absence of market signals/incentives. Equally important, it showcases how PCAARRD, as a sectoral S&T planning and coordinating agency, is addressing directly the twin goals of inclusive development and competitiveness of the country’s key economic sectors by supporting key STI solutions. It operationalizes the PCAARRD Corporate Plan, the agency’s medium term blueprint for STI in agriculture, through its support, coordination and funding of the Industry Strategic S&T Plan (ISP).
The ISP is PCAARRD’s strategy to align its R&D agenda with the harmonized National R&D Agenda[11]. It provides the collective vision and direction for all actors and key players in the national innovation system (NIS) working together towards providing STI solutions to address the challenges and opportunities in the agriculture, aquatic and natural resources (AANR) sectors. It was developed by PCAARRD, in active collaboration with key actors of the agriculture NIS, for each of the 35 commodities under crops, agro-forestry, livestock and poultry, inland aquatic, and marine resources. It serves as blueprint to achieve the national R&D vision and focus PCAARRD’s bundle of interventions under its four banner programs: (1) Strategic R&D; (2) R&D Results Utilization; (3) Policy Research and Advocacy; and (4) Capability Building (PCAARRD, 2013). Moreover, since it supports the harmonized National R&D agenda, it can be categorized under any of the following key result areas of the Aquino government, as follows: (1) poverty alleviation and inclusive growth (food security, countryside development, competitiveness, and biodiversity conservation and sustainable development), (2) climate change mitigation/adaptation and disaster risk reduction and management (water resource management, smart agriculture/fisheries, and disaster risk reduction); and (3) transparency and good governance (Figure4).
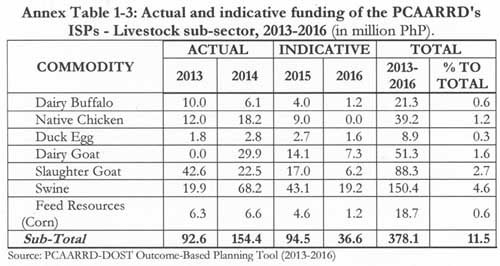
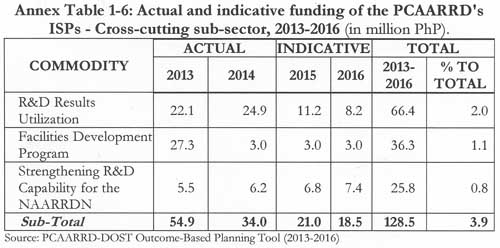
The actual and indicative investments of PCAARRD in all ISPs shall amount to almost PhP 3.3 B for the period 2013-2016 (Table 11).[12] The actual investments (2013-2014) comprised about 67% of total, the remaining amount will still have to be negotiated with the Department of Budget and Management (DBM) and eventually, to be approved by both Houses of Congress during regular annual planning and budgeting cycles of 2015 and 2016. More than 50% of investments are earmarked for STI for crops and marine resources, with the crops sub-sector allocation amounting to 33% of total investment. Specific to the crops sub-sector, most of the ISPs focus on smallholder farming, the main source of livelihoods among small, marginal and landless farming households cultivating rice, vegetables and/or legumes, among others. With the exception of sugarcane, crops grown extensively like abaca, banana, coconut, coffee, mango and other tropical fruits are also characteristically smallholder agriculture, relying on a few hectares of land, in contrast to the plantation-type production systems of multi-national agribusiness firms or in other countries. For instance, the ISP on banana is mainly devoted to promoting STI to small farmers growing non-Cavendish banana (a variety of banana planted by large agribusiness firms for the export market) varieties (fruit and cooking) meant for the domestic market.
Figure 4. Harmonized national R&D agenda
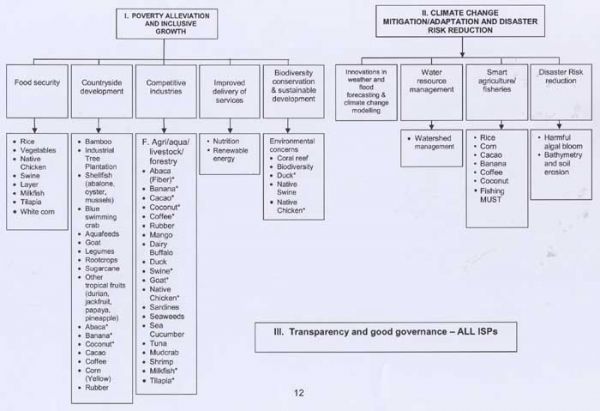
Table 11. Actual and indicative funding of the PCAARRD's ISPs (per sub-sector), 2013-2016 (in million Php).
The ISPs for livestock sub-sector also prioritize PCAARRD investments for livestock production systems of small farmers. Hence, STI on poultry and cattle are conspicuously not considered since major STI efforts are funded and conducted by the private sector. Solving the production constraints and improving efficiency of the supply chains for native chicken and goats through appropriate STI ultimately redounds to improving the incomes of native chicken and goat raisers, most of whom are poor and marginal farming households.
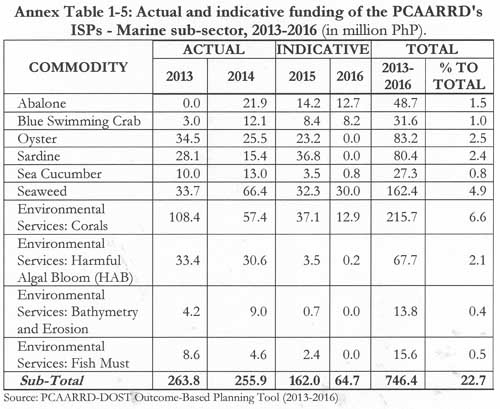
Further, some ISPs specifically focused STI on conservation and sustainable management of (environmental and other) resources considered public commons. These pertain to environmental goods (and bads) and services, e.g., biodiversity, corals, watersheds, climate change, and erosion.
Attempt was also made to classify these ISPs according to the key result areas of the DOST Harmonized R&D Agenda as listed in Figure 4. Most of the ISPs address the national development goal of poverty alleviation and inclusive growth. Since ultimate beneficiaries of the downstream end of STI continuum reside in rural areas, most ISPs aim to promote vibrant rural economies (and sustained countryside development) through STI that will improve the efficiencies of farms/enterprises and relevant agricultural supply chains.
A cursory examination of the impact pathways of the various ISPs shows that most STI aim to improve current productivities of farms and other production-oriented livelihoods or enterprises (Table 12). These STI, once adopted or scaled up, are meant to: (1) approximate well-established productivity frontiers or benchmarks, (2) improve quality of produce and other products, (3) minimize production and post-production losses due to pest and diseases, and (4) improve farm input use efficiencies. Hence, these translate ultimately to improved profitability and if unavoidable, to minimized farm or business loss.
Table 12. ISP desired outcomes, target beneficiaries, and geographical areas covered by sub-sector, 2013-2020.
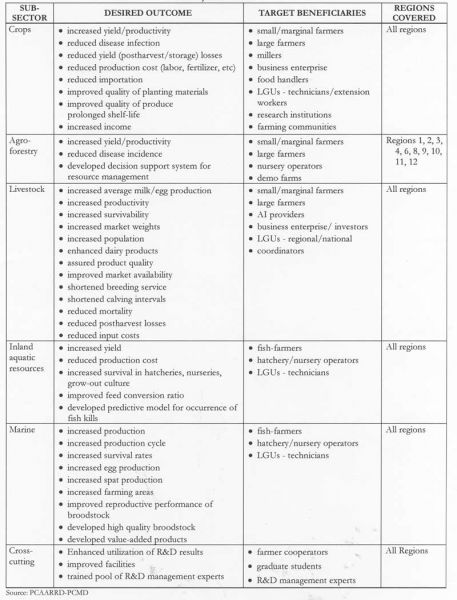
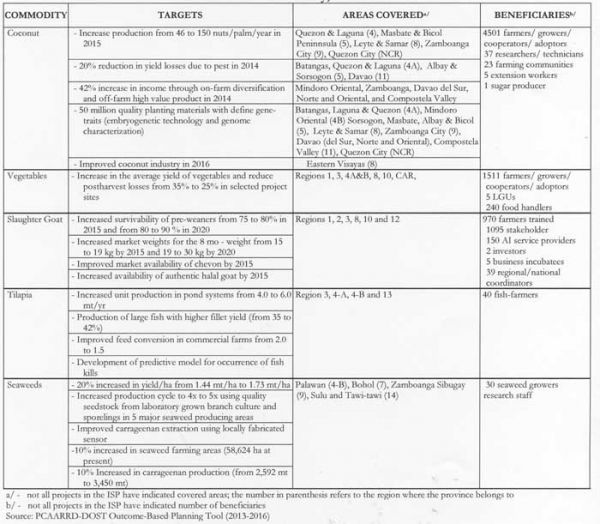
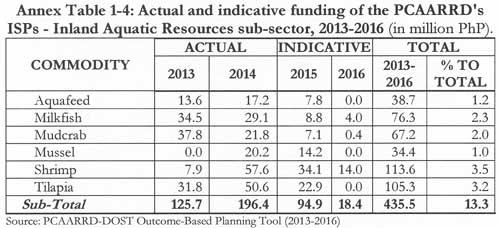
Table 13 shows a sample of ISPs with their corresponding STI targets (outputs and/or outcomes), geographical area coverage, and beneficiaries. For instance, the coconut ISP hopes to benefit 4,500 small farmers in major coconut growing provinces through STI that can improve by almost 3 times by 2015 their current average nut harvest of only 46 nuts per tree per year and can reduce harvest losses by 20%, on average, in 2014. For the vegetable ISP, it aims to help 1,500 farmers increase their harvest and reduce their post-harvest losses from 35% to 25%. The slaughter goat ISP promises to help at least 970 goat raisers (in 6 regions of the country) increase to 90% the survivability of their pre-weaners and increase the marketable weight of 8-month old goats by 100% in 2020 from the current 15 kilograms. The tilapia ISP seeks to improve the current fish yield of pond production systems from 4 to 6 metric tons per year. And lastly, the seaweed ISP hopes to increase by 20% the current yield of 1.44 metric tons per hectare of seaweed farmers, most of whom are Muslim-Filipinos of the three Mindanao Provinces of Zamboanga Sibugay, Sulu and Tawi-Tawi.
Table 13. Selected ISP desired outcomes, target beneficiaries and geographical areas covered by sub-sector and commodity, 2013-2020
Conclusion
The role of science, technology and innovation (STI) in underpinning and sustaining the country’s economic progress cannot be overemphasized. STI buttress the development and dynamism of agriculture, industry and even, services sector. Hence, the robust growth in national income and output in recent years could be attributed, albeit partly, to STI.
Yet the Philippines chronically under-invests in STI. Its 0.1% of GDP-expenditure for R&D is way below the 1% of GDP benchmark set by the World Bank and UNESCO for developing economies. It is also way below Thailand’s 0.2% and Malaysia’s 0.6%. It also relies heavily on its private sector for at least two-thirds of national R&D investments.
It is in the agricultural sector where public STI is as much felt as it is paramount. Public sector funding is the key investment driver in agricultural STI. It relies on government research institutes and public universities to conduct STI programs and projects whose outputs (in terms of information, technologies and services) once adopted/adapted/scaled up by the ultimate beneficiaries, most of whom are small farmers, fisher folks and other entrepreneurs, can improve significantly their own production system and profitability, and consequently, their household income and welfare.
Addressing the twin national development goals of inclusive growth and competitiveness must, therefore, necessarily focus on agriculture since it is not only the bedrock of a vibrant rural economy but more importantly, the main source of livelihood for countless rural folks, many of whom are poor or worse, belong to the marginalized sector of Philippine society. And for this to happen, public STI is imperative.
References
Asian Development Bank (ADB). 2013a. Asian Development Outlook 2013, Asia’s Energy Challenge.. Mandaluyong City: ADB.
___. 2013b. Key Indicators for Asia and the Pacific 2013. Asia’s Transformation: Where to, How, and How Fast? Mandaluyong City:ADB.
Bureau of Agricultural Statistics. 2014. Performance of Philippine Agriculture, January-December 2013. Retrieved from http://www.bas.gov.ph/?id=710&ids=download_now&p=1&dami=10&srt=dateadd
Department of Agriculture-Bureau of Agricultural Research (DA-BAR). Statement of Allotment, Obligation, and Balances (SAOB) 2010. Retrieved from http://www.bar.gov.ph/downloadables/transparency%20seal/2010_SAOB.pdf
___. SAOB 2011. Retrieved from http://www.bar.gov.ph/downloadables/transparency%20seal/2011_SAOB.pdf
___. SAOB 2012. Retrieved from http://www.bar.gov.ph/downloadables/transparency%20seal/2012_SAOB.pdf
___. SAOB 2013. Retrieved from
http://www.bar.gov.ph/downloadables/transparency%20seal/2013_SAOB.pdf
Department of Budget and Management (DBM). General Appropriations Act (GAA) 2010.Retrieved from .http://www.dbm.gov.ph/wpcontent/uploads/GAA/GAA2010//DOST/L.pdf;
___. GAA 2011. Retrieved from
http://www.dbm.gov.ph/wp-content/uploads/GAA/GAA2011/DOST/L.pdf
___. GAA 2012. Retrieved from
http://www.dbm.gov.ph/wp-content/uploads/GAA/GAA2012/DOST/L.pdf
___. GAA 2013.
Department of Science and Technology, Planning and Evaluation Service-S&T Resource Assessment and Evaluation Division (DOST, PES-STRAED). 2012. Compendium of Science and Technology Statistics.
____2013. Results of the 2011 Survey of R&D Expenditures and Human Resources and Updates on R&D Indicators in the Philippines. Presented by PES-STRAED during the 12th National Convention on Statistics held on October 1-2, 2013 at the EDSA Shangri-La Hotel, Mandaluyong City.
____Harmonized National R&D Agenda. PDF File.
Malik, K., ed. 2013. Human Development Report 2013. The Rise of the South: Human Progress in a Diverse World. New York: United Nations Development Programme (UNDP).
National Economic and Development Authority (NEDA). Philippine Development Plan (PDP) 2011-2016. Retrieved from http://www.neda.gov.ph/wp-content/uploads/2013/09/CHAPTER-1.pdf
____. Socio-economic Report 2010-2012: The first two years of the Aquino administration. Retrieved from http://www.neda.gov.ph/wp-content/uploads/2013/10/SER2010-2012.pdf
National Statistics Coordination Board (NSCB). 2012. “Fishermen still the poorest sector in 2009 ” (PR-201206-SS2-01, Posted 07 June 2012). Retrieved from
http://www.nscb.gov.ph/pressreleases/2012/PR-201206-SS2-01_pov2009.asp
____. 2013. 2012 Full Year Official Poverty Statistics (as of 09 December 2013). Retrieved from http://nscb.gov.ph/poverty/dataCharts.asp
____. 2014. National Accounts of the Philippines (as of January 2014). Retrieved from
http://www.nscb.gov.ph/sna/2013/4th2013/tables/1Q4-Rev_Summary_93SNA.pdf
Official Gazette, 2010, July 25. A Social Contract with the Filipino People. Retrieved from http://www.gov.ph/about/gov/exec/bsaiii/platform-of-government/
Philippine Council for Agriculture Aquatic and Natural Resources Research and Development (PCAARRD). 2013. 2012 PCAARRD annual report: Working together towards greater productivity. Los Baños, Laguna: PCAARRD-DOST.
____. Policy Coordination and Monitoring Division (PCMD). PCAARRD-DOST Outcome-based planning tool (2013-2016). (Unpublished).
____. ISP Classification based on the Harmonized National R&D Agenda. (Unpublished material from Policy Coordination and Monitoring Division).
Philippine Statistics Authority (PSA). The 2013 Employment Situation (The Year in Review). LABSTAT Updates, 18, No. 2.January 2014.Retrieved from
http://www.bles.dole.gov.ph/PUBLICATIONS/LABSTAT%20UPDATES/vol18_2.pdf
Schwab, K. ed. 2011. The Global Competitiveness Report 2011-2012. Geneva: World Economic Forum.
____. 2012. The Global Competitiveness Report 2012-2013. Geneva: World Economic Forum.
____. 2013. The Global Competitiveness Report 2013-2014. Geneva: World Economic Forum.
[1] Policy paper submitted to the Food and Fertilizer Technology Center (FFTC) for the project titled “Asia-Pacific Information Platform in Agricultural Policy”. The original paper was presented during the “Philippine Studies Conference in Japan” held at the Southeast Asian Studies Center, Kyoto University, Kyoto, Japan on 28 February – 01 March 2014.
[2] Philippine point person to the FFTC Project on Asia-Pacific Information Platform in Agricultural Policy and Director, Science Research Specialist II, Science Research Analyst, and Executive Director, respectively, Philippine Council for Agriculture, Aquatic and Natural Resources Research and Development (PCAARRD) of the Department of Science and Technology (DOST), Los Baños, Laguna, the Philippines. The authors acknowledge with appreciation the technical assistance and data provided by many technical officers and staff of PCAARRD. Any error, however, in the interpretation and analysis in this work is the sole responsibility of the authors.
[3] ASEAN-5 refers to Indonesia, Malaysia, Philippines, Thailand, and Vietnam; and should not be construed to refer to the first original 5 country-member (to include Singapore).
[4] Credit rating is an evaluation (by a credit rating agency) of the credit worthiness (ability to pay back the debt and the likelihood of default) of a debtor (i.e., a sovereign government). An investment credit rating should give the country more access to cheaper credit because investors may now consider its debt to be less risky.
[5] HDI is a composite index measuring average achievement in three basic dimensions of human development – a long and healthy life, knowledge, and a decent standard of living (Malik, ed., 2013).
[6] In terms of competitiveness, the GCI of a country is measured annually. The WEF defines competitiveness as the set of institutions, policies, and factors that determine the level of productivity of a country. The GCI has 12 pillars of competitiveness categorized under basic requirements, efficiency enhancers, and innovation and sophistication factors.
[7] Agricultural production and technology covers research on the promotion of agriculture, forestry, fisheries and foodstuff production. It includes: research on chemical fertilizers, biocides, biological pest control and the mechanization of agriculture; research on the impact of agricultural and forestry activities on the environment; research in the field of developing food productivity and technology (Compendium of Science and Technology Statistics, DOST 2012).
[8] Government research organizations (e.g., Philippine Rice Institute, Ecosystems Research and Development Bureau, Food and Nutrition Institute) are line agencies or bureaus under a specific line department (e.g., DA, DENR and DOST) mandated to implement R&D or STI on a specific commodity, industry or theme and with tenured scientists, researchers and research support staff.
[9] They are also referred to as state colleges and universities or national university in the case of the University of the Philippines System. R&D is one of the core functions of HEIs aside from teaching and extension. Most researches done at HEIs are, however, done by tenured/contract faculty members who are also required to teach some courses. The number of tenured researcher or scientist positions is few relative to faculty members.
[10] It is the DOST sectoral S&T planning council for agriculture mandated by law (Executive Order No. 128 Series of 1986) to formulate, coordinate, monitor and evaluate, and generate resources for S&T plans and programs for the development of the agricultural sector of the Philippines.
[11] Under the DOST, the harmonized National R&D Agenda is aligned with the Philippine Development Plan (PDP) and the National Science and Technology Plan 2020. For 2013-2017, the Agenda supports the present administration’s five key Results Areas (KRAs), focusing on poverty alleviation and inclusive growth, and climate change adaptation/mitigation and disaster risk reduction (DOST).
[12] PCAARRD started to provide grants and/or leverage funds to key implementers of the agriculture NIS from 2011. However, consolidating 2011-2012 financial records was not easy and hence, only 2013-2016 data are included in the tabulation.
|
Date submitted: March 25, 2014
Reviewed, edited and uploaded: March 26, 2014
|

Public Sector Investments in Science, Technology and Innovation for Inclusive Growth and Competitive Economy in the Philippines: A Focus on Agriculture
Public Sector Investments in Science, Technology and Innovation for
Inclusive Growth and Competitive Economy in the Philippines:
A Focus on Agriculture[1]
Albert Perez Aquino, Aleta Belissa D. Correa,
Jose Raymond A. Manalo andPatricio S. Faylon[2]
Introduction
Fuelled by robust economic growth in recent years, the Philippines expects to continue its current economic trajectory. Its gross domestic product (GDP) grew at an average annual rate of 5.35% during the period 2003-2013, with the latest four years registering higher growth of 6.31% (Table 1). Its GDP growth even outperformed its ASEAN-5[3] neighbors in 2012-2013. Its economic performance, along with other macroeconomic fundamentals, paved the way for the country to achieve its first ever investment-grade credit ratings in 2013[4].
However, while these improvements in the macro-economy are non-debatable, not all Filipinos are convinced that these translated to significant improvements in their economic well-being, as well. Some economic indicators seem to buttress their claim. For instance, the average growth rate of per capita GDP was only 3.1% compared to Indonesia’s and Vietnam’s 4.2% and 4.8%, respectively, during 2008-2012 (Table 2). Unemployment rate hovered at 7%, the highest in the ASEAN-5, and underemployment was experienced by around 20% of all Filipinos during 2012-2013 (PSA, 2014). Poverty befell at least a quarter of total population in 2003 – 2012 (Table 3). It has remained fairly stagnant, and a drastic reduction in poverty incidence in the near future may not be in the offing. Moreover, agriculture was burdened with a lot of poor producers (37% of farmers and 39% of fisher folk) of food for the entire country.
Table 1. Gross Domestic Product (GDP) (in million PhP) and growth rates (%), Philippines, 2003-2013.
Table 2. Annual Growth rate of per capita GDP, ASEAN-5 countries, 2008-2012).
Table 3. Poverty Incidence (in %) and magnitude of poor population (in millions), Philippines, 2003-2012.
This paper focuses on agriculture and examines how investments in science, technology and innovation (STI) address the twin goals of inclusive development in and competitiveness of the sector. It highlights the role of major public sector driven STI in improving the competitiveness of Philippine agriculture. It also analyzes S&T investment in terms of priorities, allocations and portfolios to determine its ability to promote inclusive development across agriculture’s poor, albeit numerous, stakeholders. It concludes by re-iterating the strategic role of STI in agricultural development. As a backdrop to all of these, it provides overviews of the country’s medium-term development plan and state of STI in the Philippines.
Economic development plan, competitiveness and inclusive growth
The Philippine Development Plan (PDP) 2011-2016 of the administration of President Benigno S. Aquino III provides an inclusive growth and poverty reduction framework. It defines inclusive growth as one “that is rapid enough to matter, given the country’s large population, geographical differences, and social complexity. It is sustained growth that creates jobs, draws the majority into the economic and social mainstream, and continuously reduces mass poverty” (NEDA). It also acknowledges that several measures of competitiveness reveal fundamental weaknesses compared to the rest of the world. It emphasizes that strategies shall therefore be pursued to help raise the competitiveness of industries by improving business environment, raising productivity and efficiency, and inculcating quality consciousness among manufacturers and producers to offer quality goods and services comparable to global brands.
Further, the Aquino Administration’s key results areas (KRAs) focus on good governance and anti-corruption, human development and poverty reduction, economic development, security, justice and peace, and climate change adaptation/mitigation. Moreover, its 16-point agenda are anchored on a commitment to transformational leadership, economy, government service, gender equity, peace and order, and the environment. Among these are quoted below (Official Gazette, July 25, 2010):
“(7.) from treating the rural economy as just a source of problems to recognizing farms and rural enterprises as vital to achieving food security and more equitable economic growth, worthy of re-investment for sustained productivity, and
(8.) from government anti-poverty programs that instill a dole-out mentality to well-considered programs that build capacity and create opportunity among the poor and the marginalized in the country.”
One way to gauge a nation’s state of well-being, which may be a direct consequence of economic development planning and action, is by referring to the United Nations Development Programme (UNDP) Human Development Index[5] (HDI). The Philippine HDI has not notched significantly past the 0.65 mark, making the country in the category of “medium human development” together with the ASEAN–5 (except Malaysia which belongs to the “high human development” group) for the period 2012 (Table 4).
Table 4. Human Development Index (HDI) rank and value, selected countries, 2012.
Science, Technology and Innovation in the Philippines
The leap in overall competitiveness ranking is due in part to improvement in the technological readiness and innovation index of the country (Table 6). In the past three years, the Philippines has been improved its technological readiness from 83/142 (2011-2012) to 77/148 (2013-2014). Improvement was much remarkable in the innovation pillar index from 108 (2011-2012) to 69 (2013-2014). The Philippines also improved greatly in its capacity for innovation (from 95/142 to 48/148), government procurement of advanced tech products (from 126/142 to 85/148), and company spending on R&D (from 85/142 to 51/148).
Table 6. Technological readiness and innovation ranking of the Philippines, 2011-2014.
However, its investments in STI paled in comparison with those of select “medium human development” ASEAN countries and China (Table 7). Further, the Philippines’ 0.1% of its GDP for R&D was very low compared to Japan’s and Korea’s 3.4%. Number of researchers (per million people) is also low in the Philippines (78.5) compared with Singapore’s (5,834.0). However, in terms of graduates in science and engineering, the Philippines’ (23.8% of total graduates) was higher compared to those of other countries with very high human development.
Based on regular surveys commissioned by the DOST, R&D was largely private sector led (Table 8). Overall, 64 – 73% R&D investments came from the private sector, the rest were public funds in 2002 – 2011. For higher educational institutions (HEIs) as major STI entities, more R&D investments came from public HEIs since they receive annual subsidies from the National Treasury.
Table 7. Research and development (R&D) information, selected countries, selected years.
Table 8. National R&D expenditures by sector (In Million PhP) and Percentage to Total, 2002-2011.
Overview of Philippine agriculture
Agriculture remains to be a vital sector of the Philippine economy. It not only provides food but also supplies raw materials and other products used in manufacturing and other industries. It provides employment to about 12 million Filipinos (PSA, 2014).
However, for the past 60 years (1950-2010), the percent share of gross value added (GVA) in agriculture, hunting, forestry, and fishing (AHFF) to GDP has declined from 25% (1950) to 12% (2010). The percent share of the services sector increased from 45% (1950) to 56% (2010) (Figure 1). Employment in agriculture is also on the downtrend, not only in the Philippines but also in Indonesia, Malaysia, Thailand, and Vietnam (Figure 2). In 1990, agriculture contributed 45% to total employment but slid to 32% in 2012.
In 2013, the value of production in agriculture amounted to PhP1.46 trillion (at current prices), a 3.5% increase from the 2012 value of PhP1.41 trillion. This came from crops (56%), livestock (16%), poultry (12%) and fisheries (16%). Among crops, paddy rice (21.5%) had the most contribution in terms of value of production (at current prices), followed by banana (8%), corn, (6.2%), and coconut (5.6%). However, only paddy rice had an increase (2.26%) in the volume of production in 2013 among the major crops. On the other hand, swine (13.1%), chicken (8.9%), and milkfish (2.4%) dominated the livestock, poultry, and fisheries sub sectors, respectively. Among these, chicken (5.01) had the biggest increase in the volume of production compared to the increase in swine’s (1.95%) and milkfish’s (3.7%) in 2013 (BAS, 2014).
Approved local and foreign direct investment in agriculture, forestry, and fishing sector was just 0.49% of total investments in 2010. This even decreased to 0.24% in 2011 but increased in 2012 (1.20%). Despite the increase in the percent share in total investments, 1.2% of total local and foreign direct investment is meager considering the sector’s economic importance (Table 9).
Table 9. Percentage share of agriculture, forestry and fishing investments to total approved local and foreign direct investments, 2010-2012.
Science, technology and innovation in agriculture
On aggregate, increases in agricultural production were due in part to productivity improvements. In turn, technological change along the agricultural supply chain contributed to increased overall productivities. Agricultural production systems became more efficient in the use of inputs (seed, fertilizer, water, pesticides, etc.) and in minimizing production losses. Post-production, processing and distribution systems adopted/adapted efficiency-enhancing technologies and processes, e.g., mechanization and waste minimization. Most of these technologies and processes were outputs of research and development (R&D) projects and activities of research institutes.
For public sector led R&D, two agencies mandated to coordinate and manage agricultural research in the Philippines, the Philippine Council for Agriculture, Aquatic and Natural Resources Research and Development under the Department of Science and Technology (PCAARRD-DOST) and the Bureau of Agricultural Research under the Department of Agriculture (DA-BAR), provided significant grants for agricultural STI in 2010-2014 (Figure 3). For 2010-2013, the total budget for 2013 (from the National Treasury) of these two agencies increased tremendously to more than 300% of their 2010’s. Although, the average annual growth rate of total budget hovered around 47%. On average, PCAARRD contributed 41% to total budget, and the rest came from BAR.
The DOST commissioned surveys mentioned previously show that agricultural R&D is not the sole purview of public organizations. Research and development expenditures for agricultural production and technology[7] in 2002-2011 show that public investment (government and public HEIs)[8] comprised about 88%, on average, and the rest came from the private sector, i.e., private business firms and private HEIs (Table 10). This is opposite of the private-sector led national level R&D investment shown previously in Table 8. For public R&D, one notes the significance of public HEIs[9] contribution to agricultural R&D, which registered almost 43% of total, on average.
Table 10. R&D expenditures in agricultural production and technology* in the government, and private sectors, 2003 to 2011 (in million PhP).
Science, technology and innovation for inclusive rural development and competitive agriculture: The PCAARRD industry strategic science and technology plan
The approach of PCAARRD[10] to influence and direct investments in agricultural STI is instructive. Not only because it is a major conduit of significant public funds for agricultural STI (as shown previously in Figure 3) but it also highlights the role of public sector agencies in terms of providing “public goods and services” owing largely to lack or absence of market signals/incentives. Equally important, it showcases how PCAARRD, as a sectoral S&T planning and coordinating agency, is addressing directly the twin goals of inclusive development and competitiveness of the country’s key economic sectors by supporting key STI solutions. It operationalizes the PCAARRD Corporate Plan, the agency’s medium term blueprint for STI in agriculture, through its support, coordination and funding of the Industry Strategic S&T Plan (ISP).
The ISP is PCAARRD’s strategy to align its R&D agenda with the harmonized National R&D Agenda[11]. It provides the collective vision and direction for all actors and key players in the national innovation system (NIS) working together towards providing STI solutions to address the challenges and opportunities in the agriculture, aquatic and natural resources (AANR) sectors. It was developed by PCAARRD, in active collaboration with key actors of the agriculture NIS, for each of the 35 commodities under crops, agro-forestry, livestock and poultry, inland aquatic, and marine resources. It serves as blueprint to achieve the national R&D vision and focus PCAARRD’s bundle of interventions under its four banner programs: (1) Strategic R&D; (2) R&D Results Utilization; (3) Policy Research and Advocacy; and (4) Capability Building (PCAARRD, 2013). Moreover, since it supports the harmonized National R&D agenda, it can be categorized under any of the following key result areas of the Aquino government, as follows: (1) poverty alleviation and inclusive growth (food security, countryside development, competitiveness, and biodiversity conservation and sustainable development), (2) climate change mitigation/adaptation and disaster risk reduction and management (water resource management, smart agriculture/fisheries, and disaster risk reduction); and (3) transparency and good governance (Figure4).
The actual and indicative investments of PCAARRD in all ISPs shall amount to almost PhP 3.3 B for the period 2013-2016 (Table 11).[12] The actual investments (2013-2014) comprised about 67% of total, the remaining amount will still have to be negotiated with the Department of Budget and Management (DBM) and eventually, to be approved by both Houses of Congress during regular annual planning and budgeting cycles of 2015 and 2016. More than 50% of investments are earmarked for STI for crops and marine resources, with the crops sub-sector allocation amounting to 33% of total investment. Specific to the crops sub-sector, most of the ISPs focus on smallholder farming, the main source of livelihoods among small, marginal and landless farming households cultivating rice, vegetables and/or legumes, among others. With the exception of sugarcane, crops grown extensively like abaca, banana, coconut, coffee, mango and other tropical fruits are also characteristically smallholder agriculture, relying on a few hectares of land, in contrast to the plantation-type production systems of multi-national agribusiness firms or in other countries. For instance, the ISP on banana is mainly devoted to promoting STI to small farmers growing non-Cavendish banana (a variety of banana planted by large agribusiness firms for the export market) varieties (fruit and cooking) meant for the domestic market.
Figure 4. Harmonized national R&D agenda
Table 11. Actual and indicative funding of the PCAARRD's ISPs (per sub-sector), 2013-2016 (in million Php).
Further, some ISPs specifically focused STI on conservation and sustainable management of (environmental and other) resources considered public commons. These pertain to environmental goods (and bads) and services, e.g., biodiversity, corals, watersheds, climate change, and erosion.
Attempt was also made to classify these ISPs according to the key result areas of the DOST Harmonized R&D Agenda as listed in Figure 4. Most of the ISPs address the national development goal of poverty alleviation and inclusive growth. Since ultimate beneficiaries of the downstream end of STI continuum reside in rural areas, most ISPs aim to promote vibrant rural economies (and sustained countryside development) through STI that will improve the efficiencies of farms/enterprises and relevant agricultural supply chains.
A cursory examination of the impact pathways of the various ISPs shows that most STI aim to improve current productivities of farms and other production-oriented livelihoods or enterprises (Table 12). These STI, once adopted or scaled up, are meant to: (1) approximate well-established productivity frontiers or benchmarks, (2) improve quality of produce and other products, (3) minimize production and post-production losses due to pest and diseases, and (4) improve farm input use efficiencies. Hence, these translate ultimately to improved profitability and if unavoidable, to minimized farm or business loss.
Table 12. ISP desired outcomes, target beneficiaries, and geographical areas covered by sub-sector, 2013-2020.
Table 13 shows a sample of ISPs with their corresponding STI targets (outputs and/or outcomes), geographical area coverage, and beneficiaries. For instance, the coconut ISP hopes to benefit 4,500 small farmers in major coconut growing provinces through STI that can improve by almost 3 times by 2015 their current average nut harvest of only 46 nuts per tree per year and can reduce harvest losses by 20%, on average, in 2014. For the vegetable ISP, it aims to help 1,500 farmers increase their harvest and reduce their post-harvest losses from 35% to 25%. The slaughter goat ISP promises to help at least 970 goat raisers (in 6 regions of the country) increase to 90% the survivability of their pre-weaners and increase the marketable weight of 8-month old goats by 100% in 2020 from the current 15 kilograms. The tilapia ISP seeks to improve the current fish yield of pond production systems from 4 to 6 metric tons per year. And lastly, the seaweed ISP hopes to increase by 20% the current yield of 1.44 metric tons per hectare of seaweed farmers, most of whom are Muslim-Filipinos of the three Mindanao Provinces of Zamboanga Sibugay, Sulu and Tawi-Tawi.
Table 13. Selected ISP desired outcomes, target beneficiaries and geographical areas covered by sub-sector and commodity, 2013-2020
Conclusion
The role of science, technology and innovation (STI) in underpinning and sustaining the country’s economic progress cannot be overemphasized. STI buttress the development and dynamism of agriculture, industry and even, services sector. Hence, the robust growth in national income and output in recent years could be attributed, albeit partly, to STI.
Yet the Philippines chronically under-invests in STI. Its 0.1% of GDP-expenditure for R&D is way below the 1% of GDP benchmark set by the World Bank and UNESCO for developing economies. It is also way below Thailand’s 0.2% and Malaysia’s 0.6%. It also relies heavily on its private sector for at least two-thirds of national R&D investments.
It is in the agricultural sector where public STI is as much felt as it is paramount. Public sector funding is the key investment driver in agricultural STI. It relies on government research institutes and public universities to conduct STI programs and projects whose outputs (in terms of information, technologies and services) once adopted/adapted/scaled up by the ultimate beneficiaries, most of whom are small farmers, fisher folks and other entrepreneurs, can improve significantly their own production system and profitability, and consequently, their household income and welfare.
Addressing the twin national development goals of inclusive growth and competitiveness must, therefore, necessarily focus on agriculture since it is not only the bedrock of a vibrant rural economy but more importantly, the main source of livelihood for countless rural folks, many of whom are poor or worse, belong to the marginalized sector of Philippine society. And for this to happen, public STI is imperative.
References
Asian Development Bank (ADB). 2013a. Asian Development Outlook 2013, Asia’s Energy Challenge.. Mandaluyong City: ADB.
___. 2013b. Key Indicators for Asia and the Pacific 2013. Asia’s Transformation: Where to, How, and How Fast? Mandaluyong City:ADB.
Bureau of Agricultural Statistics. 2014. Performance of Philippine Agriculture, January-December 2013. Retrieved from http://www.bas.gov.ph/?id=710&ids=download_now&p=1&dami=10&srt=dateadd
Department of Agriculture-Bureau of Agricultural Research (DA-BAR). Statement of Allotment, Obligation, and Balances (SAOB) 2010. Retrieved from http://www.bar.gov.ph/downloadables/transparency%20seal/2010_SAOB.pdf
___. SAOB 2011. Retrieved from http://www.bar.gov.ph/downloadables/transparency%20seal/2011_SAOB.pdf
___. SAOB 2012. Retrieved from http://www.bar.gov.ph/downloadables/transparency%20seal/2012_SAOB.pdf
___. SAOB 2013. Retrieved from
http://www.bar.gov.ph/downloadables/transparency%20seal/2013_SAOB.pdf
Department of Budget and Management (DBM). General Appropriations Act (GAA) 2010.Retrieved from .http://www.dbm.gov.ph/wpcontent/uploads/GAA/GAA2010//DOST/L.pdf;
___. GAA 2011. Retrieved from
http://www.dbm.gov.ph/wp-content/uploads/GAA/GAA2011/DOST/L.pdf
___. GAA 2012. Retrieved from
http://www.dbm.gov.ph/wp-content/uploads/GAA/GAA2012/DOST/L.pdf
___. GAA 2013.
Department of Science and Technology, Planning and Evaluation Service-S&T Resource Assessment and Evaluation Division (DOST, PES-STRAED). 2012. Compendium of Science and Technology Statistics.
____2013. Results of the 2011 Survey of R&D Expenditures and Human Resources and Updates on R&D Indicators in the Philippines. Presented by PES-STRAED during the 12th National Convention on Statistics held on October 1-2, 2013 at the EDSA Shangri-La Hotel, Mandaluyong City.
____Harmonized National R&D Agenda. PDF File.
Malik, K., ed. 2013. Human Development Report 2013. The Rise of the South: Human Progress in a Diverse World. New York: United Nations Development Programme (UNDP).
National Economic and Development Authority (NEDA). Philippine Development Plan (PDP) 2011-2016. Retrieved from http://www.neda.gov.ph/wp-content/uploads/2013/09/CHAPTER-1.pdf
____. Socio-economic Report 2010-2012: The first two years of the Aquino administration. Retrieved from http://www.neda.gov.ph/wp-content/uploads/2013/10/SER2010-2012.pdf
National Statistics Coordination Board (NSCB). 2012. “Fishermen still the poorest sector in 2009 ” (PR-201206-SS2-01, Posted 07 June 2012). Retrieved from
http://www.nscb.gov.ph/pressreleases/2012/PR-201206-SS2-01_pov2009.asp
____. 2013. 2012 Full Year Official Poverty Statistics (as of 09 December 2013). Retrieved from http://nscb.gov.ph/poverty/dataCharts.asp
____. 2014. National Accounts of the Philippines (as of January 2014). Retrieved from
http://www.nscb.gov.ph/sna/2013/4th2013/tables/1Q4-Rev_Summary_93SNA.pdf
Official Gazette, 2010, July 25. A Social Contract with the Filipino People. Retrieved from http://www.gov.ph/about/gov/exec/bsaiii/platform-of-government/
Philippine Council for Agriculture Aquatic and Natural Resources Research and Development (PCAARRD). 2013. 2012 PCAARRD annual report: Working together towards greater productivity. Los Baños, Laguna: PCAARRD-DOST.
____. Policy Coordination and Monitoring Division (PCMD). PCAARRD-DOST Outcome-based planning tool (2013-2016). (Unpublished).
____. ISP Classification based on the Harmonized National R&D Agenda. (Unpublished material from Policy Coordination and Monitoring Division).
Philippine Statistics Authority (PSA). The 2013 Employment Situation (The Year in Review). LABSTAT Updates, 18, No. 2.January 2014.Retrieved from
http://www.bles.dole.gov.ph/PUBLICATIONS/LABSTAT%20UPDATES/vol18_2.pdf
Schwab, K. ed. 2011. The Global Competitiveness Report 2011-2012. Geneva: World Economic Forum.
____. 2012. The Global Competitiveness Report 2012-2013. Geneva: World Economic Forum.
____. 2013. The Global Competitiveness Report 2013-2014. Geneva: World Economic Forum.
[1] Policy paper submitted to the Food and Fertilizer Technology Center (FFTC) for the project titled “Asia-Pacific Information Platform in Agricultural Policy”. The original paper was presented during the “Philippine Studies Conference in Japan” held at the Southeast Asian Studies Center, Kyoto University, Kyoto, Japan on 28 February – 01 March 2014.
[2] Philippine point person to the FFTC Project on Asia-Pacific Information Platform in Agricultural Policy and Director, Science Research Specialist II, Science Research Analyst, and Executive Director, respectively, Philippine Council for Agriculture, Aquatic and Natural Resources Research and Development (PCAARRD) of the Department of Science and Technology (DOST), Los Baños, Laguna, the Philippines. The authors acknowledge with appreciation the technical assistance and data provided by many technical officers and staff of PCAARRD. Any error, however, in the interpretation and analysis in this work is the sole responsibility of the authors.
[3] ASEAN-5 refers to Indonesia, Malaysia, Philippines, Thailand, and Vietnam; and should not be construed to refer to the first original 5 country-member (to include Singapore).
[4] Credit rating is an evaluation (by a credit rating agency) of the credit worthiness (ability to pay back the debt and the likelihood of default) of a debtor (i.e., a sovereign government). An investment credit rating should give the country more access to cheaper credit because investors may now consider its debt to be less risky.
[5] HDI is a composite index measuring average achievement in three basic dimensions of human development – a long and healthy life, knowledge, and a decent standard of living (Malik, ed., 2013).
[6] In terms of competitiveness, the GCI of a country is measured annually. The WEF defines competitiveness as the set of institutions, policies, and factors that determine the level of productivity of a country. The GCI has 12 pillars of competitiveness categorized under basic requirements, efficiency enhancers, and innovation and sophistication factors.
[7] Agricultural production and technology covers research on the promotion of agriculture, forestry, fisheries and foodstuff production. It includes: research on chemical fertilizers, biocides, biological pest control and the mechanization of agriculture; research on the impact of agricultural and forestry activities on the environment; research in the field of developing food productivity and technology (Compendium of Science and Technology Statistics, DOST 2012).
[8] Government research organizations (e.g., Philippine Rice Institute, Ecosystems Research and Development Bureau, Food and Nutrition Institute) are line agencies or bureaus under a specific line department (e.g., DA, DENR and DOST) mandated to implement R&D or STI on a specific commodity, industry or theme and with tenured scientists, researchers and research support staff.
[9] They are also referred to as state colleges and universities or national university in the case of the University of the Philippines System. R&D is one of the core functions of HEIs aside from teaching and extension. Most researches done at HEIs are, however, done by tenured/contract faculty members who are also required to teach some courses. The number of tenured researcher or scientist positions is few relative to faculty members.
[10] It is the DOST sectoral S&T planning council for agriculture mandated by law (Executive Order No. 128 Series of 1986) to formulate, coordinate, monitor and evaluate, and generate resources for S&T plans and programs for the development of the agricultural sector of the Philippines.
[11] Under the DOST, the harmonized National R&D Agenda is aligned with the Philippine Development Plan (PDP) and the National Science and Technology Plan 2020. For 2013-2017, the Agenda supports the present administration’s five key Results Areas (KRAs), focusing on poverty alleviation and inclusive growth, and climate change adaptation/mitigation and disaster risk reduction (DOST).
[12] PCAARRD started to provide grants and/or leverage funds to key implementers of the agriculture NIS from 2011. However, consolidating 2011-2012 financial records was not easy and hence, only 2013-2016 data are included in the tabulation.
Date submitted: March 25, 2014
Reviewed, edited and uploaded: March 26, 2014