INTRODUCTION
Farm economy in Korea has long been said to suffer from “double squeezing” in lowered revenue along with increased operation costs, which is believed to have a negative impact on the sector’s long-term sustainability and re-productivity. In addition, a sign of income equality being worsened has been getting clearer in recent days. Such symptom is very likely to exacerbate economic conditions and living standard of those who have been referred to namely “elderly smallholders”. Out of such backgrounds, this article explains the recent farm economy situations in Korea and seeks for the policy implications.
FARM ECONOMIC SITUATION BY FARM TYPE
At a glance
Gross farm income in Korea had increased from 2013 through 2017 with the exception in 2016. Consequently, gross farm income reached 38.2 million KRW(35,684 USD) in 2017, increased by 10.8% compared to that in 2013 (Table 1).
Table 1 Gross farm income trends, 2013-2017
Unit: 10,000 KRW, (%)
|
|
2013
|
2014
|
2015
|
2016
|
2017
|
|
Gross Farm income(A)
|
3,452.4
|
3,495.0
|
3,721.5
|
3,719.7
|
3,823.9
|
|
-On-farm income
|
1,003.5
|
1,030.3
|
1,125.7
|
1,006.8
|
1,004.7
|
|
( Share out of (A) )
|
(29.1)
|
(29.5)
|
(30.2)
|
(27.1)
|
(26.3)
|
|
*Gross revenue
|
3,064.8
|
3,217.9
|
3,365.4
|
3,127.9
|
3,058.0
|
|
*Operating expenses
|
2,061.3
|
2,187.5
|
2,239.8
|
2,121.1
|
2,053.3
|
|
( Share out of (A) )
|
(67.3)
|
(68.0)
|
(66.6)
|
(67.8)
|
(67.1)
|
|
-Off-farm income
|
1,570.5
|
1,479.9
|
1,493.9
|
1,525.2
|
1,626.9
|
|
( Share out of (A) )
|
(45.5)
|
(42.3)
|
(40.1)
|
(41.0)
|
(42.5)
|
|
*Subsidiary business
|
418.2
|
375.1
|
373.3
|
385.5
|
440.6
|
|
*Wage income
|
1,152.3
|
1,104.8
|
1,120.6
|
1,139.7
|
1,186.3
|
|
-Transfer income
|
584.4
|
681.9
|
790.6
|
878.3
|
890.2
|
|
( Share out of (A) )
|
(16.9)
|
(19.5)
|
(21.2)
|
(23.6)
|
(23.3)
|
|
*Public
|
520
|
620.7
|
723.1
|
813.8
|
823.7
|
|
**Agriculture-related
|
146.4
|
160.5
|
166.4
|
182.7
|
168.2
|
|
**Others
|
373.7
|
460.2
|
556.7
|
631
|
655.4
|
|
*Private
|
64.3
|
61.3
|
67.5
|
64.5
|
66.5
|
|
-Non- recurring income
|
294
|
302.9
|
311.4
|
309.5
|
302.2
|
|
( Share out of (A) )
|
(8.5)
|
(8.7)
|
(8.4)
|
(8.3)
|
(7.9)
|
Source: National Statistical Office. Farm Economic Survey.
Amongst others, substantially increased transfer payment, be it public or private, has been one of largest factor accounting for the total farm income increment. On-farm income level in 2017, due to decline in 2016, was similar with that in 2013, meanwhile its share out of gross farm income has shrunk from 29.1% in 2013 to 26.3% in 2017. During 2013-2017, off-farm income size has continuously outpaced on-farm income, accounting for the 40.1%~45.5% of gross farm income.
Typology
As Korean farm and farm household characteristics have been diversified, measuring their features based on those of “average and representative farms” could mask what really look like and possibly mislead policy makers (Kim and Park 2014). In this sense, classifying farms into more homogenous sub-groups enable us to conduct more in-depth and detailed analysis to unveil their situations and challenges. In this paper, farm typologies are guided by Kim, Oh, and Hwang (2016) as presented in Table 2.
|
Table 2 Classification of farmhouses
|
|
Farm type
|
Criteria
|
|
Small and Young (SY)
|
Standard farm size is less than 2ha &
primary operator’s age is less than 65 years
|
|
Large and Young (LY)
|
Standard farm size is larger than 2ha &
primary operator’s age is less than 65 years
|
|
Small and Old (SO)
|
Standard farm size is less than 2ha &
primary operator’s age is over 65 years
|
|
Large and Old (LO)
|
Standard farm size is larger than 2ha &
primary operator’s age is over 65 years
|
|
Note: The standard farm size is calculated as the land area + (fixed assets for agriculture / average agricultural land price) (Choi and Oh 1983). This formula is employed to mitigate potential bias in land size stemming from various farming type (e.g. paddy rice vs. greenhouse)
Source: Kim, Oh, and Hwang (2016).
|
As shown in Table 3, the frequency and share of LO and LY groups have increased during 2013-2017. In particular, the proportion of elderly small farmers among sample farms exceeded half of the total for the first time in 2017 (52.1%).
Table 3 Change in number of sample farm-household by farm type, 2013-2017
|
Type
|
2013
|
2014
|
2015
|
2016
|
2017
|
|
SY
|
581
|
593
|
567
|
512
|
447
|
|
LY
|
439
|
435
|
403
|
378
|
344
|
|
SO
|
968
|
1,144
|
1,206
|
1,269
|
1,350
|
|
LO
|
359
|
428
|
424
|
441
|
447
|
|
Total
|
2,347
|
2,600
|
2,600
|
2,600
|
2,588
|
Source: National Statistical Office. Farm Economic Survey.
Comparison and findings
On average, gross farm income of young and elderly groups was 67.3 million KRW (62,868 USD) and 38.9 million KRW (36,338 USD) during 2013-2017, respectively (Figure. 1, top left).
Figure 1 Korean farm income by income sources and farm types
Unit: 10,000 KRW
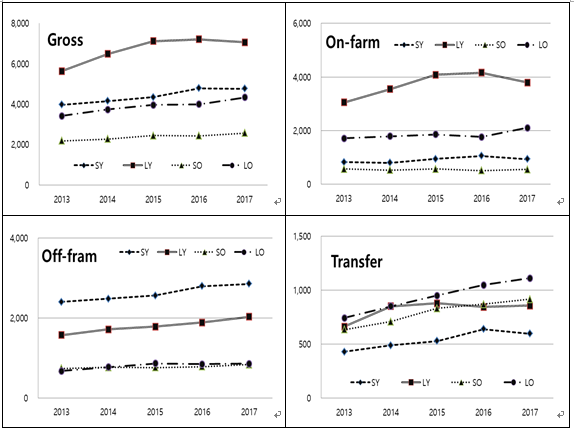
Regardless of main operator’s age, on-farm income has changed in a different way depending on farm size (Figure. 1, top right). For LY and LO groups, on-farm income has been on increment whereas that of small farm groups has been rather stagnated. Even within “small farm” group, income gap has been expanded. For instance, the average gross farm income for SY group (44.0 million KRW or 41,102 USD) has almost doubled that of SO group (23.6 million KRW or 22,046 USD). More detailed information is provided in <Table 4>
Independent of farm size, younger farmers depended more heavily on off-farm income (Figure. 1, bottom left). Especially, SY group farmers earned 60.4~71.8% of their gross farm income out of the off-farm activities. It likely comes from that they have had difficulties in purchasing and/or borrowing arable land in that high land price/rent worked as an entry barrier. Thus they and their household members are required to take “multiple job holding” to make additional income to maintain their livelihood, and possibly to accumulate capital for future (agricultural) investments. Their demographic features (e.g. relatively more household members and more time available for off-farm jobs) enabled them to make such a decision.
With an exception of LY groups, transfer income has been increased in most types of farm. Policy changes relevant to public transfer such as raised per hectare payment under the Fixed Direct Payments and introduction of Basic Pension (for those over 65 years old) in July 2014 likely induce such increment.
Table 4 Korean farm income by income sources and farm types
Unit: 10,000 KRW
|
Type
|
Source
|
2013
|
2014
|
2015
|
2016
|
2017
|
|
SY
|
Gross Farm income
|
3,972.4
|
4,157.5
|
4,343.5
|
4,790.2
|
4,767.6
|
|
-On-farm income
|
823.9
|
797.4
|
943.5
|
1,050.5
|
931.8
|
|
-Off-farm income
|
2,399.1
|
2,480.1
|
2,561.7
|
2,794.9
|
2,852.8
|
|
*Subsidiary business
|
578.1
|
555.6
|
562.7
|
693.5
|
783.8
|
|
*Wage
|
1,821.0
|
1,924.6
|
1,999.0
|
2,101.3
|
2,069.1
|
|
- Transfer income
|
429.7
|
487.7
|
529.1
|
638.7
|
596.8
|
|
-Non-recurring income
|
319.7
|
392.2
|
309.2
|
306.1
|
386.2
|
|
Operation costs
|
2,616.5
|
2,679.8
|
2,604.5
|
2,285.5
|
2,350.2
|
|
LY
|
Gross Farm income
|
5,633.9
|
6,485.7
|
7,116.4
|
7,210.4
|
7,067.0
|
|
-On-farm income
|
3,047.3
|
3,547.4
|
4,079.9
|
4,162.2
|
3,794.6
|
|
-Off-farm income
|
1,569.9
|
1,714.7
|
1,781.7
|
1,883.4
|
2,029.8
|
|
*Subsidiary business
|
599.6
|
662.2
|
676.6
|
691.4
|
683.0
|
|
*Wage
|
970.3
|
1,052.5
|
1,105.1
|
1,192.0
|
1,346.8
|
|
- Transfer income
|
663.1
|
851.7
|
879.4
|
845.1
|
857.4
|
|
-Non-recurring income
|
353.6
|
371.9
|
375.4
|
319.6
|
385.2
|
|
Operation costs
|
7,400.9
|
7,650.5
|
8,642.8
|
8,138.0
|
8,150.3
|
|
SO
|
Gross Farm income
|
2,184.5
|
2,275.8
|
2,449.3
|
2,441.3
|
2,572.6
|
|
-On-farm income
|
568.1
|
526.8
|
562.3
|
505.6
|
545.2
|
|
-Off-farm income
|
736.3
|
761.8
|
758.7
|
779.9
|
834.8
|
|
*Subsidiary business
|
161.0
|
173.0
|
176.9
|
184.1
|
186.0
|
|
*Wage
|
575.4
|
588.8
|
581.8
|
595.8
|
648.9
|
|
- Transfer income
|
635.9
|
709.8
|
831.5
|
869.5
|
916.8
|
|
-Non-recurring income
|
244.2
|
277.4
|
296.9
|
286.2
|
275.8
|
|
Operation costs
|
985.3
|
1,011.6
|
1,028.1
|
1,058.5
|
1,046.0
|
|
LO
|
Gross Farm income
|
3,423.7
|
3,734.2
|
3,959.9
|
3,995.0
|
4,335.1
|
|
-On-farm income
|
1,713.8
|
1,782.3
|
1,856.2
|
1,763.6
|
2,098.4
|
|
-Off-farm income
|
670.2
|
770.7
|
864.5
|
847.1
|
855.8
|
|
*Subsidiary business
|
192.1
|
249.5
|
265.6
|
250.3
|
279.3
|
|
*Wage
|
478.1
|
521.2
|
598.9
|
596.8
|
576.5
|
|
- Transfer income
|
743.3
|
850.7
|
950.1
|
1,048.7
|
1,111.9
|
|
-Non-recurring income
|
296.4
|
330.5
|
289.0
|
335.7
|
269.0
|
|
Operation costs
|
2,919.1
|
3,257.3
|
3,482.3
|
3,955.8
|
4,335.5
|
Source: National Statistical Office. Farm Economic Survey.
Relative Poverty Rate (RPR)
When gross income, irrespective of sources, fails to meet the minimum living standard level, some farms could be entrapped by poverty trap (Kang 2015). Moreover, those who fail to earn enough money to cover household consumption expenditure are very unlikely to make any investment for future income-generating activities, implying that their long-term economic viability could be even more exacerbated. To measure the degree of such potential risk faced by Korean farmers, we calculated share of the farms whose gross farm income is less than 30% of Standard Median Income (Table 5).
During 2013-2017, RPR of Korean farms ranged from 11.2% to 13.8%. It is to be noted that SO group’s RPR has been significantly higher than other groups. Combined with the group’s substantially lower gross farm income level and their limited accessibility to off-farm job opportunity, the result points out that the group accounting for 52.1% of total sample farms in 2017 are most vulnerable to and likely entrapped by any risks.
Table 5 Relative Poverty Rate by Farm Type, 2013-2017
Unit: number of RPR farms, number of sample farms, %
|
Type
|
2013
|
2014
|
2015
|
2016
|
2017
|
|
|
SY
|
63/581
(10.8)
|
65/593
(11.0)
|
57/567
(10.1)
|
44/512
(8.6)
|
33/447
(7.6)
|
|
| |
|
LY
|
46/439
(10.5)
|
48/435
(11.0)
|
39/403
(9.7)
|
36/378
(9.5)
|
32/344
(9.3)
|
|
| |
|
SO
|
171/968
(17.7)
|
192/1144
(16.9)
|
161/1206
(13.4)
|
174/1269
(13.7)
|
190/1350
(14.1)
|
|
| |
|
LO
|
33/359
(9.2)
|
53/428
(12.4)
|
33/424
(7.8)
|
46/441
(10.4)
|
39/447
(8.7)
|
|
| |
|
Total
|
313/2347
(13.3)
|
358/2600
(13.8)
|
290/2600
(11.2)
|
300/2600
(11.5)
|
305/2588
(11.8)
|
|
Source: National Statistical Office. Farm Economic Survey.
Policy implications
As shown earlier, current Korean farm economy may be featured as follows: 1) income-dependency on non-agricultural income sources has been deepened, and 2) based on typology applied, farm groups have had their own economic characteristics and thus been faced with different challenges.
Beyond farm economy level, there is another issue worthy of being mentioned: urban-farm household income gap. The urban-farm household income ratio reached its record-low level of 57.6% in 2012, followed by gradual raising to reach 64.1% in 2017. In a word, farm households, compared to urban households with wage incomes, have “earned relatively less, spent relatively more” during 2013~2017 (Table 6). Based on the income gap and disposable income, it can be inferred that farm households, in addition to their disadvantageous economic status, are likely to have difficulties in maintaining decent standard of living.
Table 6 Farm-urban household income and expenditure comparison
|
|
|
Unit
|
2013
|
2014
|
2015
|
2016
|
|
Farm
HH
|
Gross income (A)
|
10,000 KRW
|
3,452
|
3,495
|
3,722
|
3,720
|
|
Expenditure (Total, B)
|
10,000 KRW
|
3,026
|
3,056
|
3,061
|
3,105
|
|
-Expenditure (HH)
|
10,000 KRW
|
2,418
|
2,447
|
2,474
|
2,500
|
|
-Expenditure (Others)
|
10,000 KRW
|
608
|
609
|
587
|
605
|
|
Disposable income (C)
|
10,000 KRW
|
2,844
|
2,886
|
3,134
|
3,115
|
|
Urban
HH
|
Gross income (D)
|
10,000 KRW
|
5,527
|
5,682
|
5,780
|
5,861
|
|
Expenditure (Total, E)
|
10,000 KRW
|
4,257
|
4,382
|
4,395
|
4,427
|
|
-Expenditure (HH)
|
10,000 KRW
|
3,186
|
3,269
|
3,267
|
3,288
|
|
-Expenditure (Others)
|
10,000 KRW
|
1,071
|
1,114
|
1,128
|
1,138
|
|
Disposable income (F)
|
10,000 KRW
|
4,457
|
4,568
|
4,652
|
4,723
|
|
Farm-Urban
HH gap
|
(A) - (B)
|
10,000 KRW
|
2,075
|
2,187
|
2,058
|
2,142
|
|
(A) / (B)
|
%
|
62.5
|
61.5
|
64.4
|
63.5
|
|
(C) - (D)
|
10,000 KRW
|
1,231
|
1,327
|
1,334
|
1,322
|
|
(C) / (D)
|
%
|
71.1
|
69.7
|
69.7
|
70.1
|
|
(E) - (F)
|
10,000 KRW
|
1,612
|
1,682
|
1,518
|
1,608
|
|
(E) / (F)
|
%
|
63.8
|
63.2
|
67.4
|
65.9
|
Source: National Statistical Office. Farm Economic Survey, and Household Income and Expenditure Survey.
Out of the findings, some implication and/or suggestion can be drawn. First, getting lowered share of agricultural income in gross farm income should be given more attention and tackled. Prescriptions, even if not detailed, may be suggested as follows. 1) A variety of policy tools are implemented to facilitate inflow and ‘soft-landing’ (settlement) of young farmers. However, our finding shows that those target groups depend more on non-agricultural economic activities than farming. To enable them to play a role as active and core farmers, such problems as difficulties in learning farming techniques, acquiring agricultural land, and insufficient investment capital are to be addressed. 2) Aged farmers accounting for a large portion of farms have suffered from failing to obtain “enough” income. That limited opportunities for off-farm income-generating activities have worsened the situation. Farming-related part-time kind of gainful activities need to be designed and introduced to mitigate their problems. 3) For “large” farms, price fluctuation (leading to income instability) is of great concern. Relevant policy instruments are to be fine-tuned. 4) The economic distress faced by “small” farms (especially SO type farms) might not be solved solely by agricultural problems. Closer linkage with other policy domains, e.g. basic pension, and effective reform of retirement-and-succession program are to be desired. 5) Besides, enhancing rural infrastructure is also important in that relatively poor transport, daily-life-service (hospital, market accessibility etc.) conditions are also responsible for the living standard in rural areas.
SUMMARY AND CONCLUSION
Farm economy in Korea has been, in real terms, stagnated or decreased over a recent decade. What’s more, income inequality problem has been recognized as not thoroughly new but unprecedentedly serious problem. As a result, a large number of researchers and policy-makers are concerned in that when no effective and in-time policy responses are made, Korean farm economy might be “withered” in the future.
Also it is noteworthy that different types of farms are affected very differently in terms of income and poverty. Based on diagnoses for improving income by farm type, some policy suggestions could be made as follows. First, enhanced accessibility to production assets, e.g. arable land and finance, is required, especially for new young entrants and those who seek to expand their farm size. Second, a dense and reliable income safety net is more desired for the aged small size farm holders. They might not be as “productive” as they used to be or compared to other groups. Nevertheless paying attention to the vulnerable people does matter in that they account for the largest share of farm population and that providing them with a safety-net might work to save social costs as a whole. This rationale could be applied to the Direct Payment Scheme reform recently undergone in Korea. For example, differentiating per hectare payment rate to enable “small” farmers may receive more could, at least partially, mitigate the formidable challenges faced by lots of farms in Korea.
REFERENCES
Kang, H.J. 2015. “An Analysis of the Characteristics of Farm Households Experiencing Economic Crisis.” Korean Journal of Agricultural Management and Policy Volume 42, Number 2: 217-231.
Kim, M.B. and S.J., Park. 2014.『Agricultural Structure Change and Farm Economy: Poli Implications』. Agricultural Focus, No. 95(Oct. 2014), Korea Rural Economic Institute.
Kim, M.B, N.W, Oh, and E.S., Hwang. 2016. 『Income Structure Change by Farm Type: Policy Implications』. Agricultural Focus, No. 132(Aug. 2016), Korea Rural Economic Institute.
Rhew, C.H., H.S., Seo, and T.H., Kim. 2019. 『2013-2017 Farm Economy: Situations and Implications』. Agricultural Focus, No. 173(Apr. 2019), Korea Rural Economic Institute.
National Statistical Office. “Farm Economic Survey.”
|
Date submitted: Apr. 26, 2019
Reviewed, edited and uploaded: June. 13, 2019
|

Recent Farm Economy in Korea: Situation and Implications
INTRODUCTION
Farm economy in Korea has long been said to suffer from “double squeezing” in lowered revenue along with increased operation costs, which is believed to have a negative impact on the sector’s long-term sustainability and re-productivity. In addition, a sign of income equality being worsened has been getting clearer in recent days. Such symptom is very likely to exacerbate economic conditions and living standard of those who have been referred to namely “elderly smallholders”. Out of such backgrounds, this article explains the recent farm economy situations in Korea and seeks for the policy implications.
FARM ECONOMIC SITUATION BY FARM TYPE
At a glance
Gross farm income in Korea had increased from 2013 through 2017 with the exception in 2016. Consequently, gross farm income reached 38.2 million KRW(35,684 USD) in 2017, increased by 10.8% compared to that in 2013 (Table 1).
Table 1 Gross farm income trends, 2013-2017
Unit: 10,000 KRW, (%)
2013
2014
2015
2016
2017
Gross Farm income(A)
3,452.4
3,495.0
3,721.5
3,719.7
3,823.9
-On-farm income
1,003.5
1,030.3
1,125.7
1,006.8
1,004.7
( Share out of (A) )
(29.1)
(29.5)
(30.2)
(27.1)
(26.3)
*Gross revenue
3,064.8
3,217.9
3,365.4
3,127.9
3,058.0
*Operating expenses
2,061.3
2,187.5
2,239.8
2,121.1
2,053.3
( Share out of (A) )
(67.3)
(68.0)
(66.6)
(67.8)
(67.1)
-Off-farm income
1,570.5
1,479.9
1,493.9
1,525.2
1,626.9
( Share out of (A) )
(45.5)
(42.3)
(40.1)
(41.0)
(42.5)
*Subsidiary business
418.2
375.1
373.3
385.5
440.6
*Wage income
1,152.3
1,104.8
1,120.6
1,139.7
1,186.3
-Transfer income
584.4
681.9
790.6
878.3
890.2
( Share out of (A) )
(16.9)
(19.5)
(21.2)
(23.6)
(23.3)
*Public
520
620.7
723.1
813.8
823.7
**Agriculture-related
146.4
160.5
166.4
182.7
168.2
**Others
373.7
460.2
556.7
631
655.4
*Private
64.3
61.3
67.5
64.5
66.5
-Non- recurring income
294
302.9
311.4
309.5
302.2
( Share out of (A) )
(8.5)
(8.7)
(8.4)
(8.3)
(7.9)
Source: National Statistical Office. Farm Economic Survey.
Amongst others, substantially increased transfer payment, be it public or private, has been one of largest factor accounting for the total farm income increment. On-farm income level in 2017, due to decline in 2016, was similar with that in 2013, meanwhile its share out of gross farm income has shrunk from 29.1% in 2013 to 26.3% in 2017. During 2013-2017, off-farm income size has continuously outpaced on-farm income, accounting for the 40.1%~45.5% of gross farm income.
Typology
As Korean farm and farm household characteristics have been diversified, measuring their features based on those of “average and representative farms” could mask what really look like and possibly mislead policy makers (Kim and Park 2014). In this sense, classifying farms into more homogenous sub-groups enable us to conduct more in-depth and detailed analysis to unveil their situations and challenges. In this paper, farm typologies are guided by Kim, Oh, and Hwang (2016) as presented in Table 2.
Table 2 Classification of farmhouses
Farm type
Criteria
Small and Young (SY)
Standard farm size is less than 2ha &
primary operator’s age is less than 65 years
Large and Young (LY)
Standard farm size is larger than 2ha &
primary operator’s age is less than 65 years
Small and Old (SO)
Standard farm size is less than 2ha &
primary operator’s age is over 65 years
Large and Old (LO)
Standard farm size is larger than 2ha &
primary operator’s age is over 65 years
Note: The standard farm size is calculated as the land area + (fixed assets for agriculture / average agricultural land price) (Choi and Oh 1983). This formula is employed to mitigate potential bias in land size stemming from various farming type (e.g. paddy rice vs. greenhouse)
Source: Kim, Oh, and Hwang (2016).
As shown in Table 3, the frequency and share of LO and LY groups have increased during 2013-2017. In particular, the proportion of elderly small farmers among sample farms exceeded half of the total for the first time in 2017 (52.1%).
Table 3 Change in number of sample farm-household by farm type, 2013-2017
Type
2013
2014
2015
2016
2017
SY
581
593
567
512
447
LY
439
435
403
378
344
SO
968
1,144
1,206
1,269
1,350
LO
359
428
424
441
447
Total
2,347
2,600
2,600
2,600
2,588
Source: National Statistical Office. Farm Economic Survey.
Comparison and findings
On average, gross farm income of young and elderly groups was 67.3 million KRW (62,868 USD) and 38.9 million KRW (36,338 USD) during 2013-2017, respectively (Figure. 1, top left).
Figure 1 Korean farm income by income sources and farm types
Unit: 10,000 KRW
Regardless of main operator’s age, on-farm income has changed in a different way depending on farm size (Figure. 1, top right). For LY and LO groups, on-farm income has been on increment whereas that of small farm groups has been rather stagnated. Even within “small farm” group, income gap has been expanded. For instance, the average gross farm income for SY group (44.0 million KRW or 41,102 USD) has almost doubled that of SO group (23.6 million KRW or 22,046 USD). More detailed information is provided in <Table 4>
Independent of farm size, younger farmers depended more heavily on off-farm income (Figure. 1, bottom left). Especially, SY group farmers earned 60.4~71.8% of their gross farm income out of the off-farm activities. It likely comes from that they have had difficulties in purchasing and/or borrowing arable land in that high land price/rent worked as an entry barrier. Thus they and their household members are required to take “multiple job holding” to make additional income to maintain their livelihood, and possibly to accumulate capital for future (agricultural) investments. Their demographic features (e.g. relatively more household members and more time available for off-farm jobs) enabled them to make such a decision.
With an exception of LY groups, transfer income has been increased in most types of farm. Policy changes relevant to public transfer such as raised per hectare payment under the Fixed Direct Payments and introduction of Basic Pension (for those over 65 years old) in July 2014 likely induce such increment.
Table 4 Korean farm income by income sources and farm types
Unit: 10,000 KRW
Type
Source
2013
2014
2015
2016
2017
SY
Gross Farm income
3,972.4
4,157.5
4,343.5
4,790.2
4,767.6
-On-farm income
823.9
797.4
943.5
1,050.5
931.8
-Off-farm income
2,399.1
2,480.1
2,561.7
2,794.9
2,852.8
*Subsidiary business
578.1
555.6
562.7
693.5
783.8
*Wage
1,821.0
1,924.6
1,999.0
2,101.3
2,069.1
- Transfer income
429.7
487.7
529.1
638.7
596.8
-Non-recurring income
319.7
392.2
309.2
306.1
386.2
Operation costs
2,616.5
2,679.8
2,604.5
2,285.5
2,350.2
LY
Gross Farm income
5,633.9
6,485.7
7,116.4
7,210.4
7,067.0
-On-farm income
3,047.3
3,547.4
4,079.9
4,162.2
3,794.6
-Off-farm income
1,569.9
1,714.7
1,781.7
1,883.4
2,029.8
*Subsidiary business
599.6
662.2
676.6
691.4
683.0
*Wage
970.3
1,052.5
1,105.1
1,192.0
1,346.8
- Transfer income
663.1
851.7
879.4
845.1
857.4
-Non-recurring income
353.6
371.9
375.4
319.6
385.2
Operation costs
7,400.9
7,650.5
8,642.8
8,138.0
8,150.3
SO
Gross Farm income
2,184.5
2,275.8
2,449.3
2,441.3
2,572.6
-On-farm income
568.1
526.8
562.3
505.6
545.2
-Off-farm income
736.3
761.8
758.7
779.9
834.8
*Subsidiary business
161.0
173.0
176.9
184.1
186.0
*Wage
575.4
588.8
581.8
595.8
648.9
- Transfer income
635.9
709.8
831.5
869.5
916.8
-Non-recurring income
244.2
277.4
296.9
286.2
275.8
Operation costs
985.3
1,011.6
1,028.1
1,058.5
1,046.0
LO
Gross Farm income
3,423.7
3,734.2
3,959.9
3,995.0
4,335.1
-On-farm income
1,713.8
1,782.3
1,856.2
1,763.6
2,098.4
-Off-farm income
670.2
770.7
864.5
847.1
855.8
*Subsidiary business
192.1
249.5
265.6
250.3
279.3
*Wage
478.1
521.2
598.9
596.8
576.5
- Transfer income
743.3
850.7
950.1
1,048.7
1,111.9
-Non-recurring income
296.4
330.5
289.0
335.7
269.0
Operation costs
2,919.1
3,257.3
3,482.3
3,955.8
4,335.5
Source: National Statistical Office. Farm Economic Survey.
Relative Poverty Rate (RPR)
When gross income, irrespective of sources, fails to meet the minimum living standard level, some farms could be entrapped by poverty trap (Kang 2015). Moreover, those who fail to earn enough money to cover household consumption expenditure are very unlikely to make any investment for future income-generating activities, implying that their long-term economic viability could be even more exacerbated. To measure the degree of such potential risk faced by Korean farmers, we calculated share of the farms whose gross farm income is less than 30% of Standard Median Income (Table 5).
During 2013-2017, RPR of Korean farms ranged from 11.2% to 13.8%. It is to be noted that SO group’s RPR has been significantly higher than other groups. Combined with the group’s substantially lower gross farm income level and their limited accessibility to off-farm job opportunity, the result points out that the group accounting for 52.1% of total sample farms in 2017 are most vulnerable to and likely entrapped by any risks.
Table 5 Relative Poverty Rate by Farm Type, 2013-2017
Unit: number of RPR farms, number of sample farms, %
Type
2013
2014
2015
2016
2017
SY
63/581
(10.8)
65/593
(11.0)
57/567
(10.1)
44/512
(8.6)
33/447
(7.6)
LY
46/439
(10.5)
48/435
(11.0)
39/403
(9.7)
36/378
(9.5)
32/344
(9.3)
SO
171/968
(17.7)
192/1144
(16.9)
161/1206
(13.4)
174/1269
(13.7)
190/1350
(14.1)
LO
33/359
(9.2)
53/428
(12.4)
33/424
(7.8)
46/441
(10.4)
39/447
(8.7)
Total
313/2347
(13.3)
358/2600
(13.8)
290/2600
(11.2)
300/2600
(11.5)
305/2588
(11.8)
Source: National Statistical Office. Farm Economic Survey.
Policy implications
As shown earlier, current Korean farm economy may be featured as follows: 1) income-dependency on non-agricultural income sources has been deepened, and 2) based on typology applied, farm groups have had their own economic characteristics and thus been faced with different challenges.
Beyond farm economy level, there is another issue worthy of being mentioned: urban-farm household income gap. The urban-farm household income ratio reached its record-low level of 57.6% in 2012, followed by gradual raising to reach 64.1% in 2017. In a word, farm households, compared to urban households with wage incomes, have “earned relatively less, spent relatively more” during 2013~2017 (Table 6). Based on the income gap and disposable income, it can be inferred that farm households, in addition to their disadvantageous economic status, are likely to have difficulties in maintaining decent standard of living.
Table 6 Farm-urban household income and expenditure comparison
Unit
2013
2014
2015
2016
Farm
HH
Gross income (A)
10,000 KRW
3,452
3,495
3,722
3,720
Expenditure (Total, B)
10,000 KRW
3,026
3,056
3,061
3,105
-Expenditure (HH)
10,000 KRW
2,418
2,447
2,474
2,500
-Expenditure (Others)
10,000 KRW
608
609
587
605
Disposable income (C)
10,000 KRW
2,844
2,886
3,134
3,115
Urban
HH
Gross income (D)
10,000 KRW
5,527
5,682
5,780
5,861
Expenditure (Total, E)
10,000 KRW
4,257
4,382
4,395
4,427
-Expenditure (HH)
10,000 KRW
3,186
3,269
3,267
3,288
-Expenditure (Others)
10,000 KRW
1,071
1,114
1,128
1,138
Disposable income (F)
10,000 KRW
4,457
4,568
4,652
4,723
Farm-Urban
HH gap
(A) - (B)
10,000 KRW
2,075
2,187
2,058
2,142
(A) / (B)
%
62.5
61.5
64.4
63.5
(C) - (D)
10,000 KRW
1,231
1,327
1,334
1,322
(C) / (D)
%
71.1
69.7
69.7
70.1
(E) - (F)
10,000 KRW
1,612
1,682
1,518
1,608
(E) / (F)
%
63.8
63.2
67.4
65.9
Source: National Statistical Office. Farm Economic Survey, and Household Income and Expenditure Survey.
Out of the findings, some implication and/or suggestion can be drawn. First, getting lowered share of agricultural income in gross farm income should be given more attention and tackled. Prescriptions, even if not detailed, may be suggested as follows. 1) A variety of policy tools are implemented to facilitate inflow and ‘soft-landing’ (settlement) of young farmers. However, our finding shows that those target groups depend more on non-agricultural economic activities than farming. To enable them to play a role as active and core farmers, such problems as difficulties in learning farming techniques, acquiring agricultural land, and insufficient investment capital are to be addressed. 2) Aged farmers accounting for a large portion of farms have suffered from failing to obtain “enough” income. That limited opportunities for off-farm income-generating activities have worsened the situation. Farming-related part-time kind of gainful activities need to be designed and introduced to mitigate their problems. 3) For “large” farms, price fluctuation (leading to income instability) is of great concern. Relevant policy instruments are to be fine-tuned. 4) The economic distress faced by “small” farms (especially SO type farms) might not be solved solely by agricultural problems. Closer linkage with other policy domains, e.g. basic pension, and effective reform of retirement-and-succession program are to be desired. 5) Besides, enhancing rural infrastructure is also important in that relatively poor transport, daily-life-service (hospital, market accessibility etc.) conditions are also responsible for the living standard in rural areas.
SUMMARY AND CONCLUSION
Farm economy in Korea has been, in real terms, stagnated or decreased over a recent decade. What’s more, income inequality problem has been recognized as not thoroughly new but unprecedentedly serious problem. As a result, a large number of researchers and policy-makers are concerned in that when no effective and in-time policy responses are made, Korean farm economy might be “withered” in the future.
Also it is noteworthy that different types of farms are affected very differently in terms of income and poverty. Based on diagnoses for improving income by farm type, some policy suggestions could be made as follows. First, enhanced accessibility to production assets, e.g. arable land and finance, is required, especially for new young entrants and those who seek to expand their farm size. Second, a dense and reliable income safety net is more desired for the aged small size farm holders. They might not be as “productive” as they used to be or compared to other groups. Nevertheless paying attention to the vulnerable people does matter in that they account for the largest share of farm population and that providing them with a safety-net might work to save social costs as a whole. This rationale could be applied to the Direct Payment Scheme reform recently undergone in Korea. For example, differentiating per hectare payment rate to enable “small” farmers may receive more could, at least partially, mitigate the formidable challenges faced by lots of farms in Korea.
REFERENCES
Kang, H.J. 2015. “An Analysis of the Characteristics of Farm Households Experiencing Economic Crisis.” Korean Journal of Agricultural Management and Policy Volume 42, Number 2: 217-231.
Kim, M.B. and S.J., Park. 2014.『Agricultural Structure Change and Farm Economy: Poli Implications』. Agricultural Focus, No. 95(Oct. 2014), Korea Rural Economic Institute.
Kim, M.B, N.W, Oh, and E.S., Hwang. 2016. 『Income Structure Change by Farm Type: Policy Implications』. Agricultural Focus, No. 132(Aug. 2016), Korea Rural Economic Institute.
Rhew, C.H., H.S., Seo, and T.H., Kim. 2019. 『2013-2017 Farm Economy: Situations and Implications』. Agricultural Focus, No. 173(Apr. 2019), Korea Rural Economic Institute.
National Statistical Office. “Farm Economic Survey.”
Date submitted: Apr. 26, 2019
Reviewed, edited and uploaded: June. 13, 2019